This is part three in a series of blogposts exploring long-term disadvantage. Other posts in the series can be found here.
The previous post touched on the relationship between ethnicity, disadvantage and KS2-to-KS4 progress.
It made a simple distinction, with white British pupils in one group and all other minority ethnic pupils in another group. This showed that the impact of disadvantage for white pupils was higher than for minority ethnic pupils.
It is an area worthy of more detailed analysis, though.
To do this, we can look at each of the 20 minor ethnicity categories, as well as whether a child is considered to have English as an additional language (EAL).
Doing so, it’s possible to classify, for every ethnicity-EAL pairing, whether the impact of disadvantage is higher (H) or lower (L) than average, at each of Key Stages 1, 2 and 4, for both attainment and value added.
The table below shows the results of this. (EAL data is not shown where EAL pupils form less than 10% of their ethnic group.)
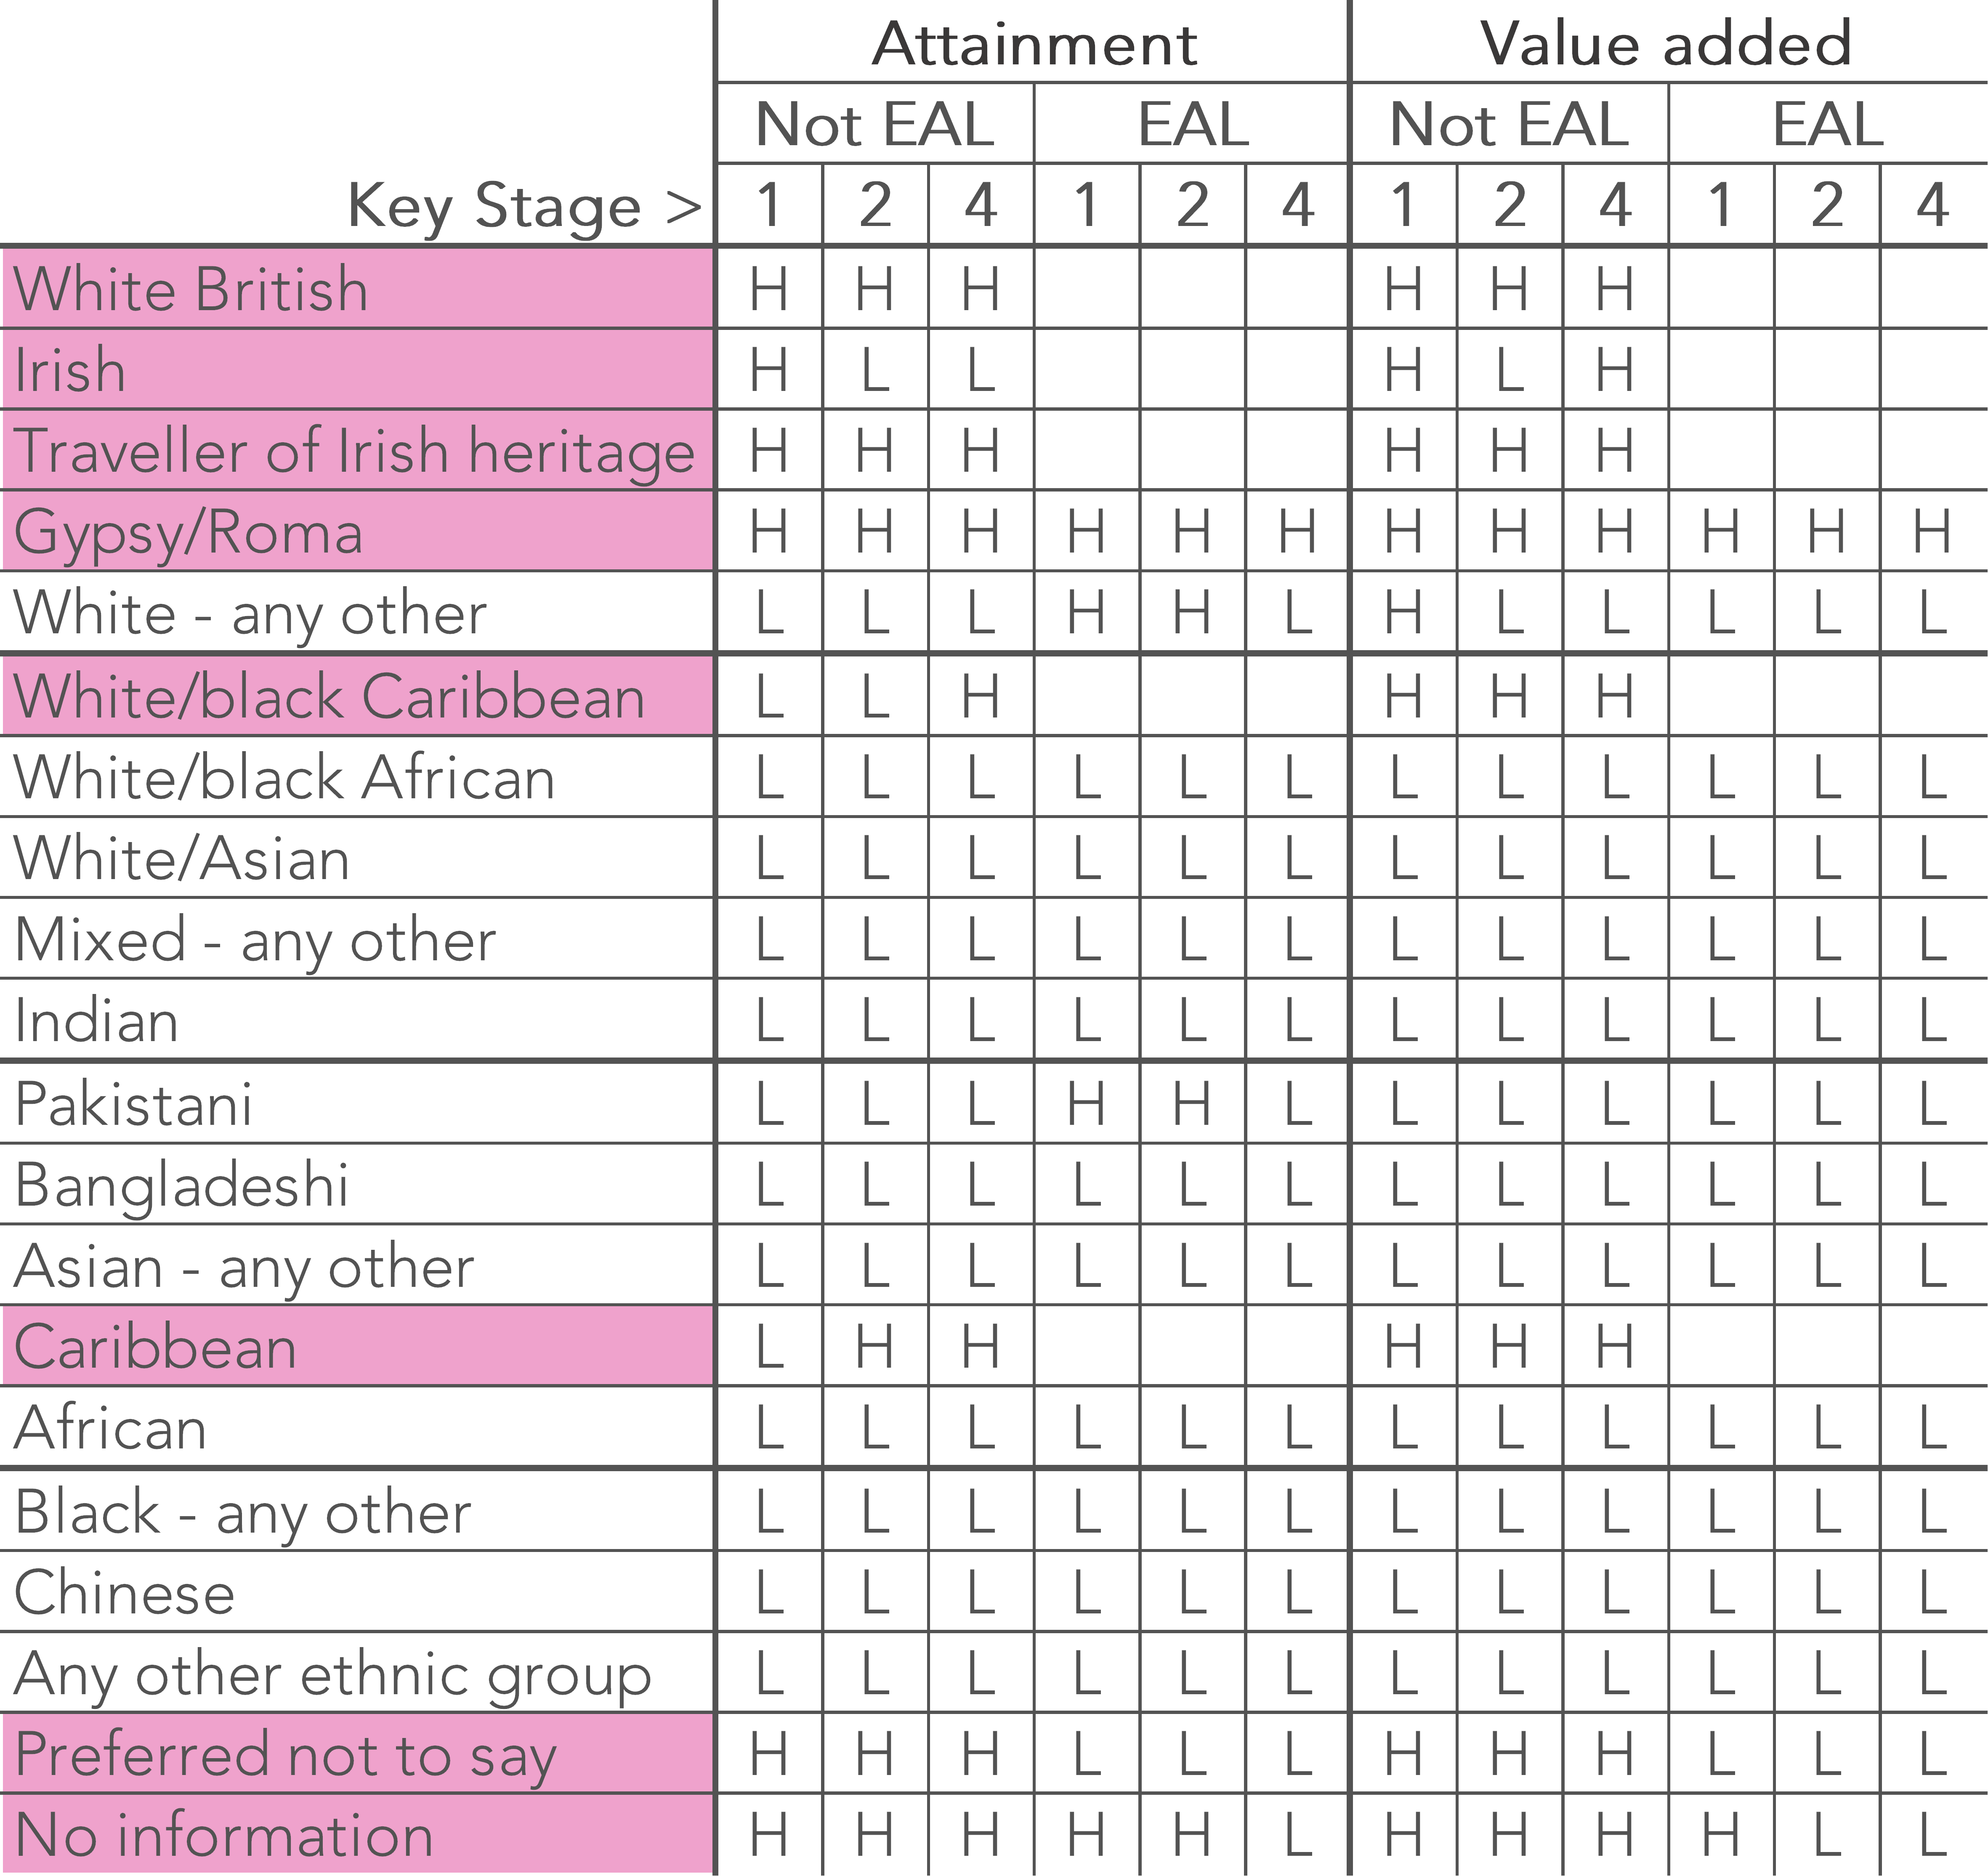
Based on the frequency with which disadvantage is seen to have a higher than average impact on attainment and value added, ethnic groups are classified as either those that see a large impact of disadvantage (shaded pink), or those that don’t (white).
The impact of long-term disadvantage
We can now look at how attainment and progress for groups where there is a higher, or lower, impact of disadvantage, is affected by the amount of time spent FSM-eligible. For simplicity we will focus on two groups who, between them, represent about 90% of the pupil cohort:
- pupils who are not EAL and are in ethnic groups where disadvantage has a high impact (c.75% of the cohort). This group we will call group A;
- pupils who have EAL and are in ethnic groups where disadvantage has a low impact (c.17% of the cohort). This group we will call group B.
We will focus on changes in progress (value added), because helping disadvantaged pupils to make the same progress as other pupils – or better – would be a major first step towards closing the attainment gap.
The analysis uses the FFT Index (introduced in part one; details here). This enables data over a number of years to be compared even where there are substantial changes to national tests. In each year the national average for all pupils is 100.
The charts show the trends in value added scores for children in groups A and B, by long-term disadvantage (defined here as spending 90% or more of their time since beginning school as FSM-eligible).
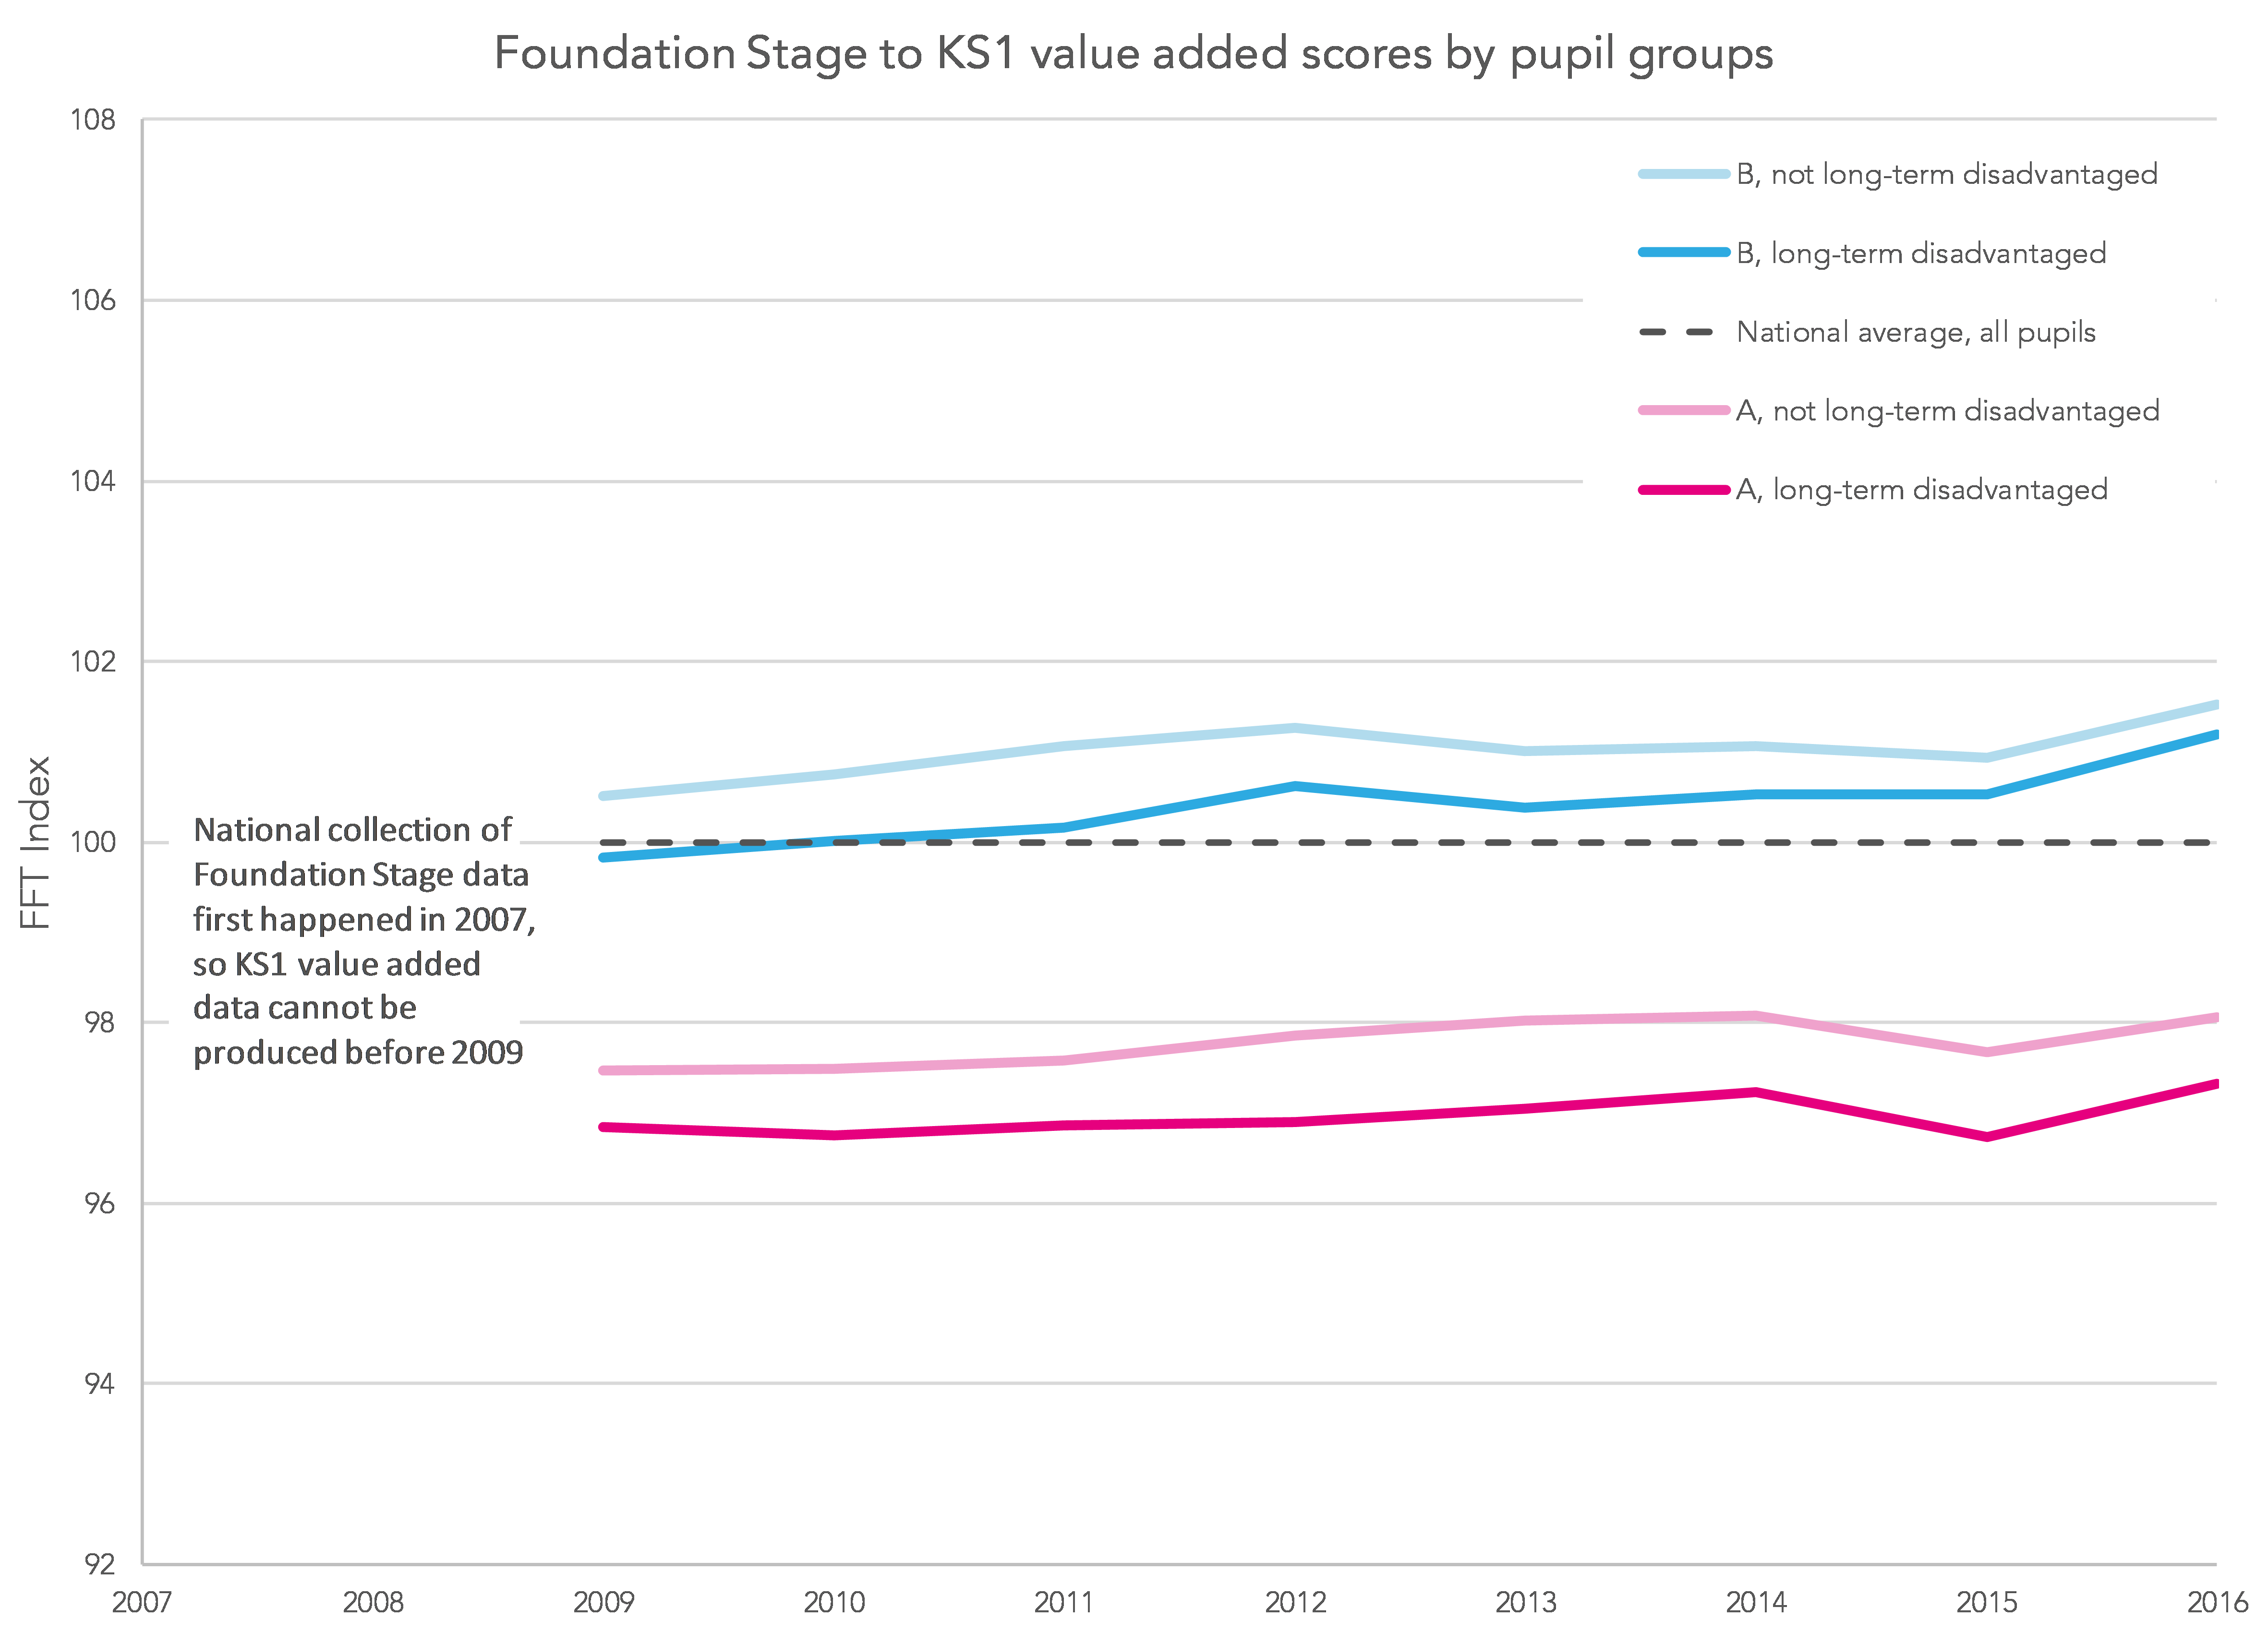
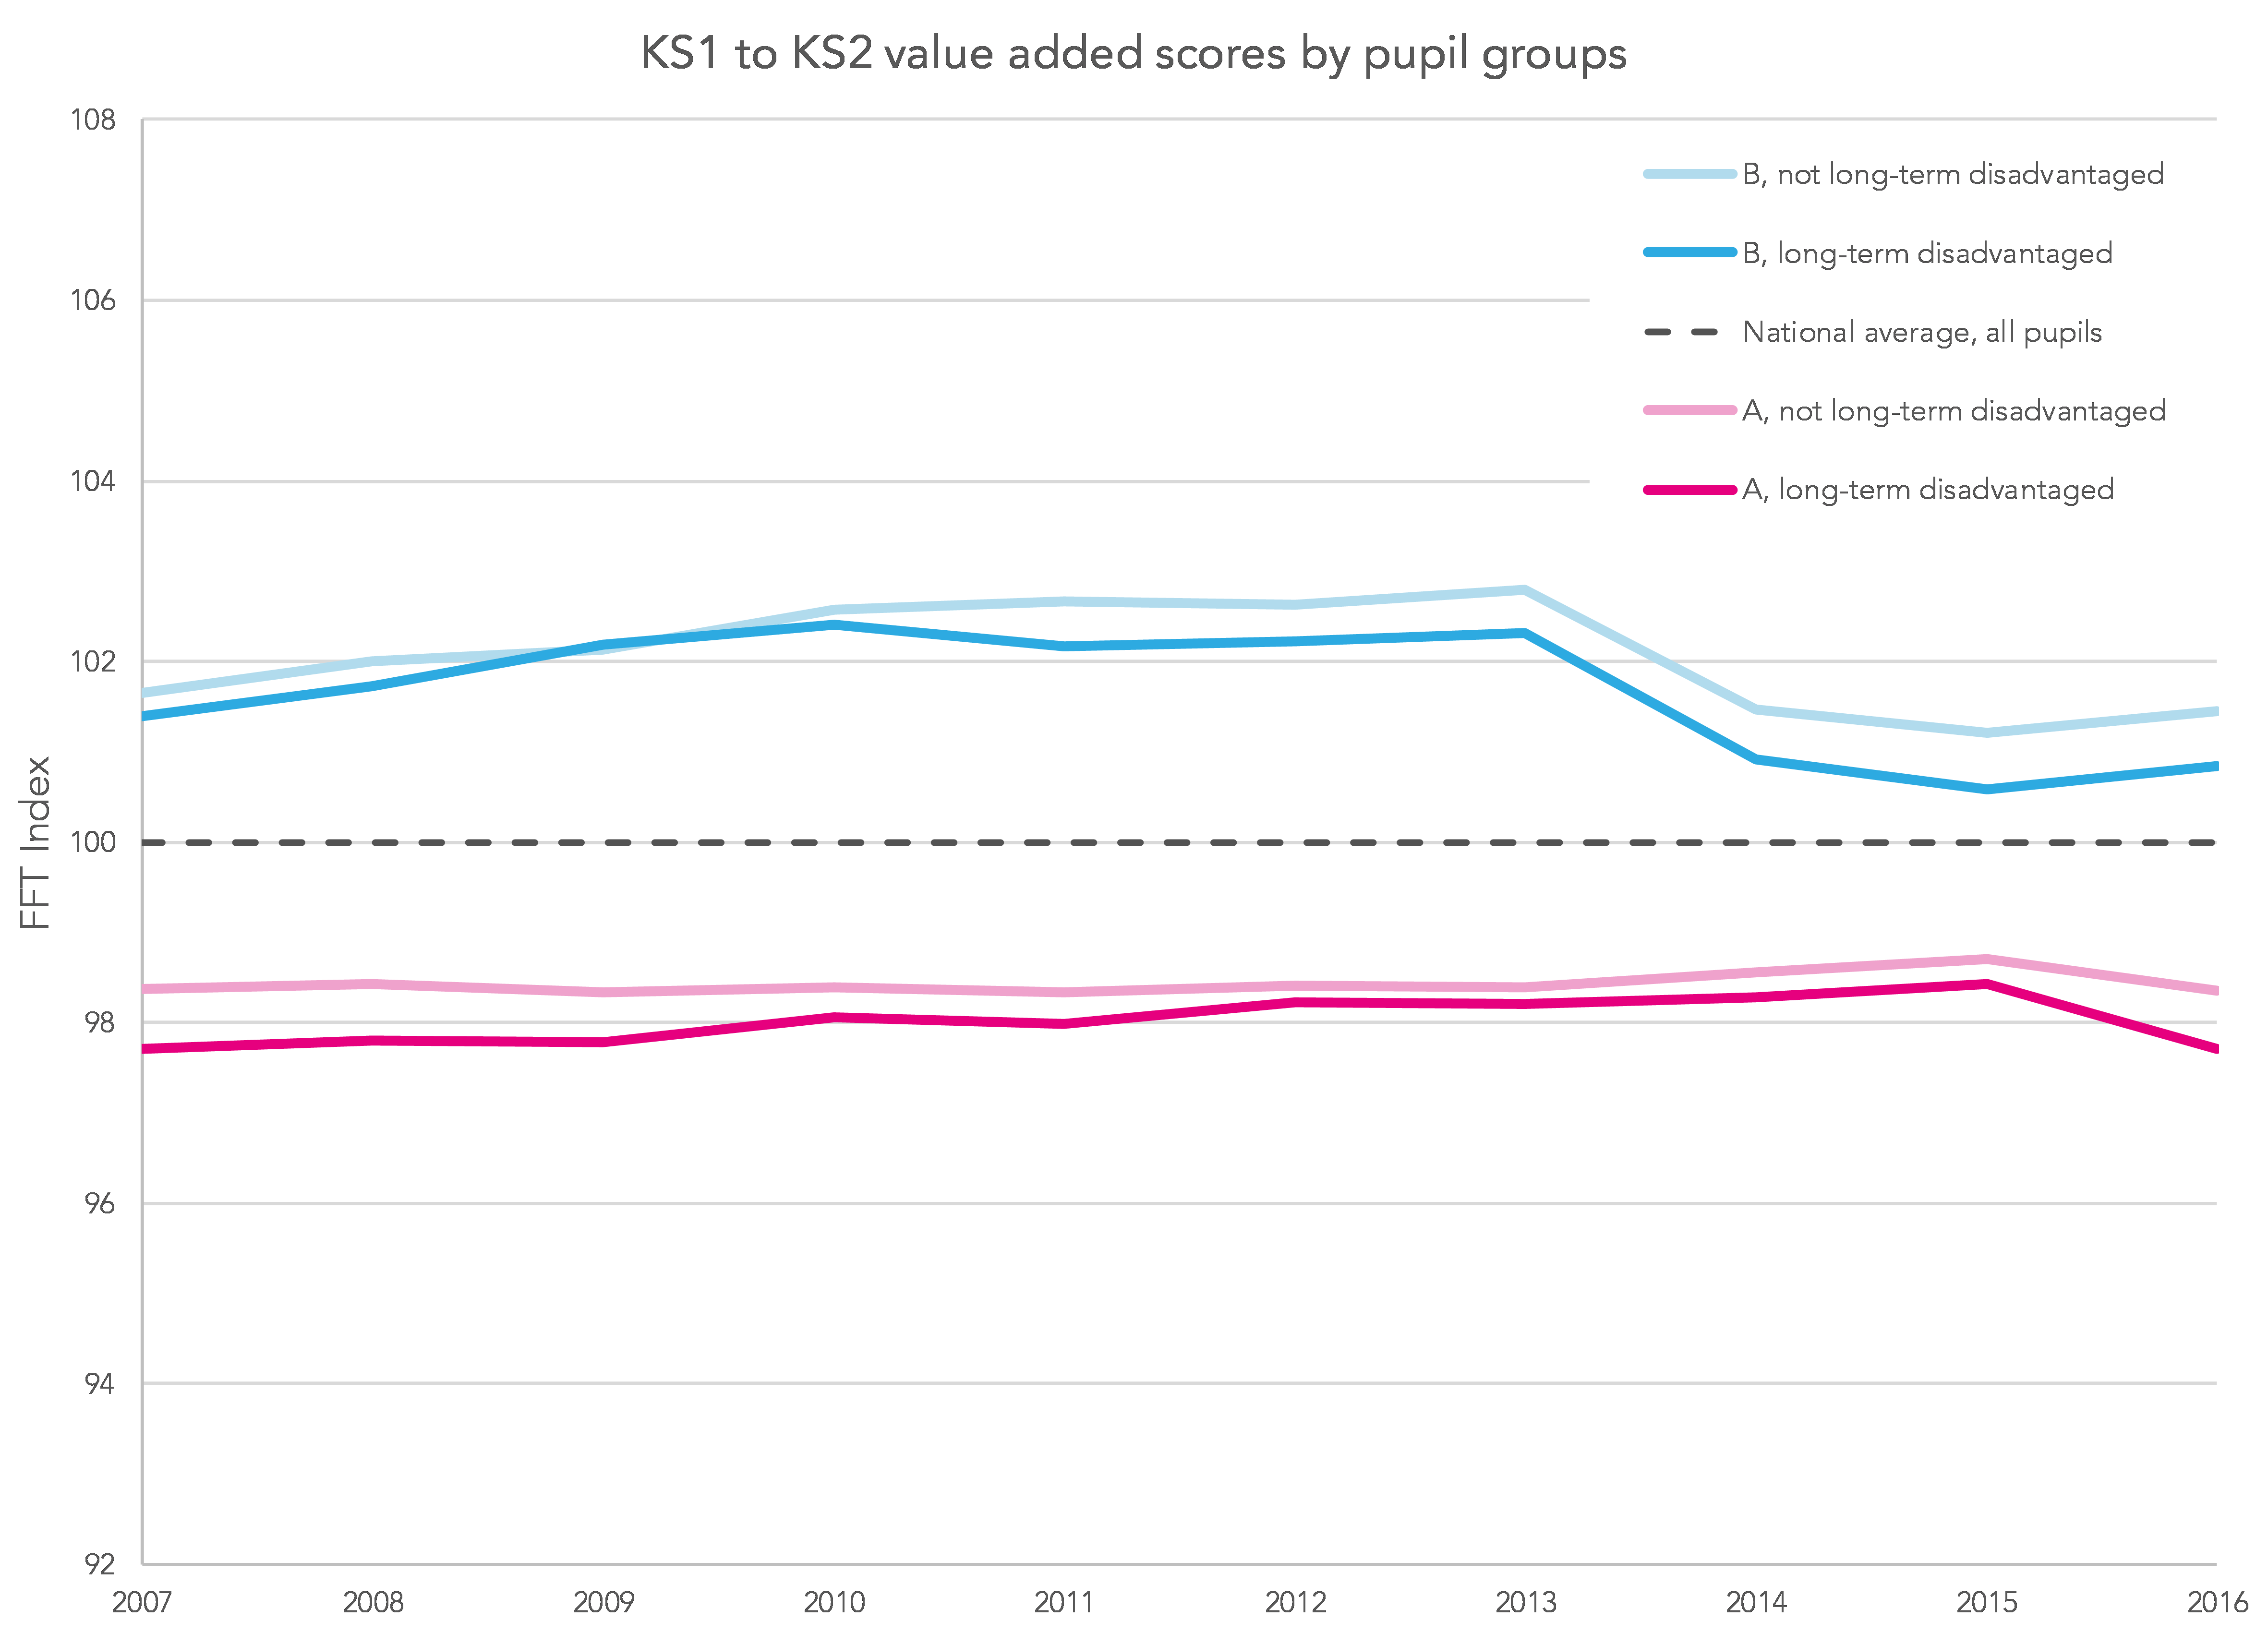
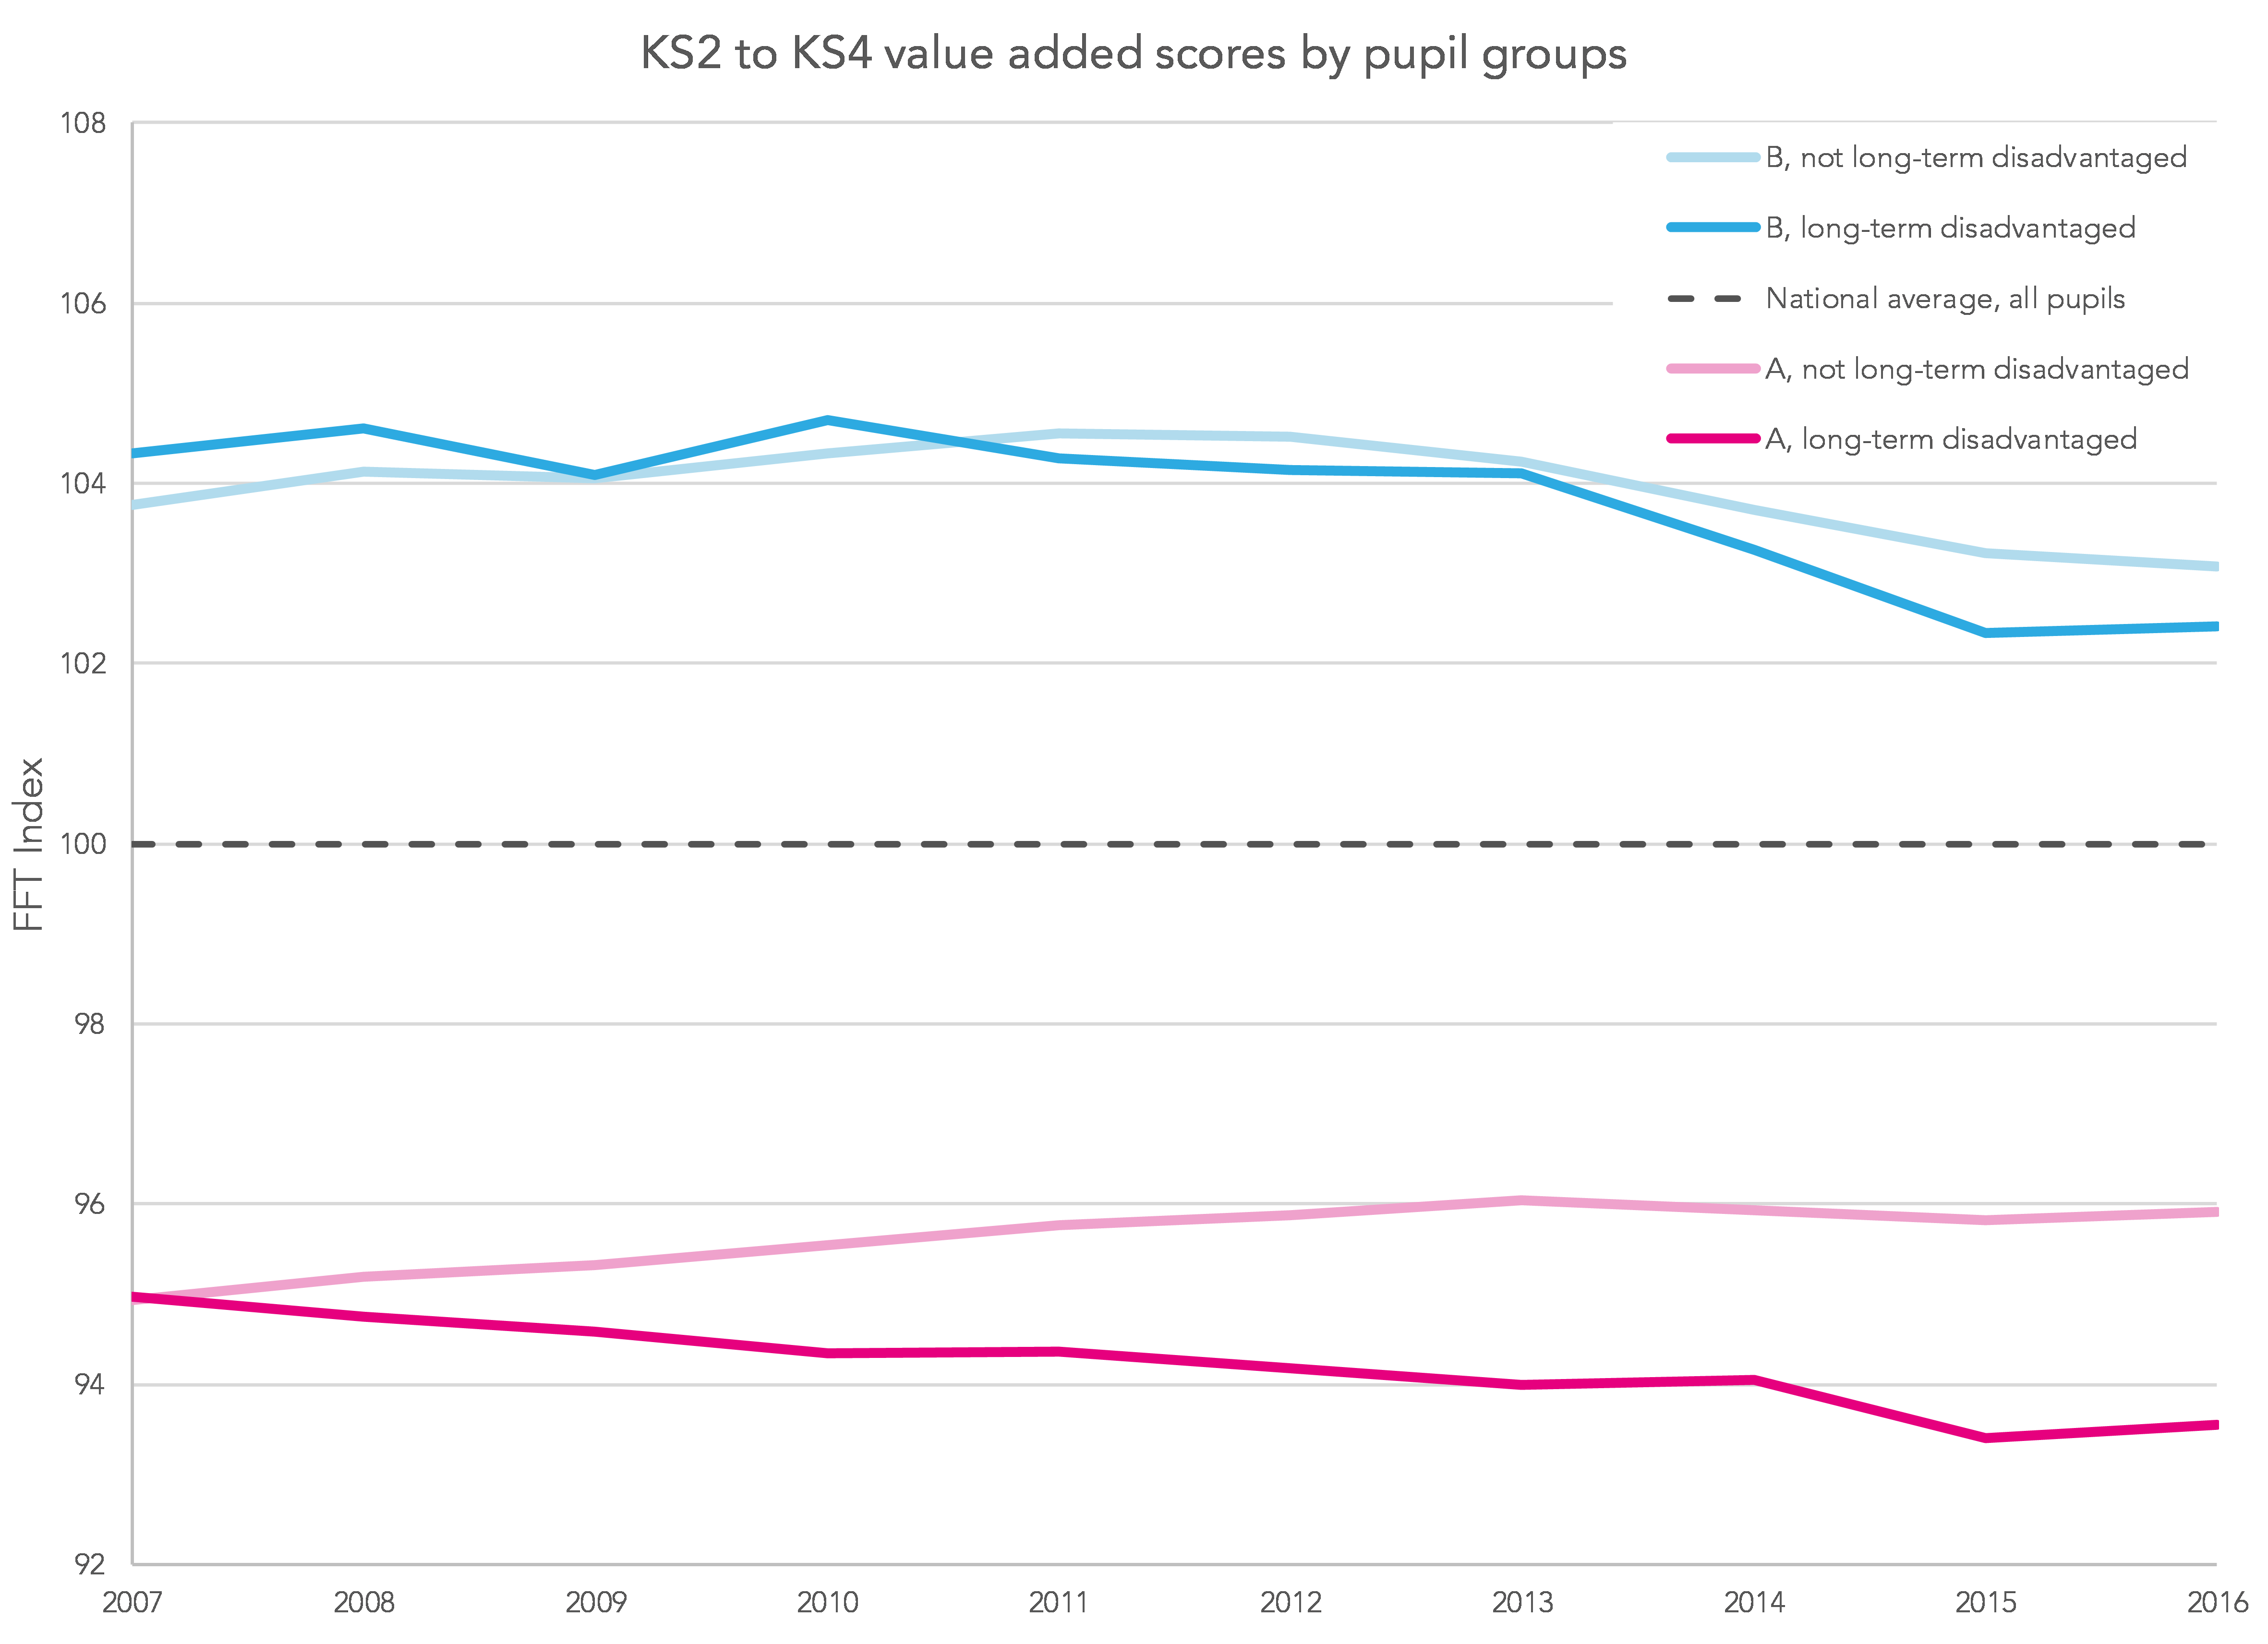
The charts show that progress (value added) for EAL pupils – group B – is consistently above the national average. It’s important, though, to remember that their attainment (not shown here) is lower than average at KS1 and KS2. Within the same minority ethnic group, the attainment of non-EAL pupils is also often slightly higher.
Pupils in the ‘high impact’ ethnicity groupings (mainly white British and black Caribbean) who have English as their first language – group A – make below average progress. This is why attainment gaps increase as we move from Foundation Stage through to KS4.
What is particularly noticeable is that pupils who have been FSM-eligible for over 90% of their time in school – the long-term disadvantaged group – make less progress than others. Relative to other pupils, their value added scores are lower – and, at KS4, they are falling further behind.
The implications
What are the implications of these differences? One aspect is that it’s clear that when comparing different groupings such as schools, local authorities and regions we cannot simply treat all disadvantaged pupils as a single group. At the very least we need to distinguish between pupils who have English as a first language and those who do not.
It’s also clear that there is a strong association between level of disadvantage (amount of time spent FSM-eligible) and educational attainment and progress. Whilst we must not see long-term disadvantage as an excuse, it is obvious that schools with a higher than average proportion of such pupils will have to work harder to close the gap.
And given that funding for schools is currently under much discussion we would suggest that some consideration be given to including a factor for the proportion of long-term disadvantaged pupils within each school’s Pupil Premium cohort.
If funding related to disadvantage were weighted according to the amount of time which pupils had spent eligible for free school meals, that would see an increase in the funding provided to around 500 secondary schools (albeit with a corresponding decrease in another roughly 500 schools) – something that we will return to in a later post.
Other questions this work prompts are:
- are there any variations between different regions?
- how much variation is there between schools?
- what are the implications of this for how we should evaluate the impact of Pupil Premium funding?
We aim to address these questions at some point in the future.
Want to stay up-to-date with the latest research from Education Datalab? Sign up to our mailing list to get notifications about new blogposts, or to receive our half-termly newsletter.


This is great research….thank you.
However, in terms of numbers as opposed to proportions, far more non-fsm pupils do badly at GCSE than fsm pupils. It would be interesting, one day, to know more about them.
Excellent series of blogposts!
The one thing that struck me as I was reading through (that isn’t already discussed) was that for group B, from KS1-2 and KS2-4, there is a big dropoff in the index value around 2014-15. Any ideas why this might be occurring?
Hi Ben,
I think that there are a number of factors behind the drop for group B. For all EAL pupils – whether disadvantaged of not – there’s a drop in the index score for VA from 2013 onwards. Some of this is due to improvements in VA for other pupils – the index calculates relative performance within each year so improvement for one group will be counterbalanced by decrease for other groups. The trend is more noticeable for VA than it is for attainment – which fits with data from KS1 which shows higher rate of improvement in attainment for group B.
I also had a quick look at regional variations. The ‘group B’ drop is fairly consistent across regions. For ‘group A’ pupils’ improvements are mostly found in London, North East and North West,
I also wonder if, in part, we are beginning to see the effects of the reduction in LA EAL support services in recent years?