Shortly before Christmas, Ofsted published its annual report, in which it discussed its concern for 490 ‘stuck’ schools – those which have been rated less than good in every inspection since September 2005.
Tellingly, the report says that the proportion of pupils at these schools who are both white British and eligible for free school meals is well above the national average. This is in response to a growing awareness that inspection outcomes for schools with higher proportions of such pupils tend to be lower.
Ofsted reported that 190 secondary schools are ‘stuck’, which represents about 6% of all secondary schools.
Of the 190, the vast majority – 184 – had their first full, section 5 (s5) inspection between September 2005 and August 2008.
They were rated satisfactory or inadequate then, and in every subsequent inspection. (Satisfactory became requires improvement after the introduction of a new inspection framework in September 2012.)
Many of these schools will have become academies or been part of a reorganisation since that first inspection. It’s not as if things haven’t been tried to improve them.
A comparison
Can we see anything different about ‘stuck’ schools compared to the rest?
In total, almost 1,400 secondary schools were rated satisfactory or inadequate in their first section 5 inspection between September 2005 and August 2008.
As of the end of 2017/18:
- 102 were rated outstanding;
- 723 were rated good;
- 286 were rated satisfactory or requires improvement;
- 134 were rated inadequate;
- 116 had either closed outright or been involved in a complex reorganisation that had resulted in pupils moving to different schools.
As the chart below shows, 14% of the 1,400 became ‘stuck’, and a further 6% either closed before becoming good. Those in the East Midlands and Yorkshire and the Humber tended to be more likely to become stuck or closed.

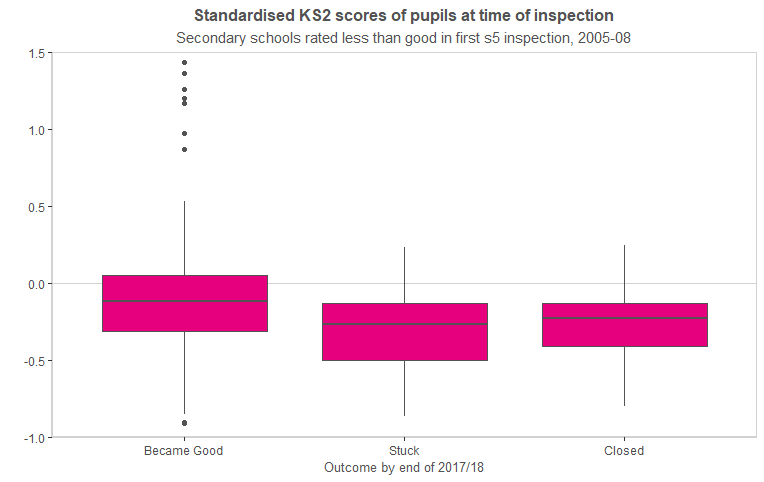
At the time of their first s5 inspection, ‘stuck’ schools tended to have greater proportions of white British, FSM-eligible pupils, and had lower average attainment on entry than schools which subsequently became good, as the next two charts show.

The time it takes to become good
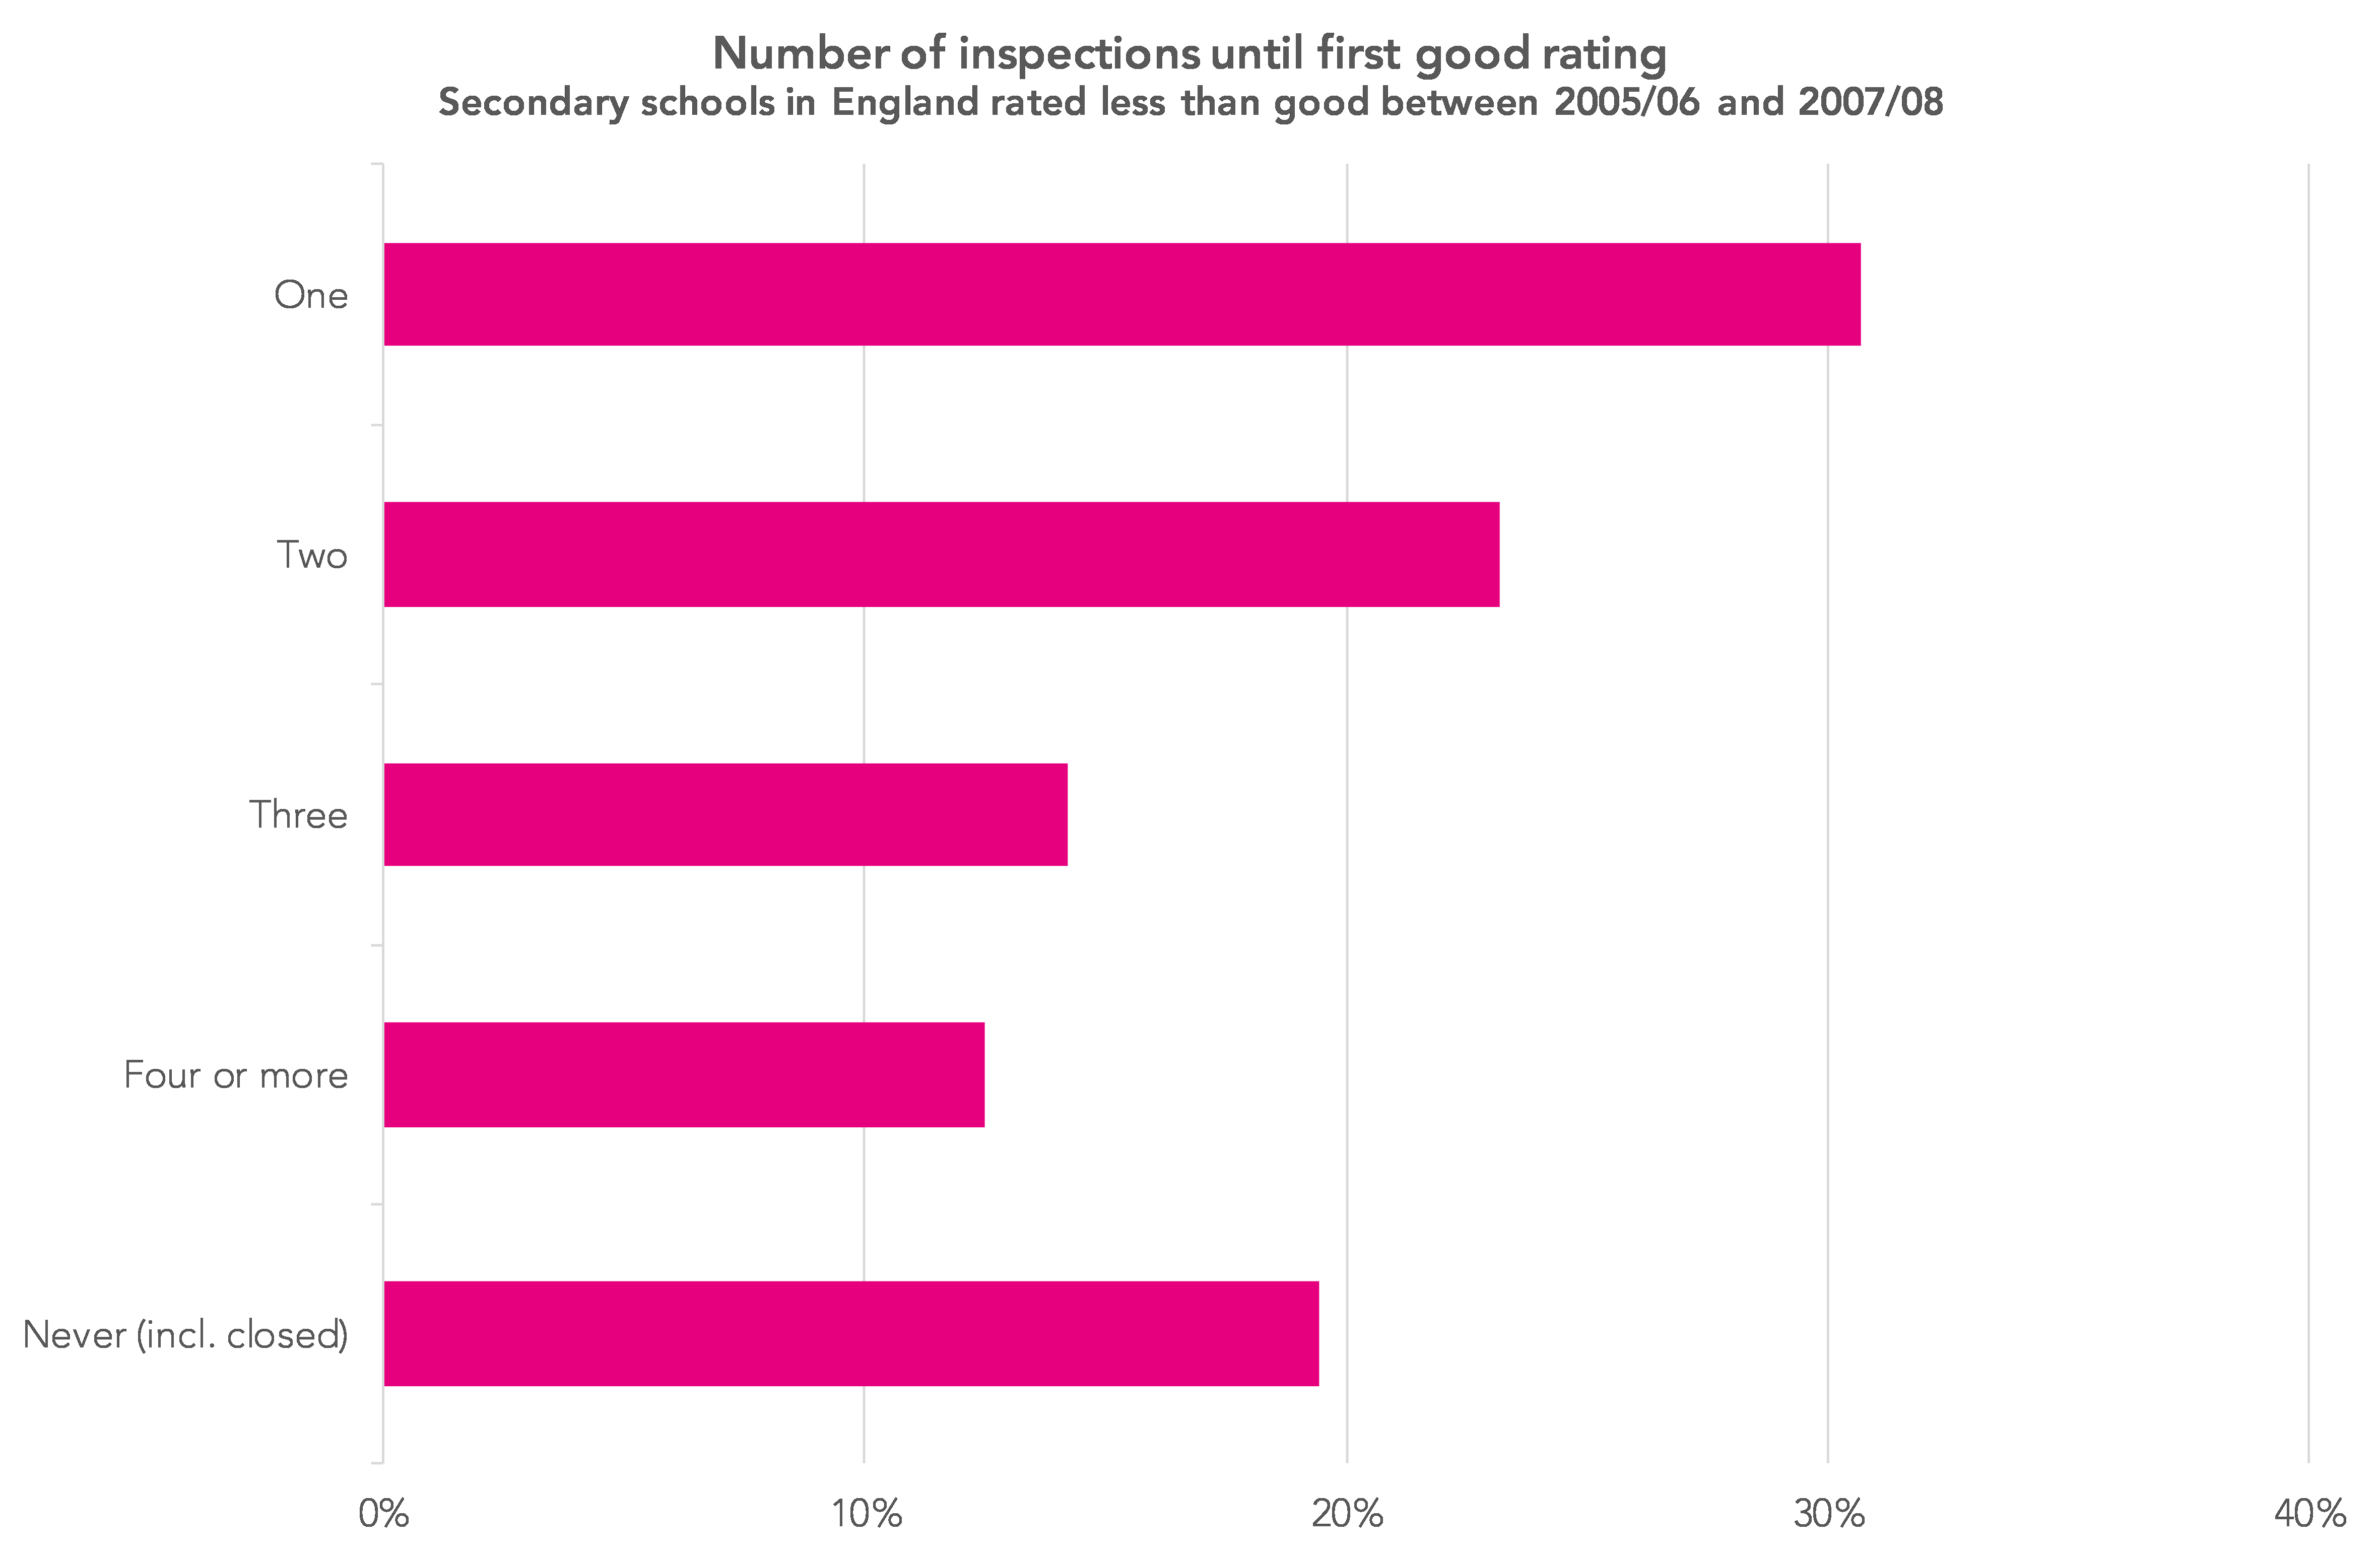
Around a third of the schools rated satisfactory or inadequate in their first s5 inspection between September 2005 and August 2008 were rated good or better in their next inspection, as the chart below shows.
When considering how long it takes to become good, we should bear in mind that most (80%) of the schools we’re looking at were rated satisfactory (which in those days meant good enough), and so would have been re-inspected around three years later. So it is perhaps no surprise that such schools spend a few years rated less than good.
But, as the chart below shows, what we see is that it took 300 weeks, or more than six years, to get half of the schools rated satisfactory to good (the first dotted line), and a further 100 weeks to get half of those rated inadequate to good.

So there’s nothing new in the idea of ‘stuck’ schools. It can take a while for a school to be rated good if it gets rated less than good.
This is especially true for schools with disadvantaged, low-attaining cohorts.
As we wrote in this blogpost about Knowsley – traditionally the lowest-performing local authority – plenty has been tried over the years to improve these schools. Is there much more left to try?
Want to stay up-to-date with the latest research from FFT Education Datalab? Sign up to Datalab’s mailing list to get notifications about new blogposts, or to receive the team’s half-termly newsletter.

This is an interesting and important study. During the 300 weeks (6 Years) there have been very significant changes to all of the accountability measures and their reporting that determine judgement at primary and secondary. There have been significant changes to the Ofsted Handbook, its grade descriptors and safeguarding thresholds. There have also been changes to the frequency of s5 visits. Schools likely to be good now are overdue inspection.
There is also the fundamental question of the consistency of Ofsted’s judgements as evidenced in studies of the relationship of Ofsted judgements to accountability measures.
How much difference is there between what we actually see, and what we’d see if we modelled the inspection process as a Markov chain, moving from state to state (e.g. Inadequate to Good) according to some (carefully chosen) probabilities, I wonder? Not that I’m cynical about the soundness of the inspection process or anything…