Data action hero James Pembroke recently published an entertaining blogpost asking how Key Stage 2 value added be calculated in 2020 when we run out of Levels.
In this far less enjoyable post, I’m going to have a look at the options open to analysts in the Department for Education. Although, no doubt, they’ve got it all under control.
The current situation
The 2019 Year 6 cohort were the final cohort to be assessed at Key Stage 1 using national curriculum Levels. The overwhelming majority of pupils were teacher-assessed in reading, writing and maths using seven ordered categories: working towards Level 1, Level 1, Level 2C, Level 2B, Level 2A, Level 3 and, in rare circumstances, Level 4. P-scale data was also collected for pupils working below Level 1.
There was a well-known method of turning these categories into point scores, e.g. 9 points for Level 1, 15 for Level 2B, 21 for Level 3 and so forth. There were six points between Levels, because pupils were expected to move one Level every two years. And two years is six terms, so 1 point = 1 term, right?
Having turned the categories into points, the average point score across all three subjects could be calculated. Maths was double-weighted in this calculation (as reading and writing are two measures of literacy).
Pupils were then banded into 24 prior attainment groups based on their Key Stage 1 average point score. The chart below shows the distribution of pupils from the 2017 Key Stage 2 cohort (2013 Key Stage 1 cohort) across the 24 groups.
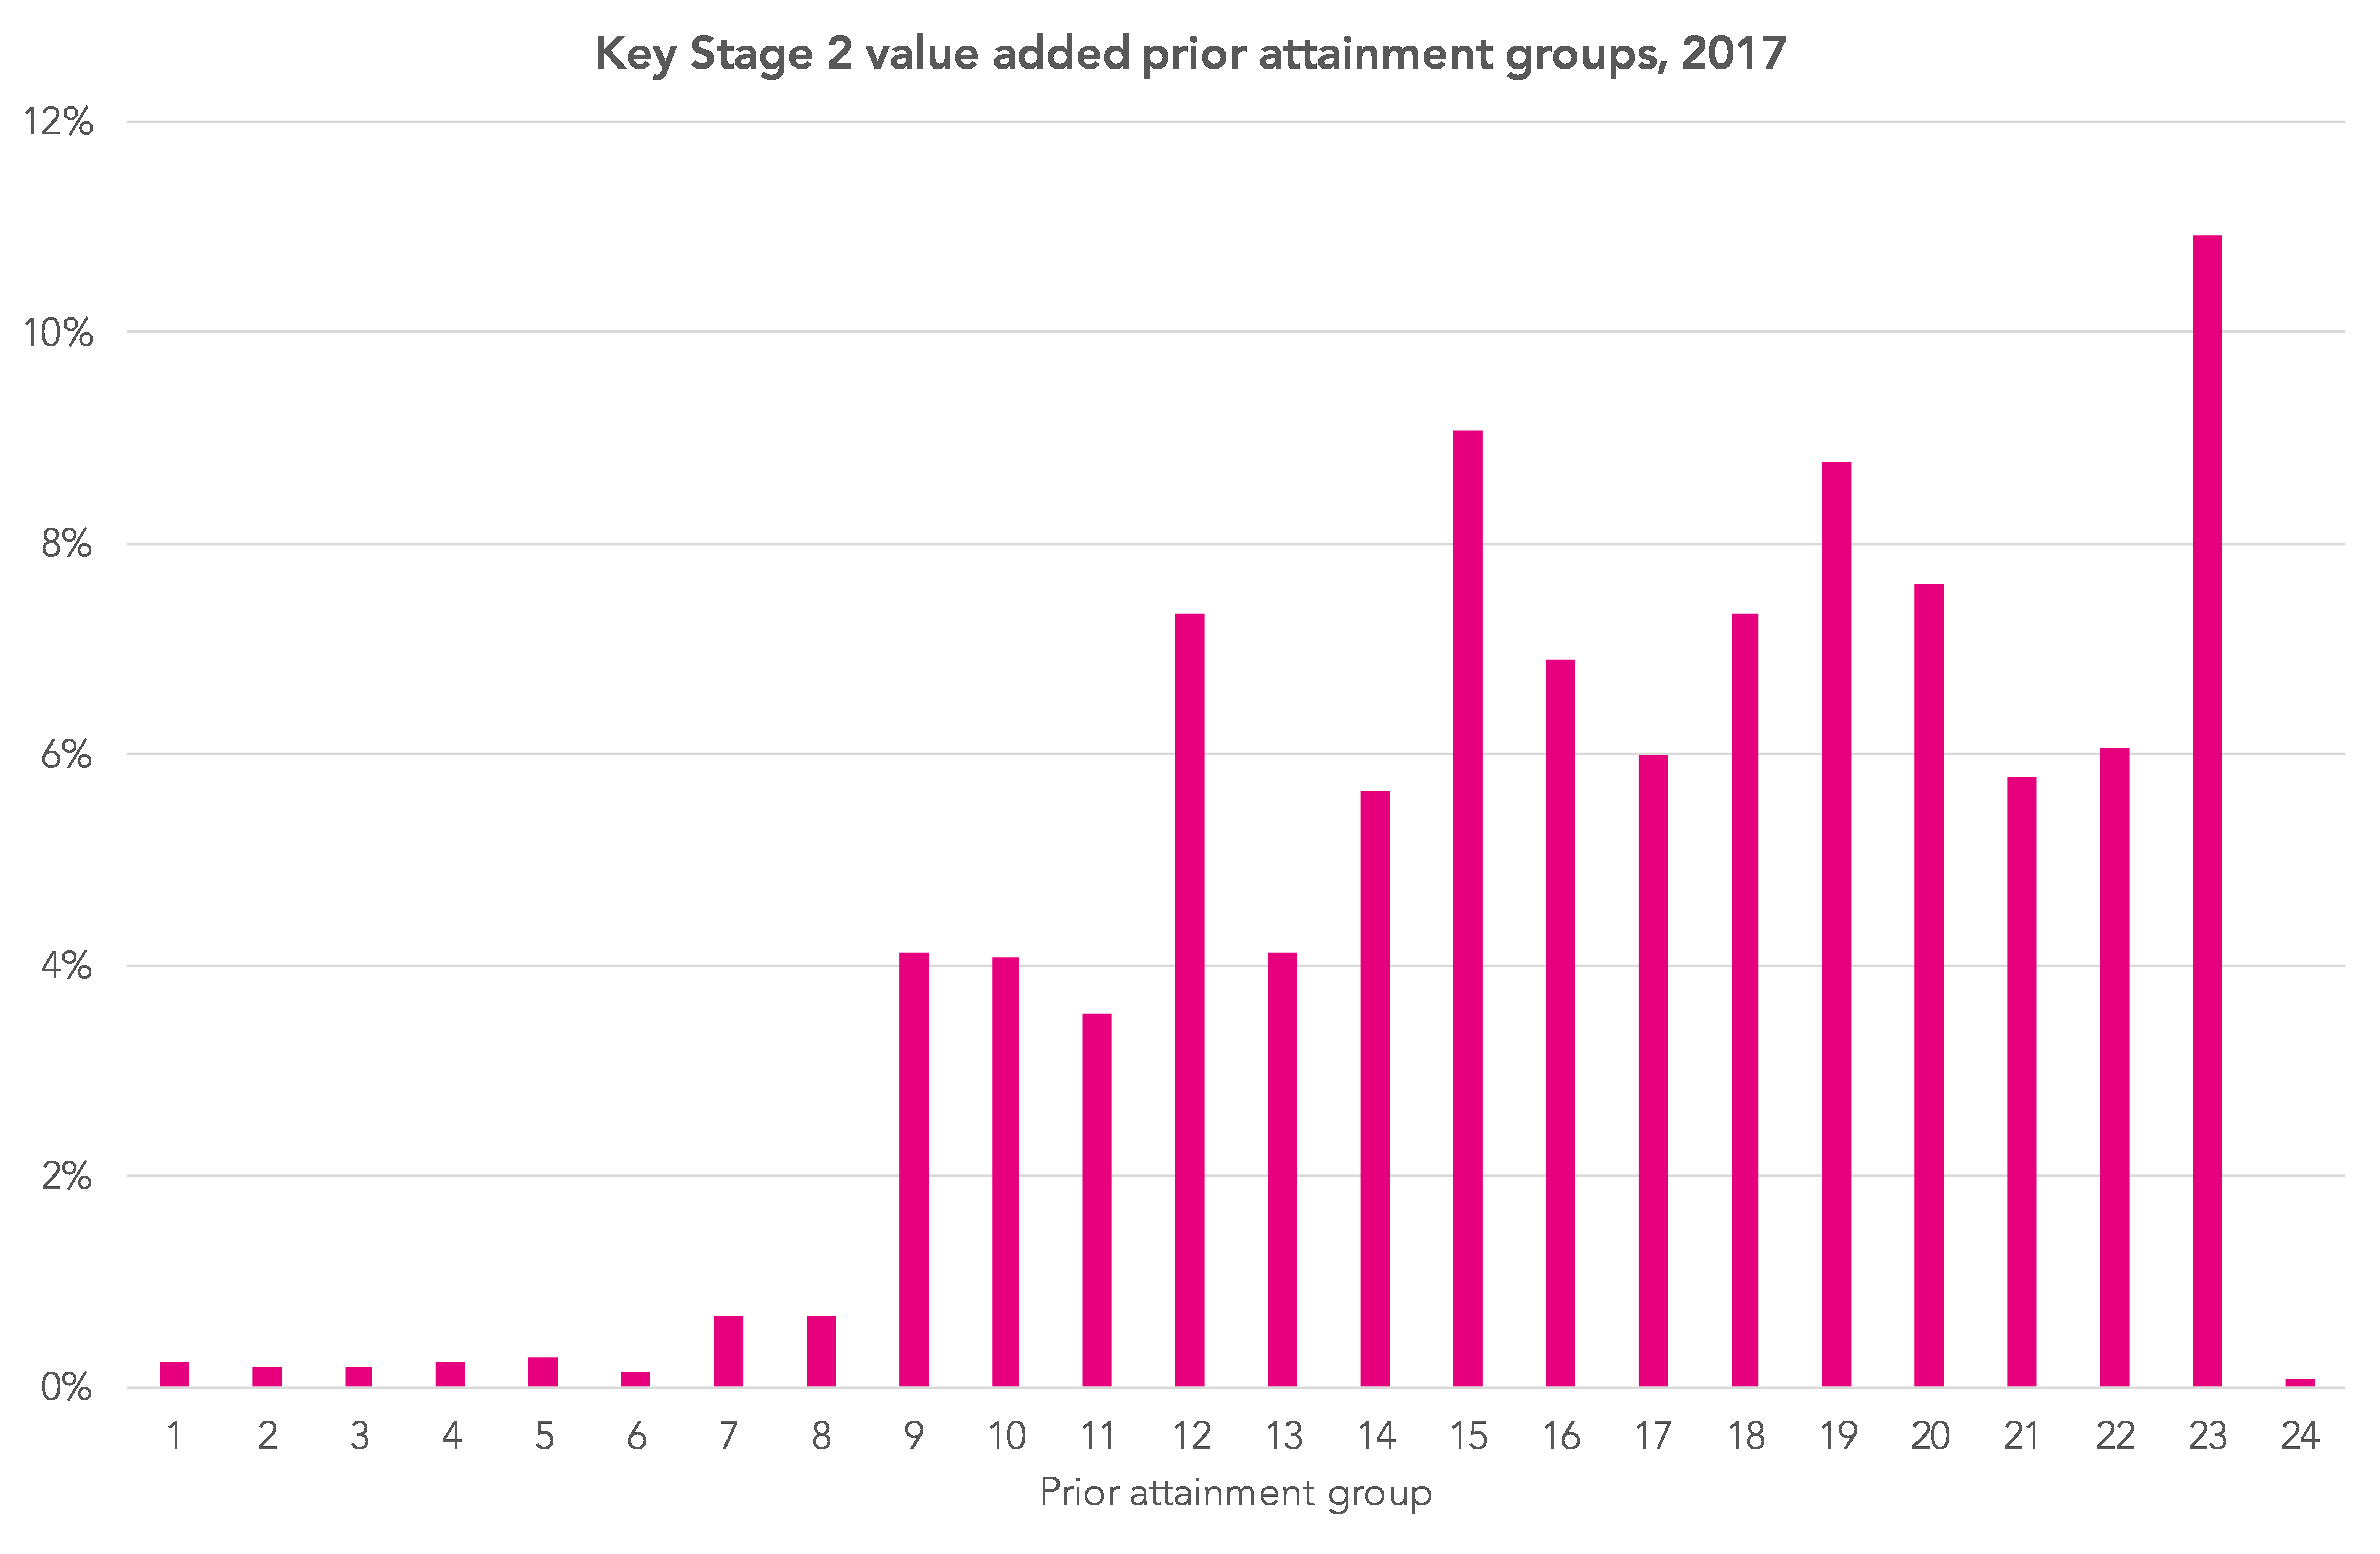
What we see from the chart is that the bands do not contain equal numbers of pupils. The 2.6% of pupils with the lowest KS1 average point score are spread across eight bands. Just 11 bands contain 5% or more of all pupils. The median pupil, with an average point score of 16 (equivalent to 2B/2B/2A), is in band 17 out of 24.
56% of the variation in pupils’ KS2 maths results can be explained by these 24 groups (54% and 52% are the corresponding figures for reading and writing). In other words, overall KS1 prior attainment is correlated relatively strongly with KS2 outcomes.
The new world
Pupils are still assessed at Key Stage 1 in reading, writing and maths. However, the classification now in use is different. There are five ordered categories, all of which are a mouthful:
- Below the pre-Key Stage standard (BLW)
- Foundations for the expected standard (PKF)
- Working towards the expected standard (WTS)
- Working at the expected standard (EXS)
- Working at greater depth within the expected standard (GDS)
In addition, p-scale data was collected for pupils assessed as BLW.
The chart below shows the percentage of pupils within each category in 2016.
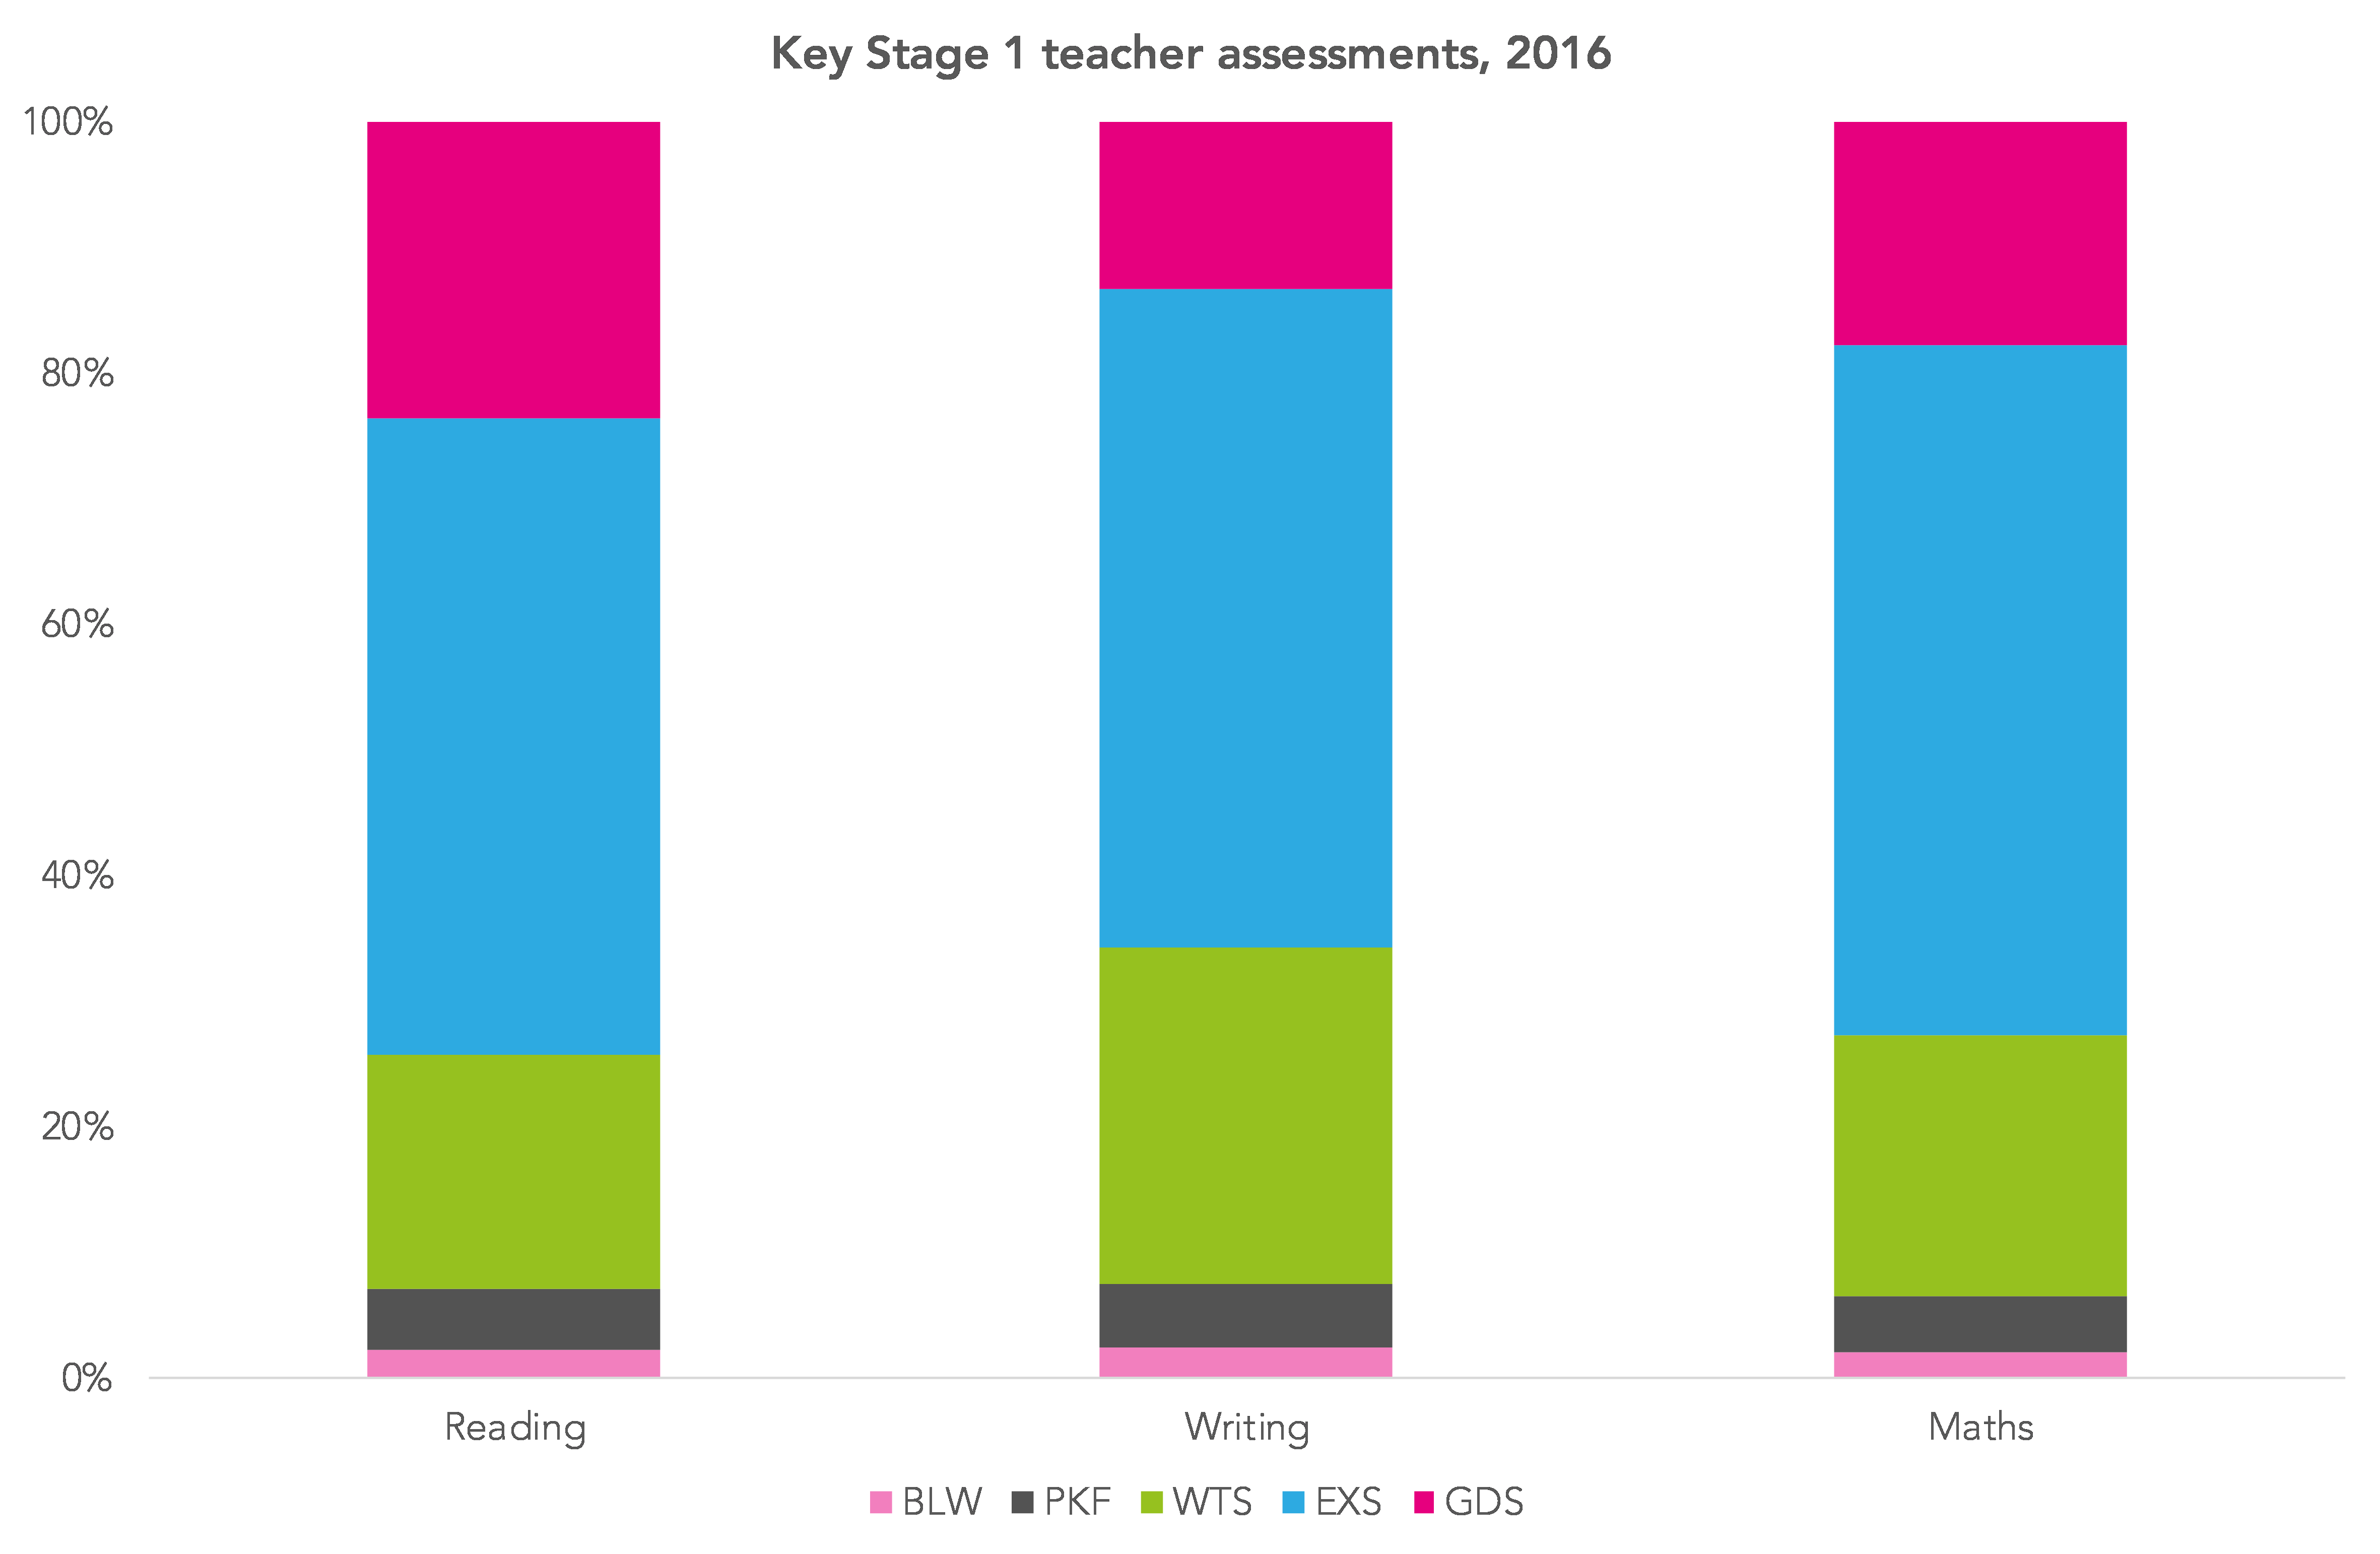
Relatively few pupils were assessed as PKF and BLW. Over half were assessed as EXS. Writing appears to have been assessed more severely than reading and maths.
So what options are open to the DfE?
Option 1: Create look-up tables for each combination
To calculate Key Stage 2 value added, the average KS2 score in each subject could be calculated for each combination of KS1 reading, writing and maths teacher assessment.
If we leave aside p-scales, there are 125 possible combinations of the five KS1 teacher assessment categories, although in practice some are implausible. In total, 99 combinations were observed in the 2016 Key Stage 1 data (40 of the groups contained fewer than 50 pupils). So we probably need some sort of way of grouping them together.
There would be 64 possible combinations if we combined BLW and PKF, although again some would contain very small numbers of pupils and some would contain none at all.
Alternatively, we could treat teacher assessments in each subject equivalently. This would mean a pupil who achieved EXP in reading, EXP in writing and GDS in maths would be in the same group as someone with GDS in reading, EXP in writing and EXP in maths.
This is similar to the current KS1 average point score method which takes no account of differences in attainment between the subjects, and would generate 20 groups.
The downside is that you might expect a pupil with higher prior attainment in maths to achieve a higher maths result at KS2 and the pupil with higher prior attainment in reading to achieve a higher reading result at KS2.
Following this approach, and using LOW for the combination of BLW and PKF, the 2016 cohort can be grouped as follows:
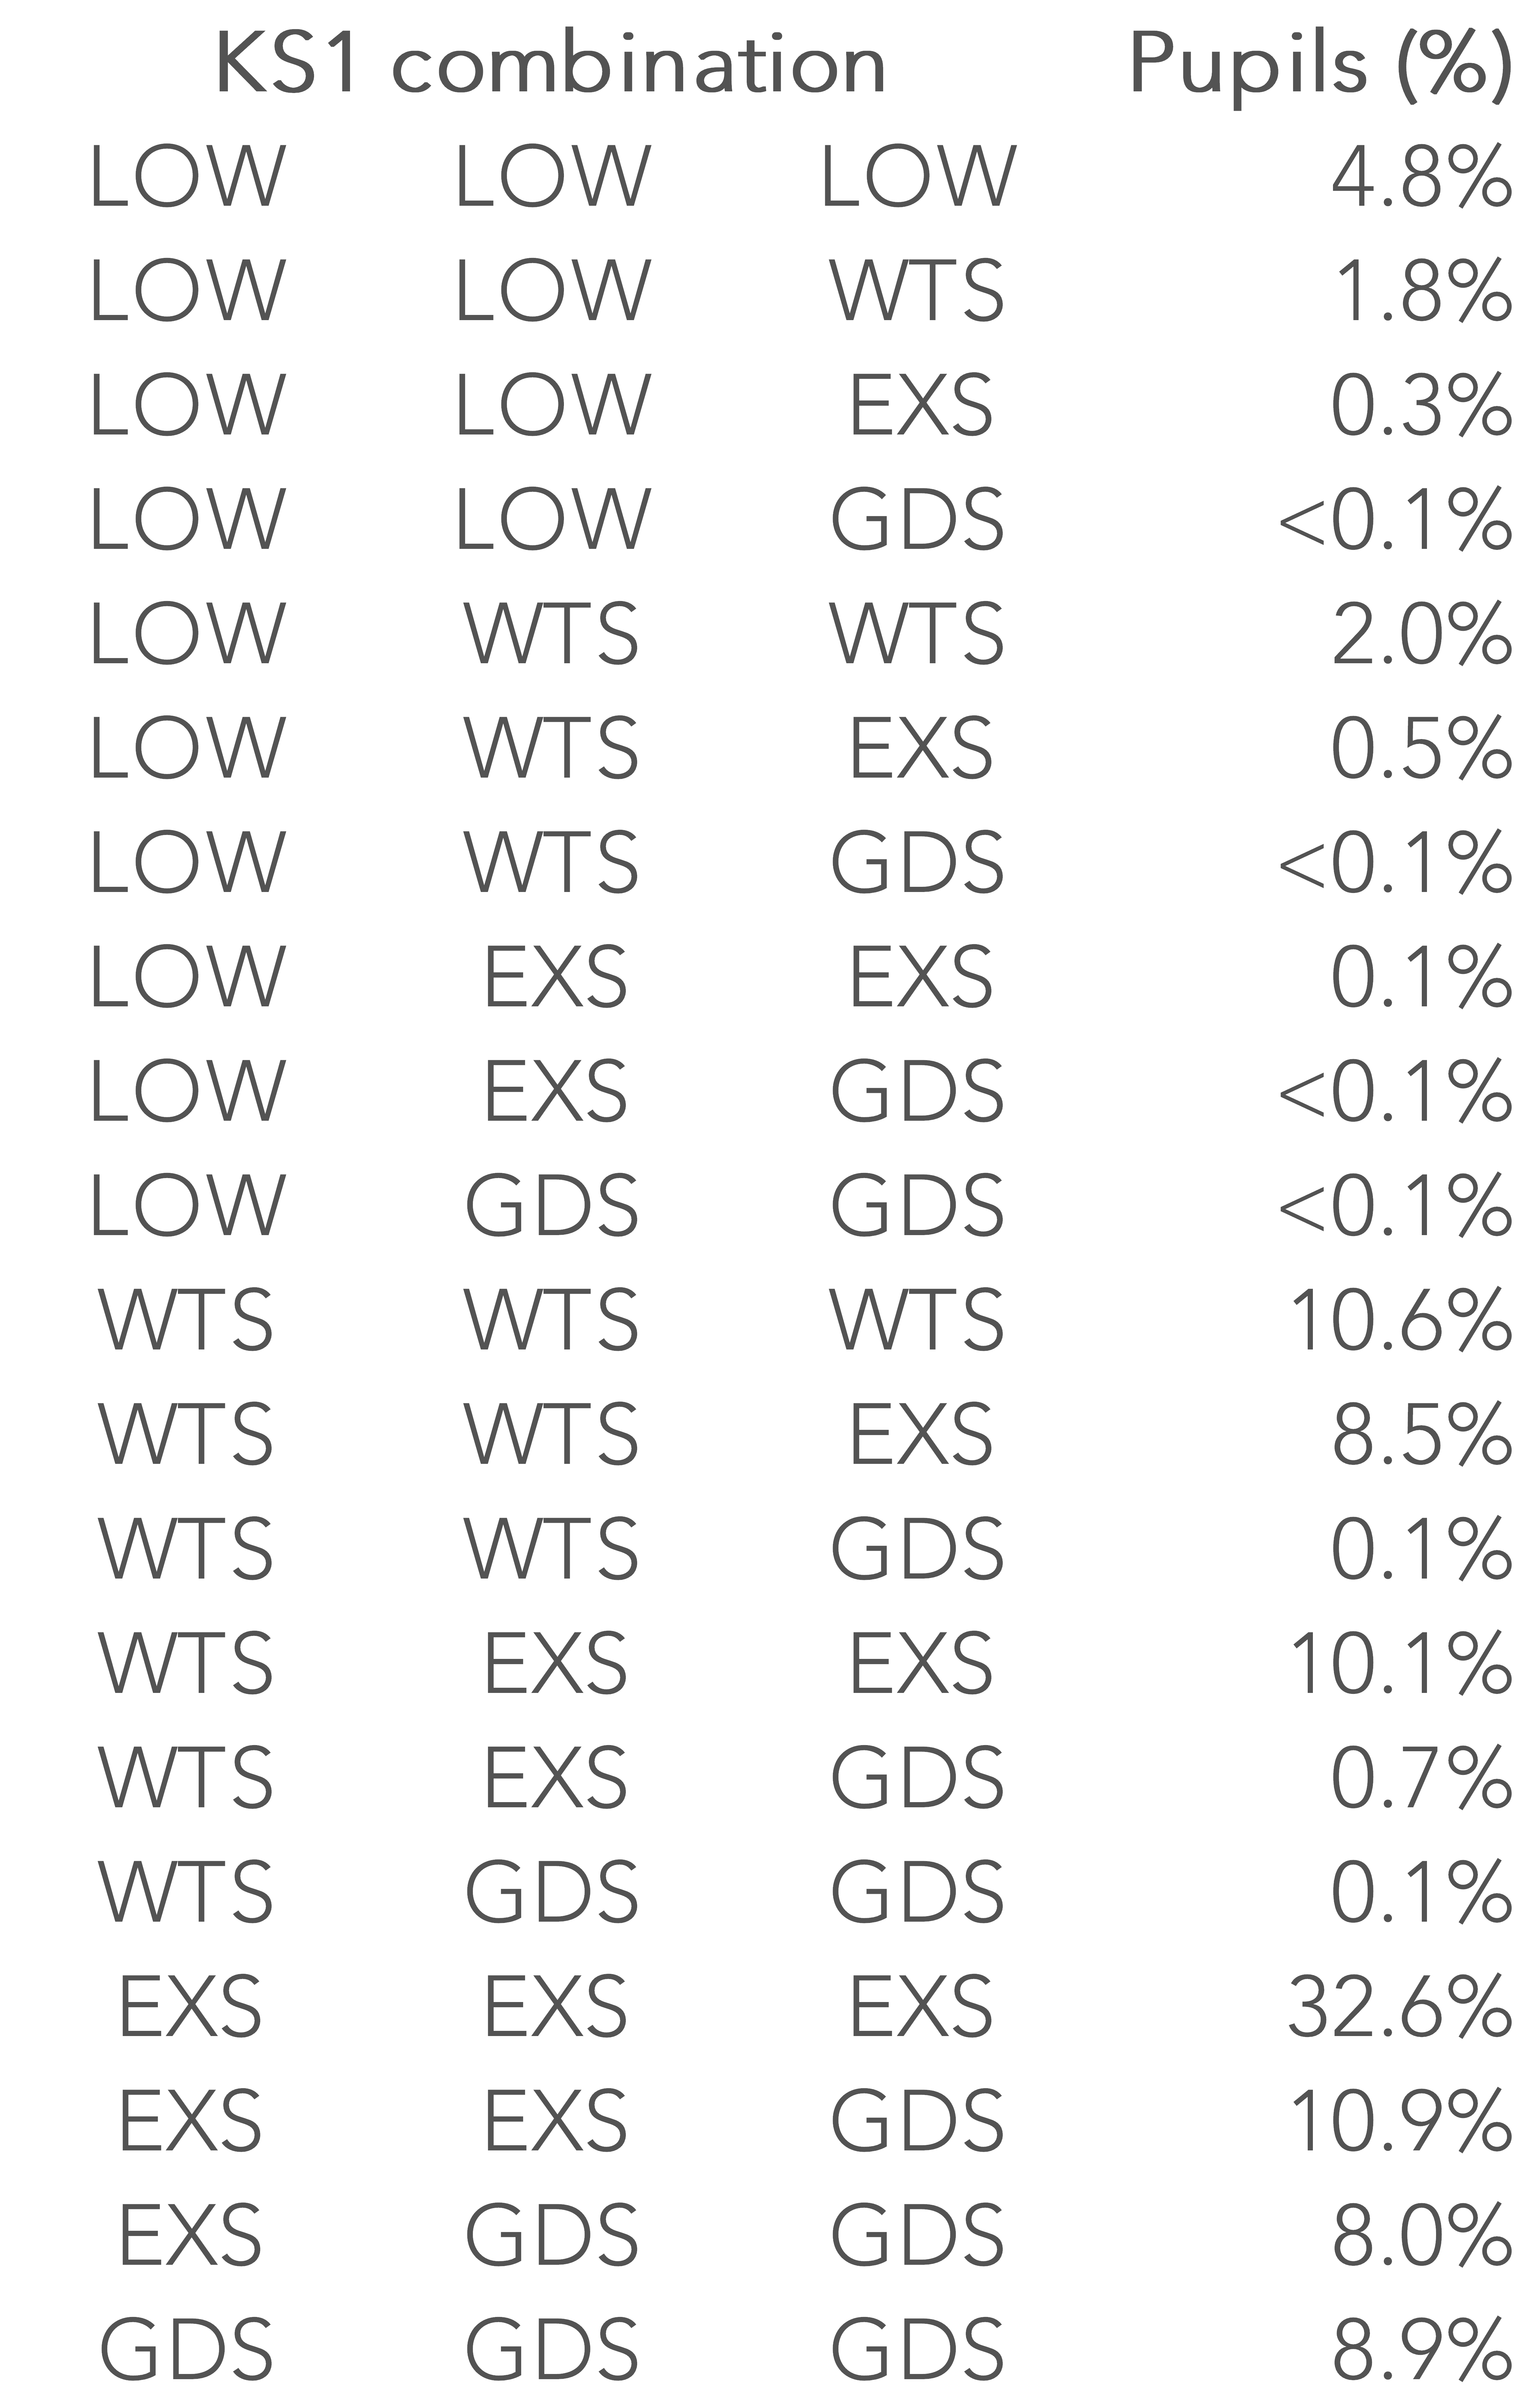
There are a number of small groups which could perhaps be combined with other groups in some way.
But the biggest headache is that almost a third of pupils were assessed as working at the expected standard (EXS) in all three subjects. All of these pupils would have the same expected (predicted) scores in a KS2 value added calculation.
The current Early Years Foundation Stage Profile has a similar ‘spike’, with a large proportion of pupils assessed as working at the expected standard in every one of the 17 areas of learning.
Option 2: Create point scores
There is no ‘official’ method of converting the new KS1 categories into point scores but this could be done in any number of ways.
One way is to assume that pupils’ teacher assessments are correlated with an unobserved latent scale. Psychometricians tend to call this ‘ability’ but this can have negative connotations in the real world, so I’ll refer to it as ‘overall attainment at the end of Key Stage 1’.
There are numerous ways of estimating this measure. One example is factor analysis. This assumes that overall attainment is normally distributed (the bell curve) and produces a score with a mean of 0 and a standard deviation of 1.
This can be converted to a standardised (not scaled) score by multiplying by 15 and adding 100. This means that the average score becomes 100 rather than 0 and we don’t have to work with negative numbers.
The standardized score can then be banded into groups. In the chart below, I’ve created 24 groups, the same as the current KS1-KS2 measure.
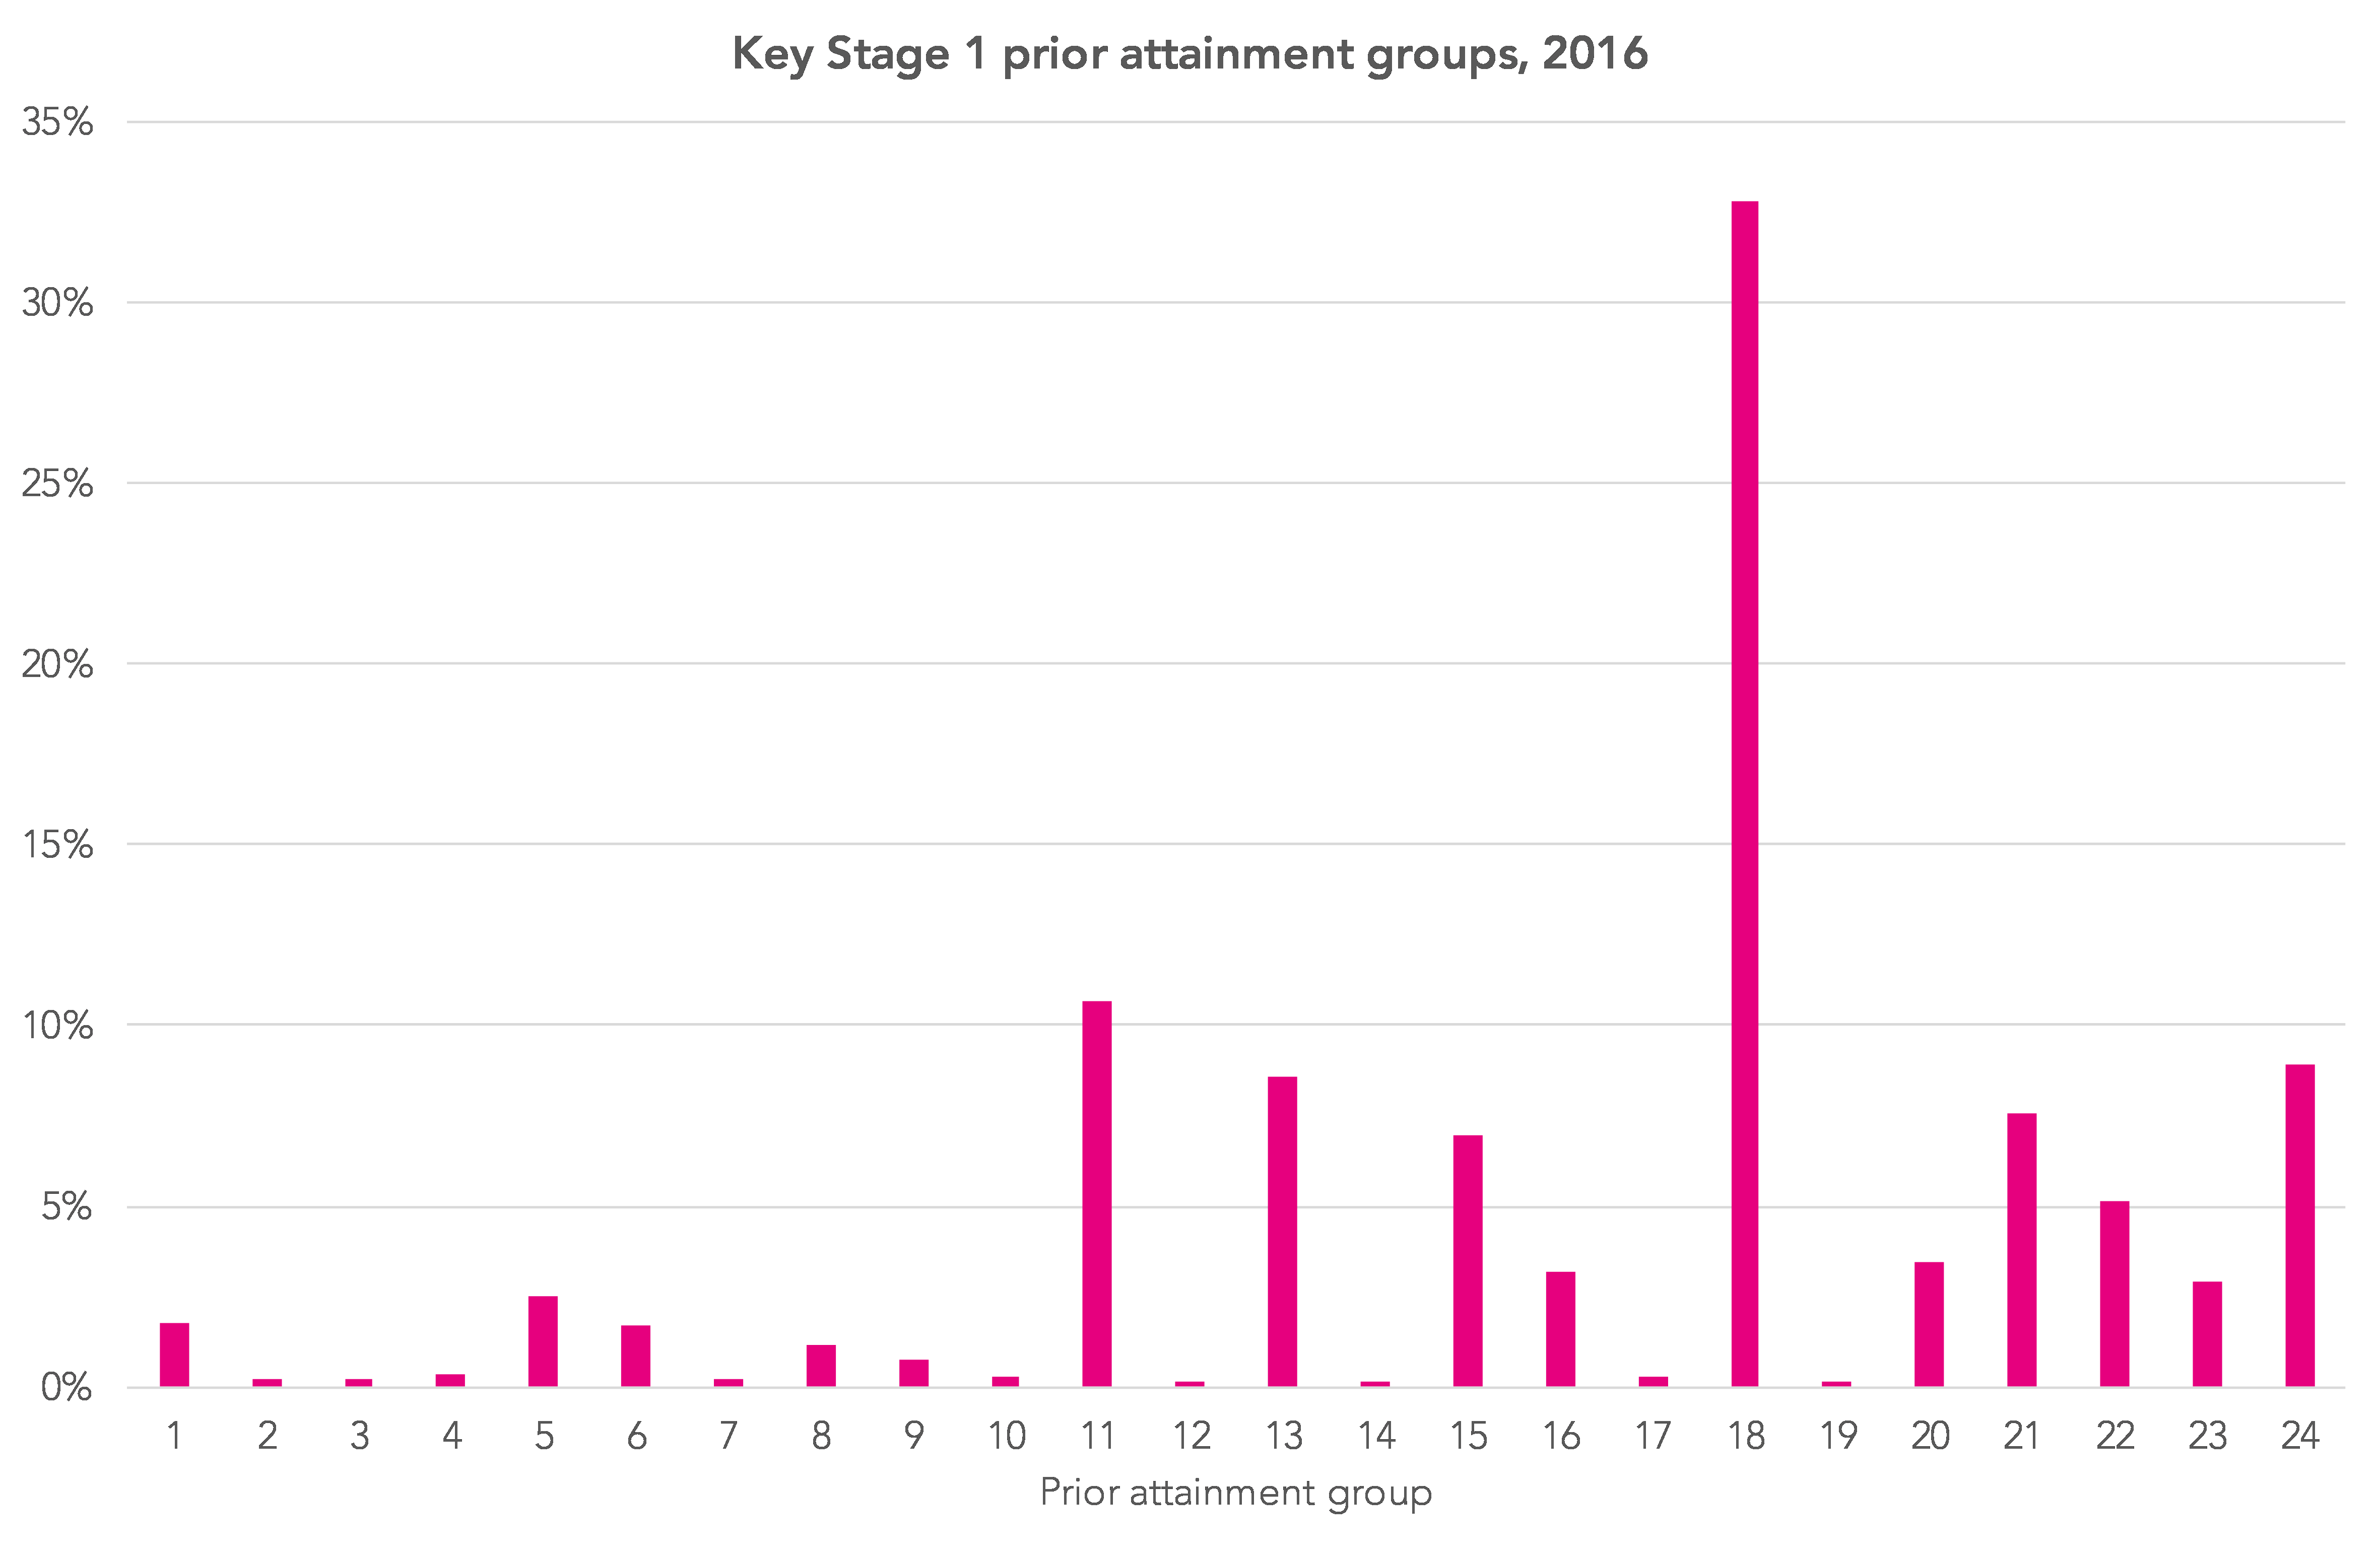
Just seven of the 24 bands contain 5% or more of all pupils. These reflect the most common combinations of teacher assessments. This method, like all others, can do nothing about the third of pupils assessed as EXS in all three subjects. These pupils would all have the same Key Stage 2 estimates against which their actual scores will be compared.
Despite these limitations, in 2020 we’ll calculate standardised scores for our own value added calculations in FFT Aspire (although we don’t use groups).
Option 3: Don’t bother
I imagine value added measures of some form will still be published in 2020 but would the world end if they were not?
As we wrote in this blogpost, there are numerous issues with the current measures. Given the new KS1 teacher assessments, these may well get worse.
So why do we do it?
Well, we know that school intakes vary, so simple comparisons of attainment outcomes are unfair, particularly to those schools in challenging areas.
Value added recognizes that pupils with higher levels of KS1 attainment tend to achieve higher results at KS2 and so adjusts school attainment measures to reflect this.
There are different adjustments we could make, however. For example taking account of the demographic and economic characteristics of pupils and schools, such as age, gender, disadvantage and so forth. But KS2 outcomes are less well correlated with these factors, even when used in combination.
We’re probably stuck with it
So maybe we’re stuck with KS1-KS2 value added for all its flaws.
Two things might improve it.
Firstly, we need to continue efforts to stop value added measures being interpreted as measures of school effectiveness.
Secondly, should we stop referring to value added as a measure of progress? There were good reasons for doing so, to help non-specialists understand what value added was trying to achieve in everyday language. But perhaps it had the unfortunate side-effect of creating an environment in which it was believed that the progress of individual pupils really could be measured.
Want to stay up-to-date with the latest research from FFT Education Datalab? Sign up to Datalab’s mailing list to get notifications about new blogposts, or to receive the team’s half-termly newsletter.


Any clues as to when the DfE will tell schools their plans about how Progress/VA will be calculated?
How are HAP, MAP and LAP groups currently calculated for Y5 and below (or Y7)? Does that give us a clue?
There’s currently no definition of High, Middle and Lower attaining groups from the DfE. FFT split the year group into thirds on Aspire, though.
I have been perplexed over the last three years about why he DfE haven’t required schools to submit the KS1 scaled scores to them. Surely these would have provided a starting point for calculating prior attainment if they wished to do so.
Our grandson got a predicted results Ks2.
What has confused me, and I can not find any info is, wording EXP, subjects, and HS in other, for the life of me, I have no idea what this means.
Can anybody confirm to me what the meaning of these letters are.
Thanks
Hello. I’m guessing a bit, but “EXP” generally means “expected standard” and “HS” generally means “higher standard”.