Managed moves are often used as an alternative to permanent exclusion.
They are voluntary arrangements entered into between two schools, with the agreement of parents and pupils. Pupils at risk of exclusion join a new school, including pupil referral units and alternative provision academies or free schools, for a trial period and, if successful, are formally admitted to the new school. Many local authorities have a formal process or protocol for schools to follow.
No-one really knows how many managed moves there are, nor how many are attempted but are unsuccessful.
Using National Pupil Database data, I identify just over 5,000 pupils (primary and secondary) who appear to have had successful managed moves in the 2015/16 school year – that is, ones where the pupil stayed at the school they moved to. In almost 2,300 cases, these were managed moves into alternative provision.
These are conservative estimates, for a number of reasons. An explanation of why, plus a description of caveats that apply can be found here. When it looked at the issue, extrapolating the number of observed managed moves to factor in some unobserved managed moves, the Education Policy Institute estimated that there were almost 9,000 in the 2016/17 school year.
Of the 5,000 managed moves I identify, 1,310 were in Year 9 and 1,260 in Year 10. We can then look at how the Key Stage 4 outcomes of these pupils in 2017 and 2018 compare to those of Year 9 and 10 pupils who were permanently excluded in the 2015/16. Department for Education statistics show that there 3,100 permanent exclusions of Year 9 and Year 10 pupils in 2015/16.[1]
Comparing exclusions and managed moves
Firstly, let’s look at the characteristics of pupils in our two groups, compared them to those of Year 9 and 10 pupils in general – see the chart below.

We can see that both the groups are more likely than other Year 9 and 10 pupils to:
- be disadvantaged
- be black Caribbean (including mixed white/black Caribbean)
- have been classified as having special educational needs at some point in their school history
- have had at least one fixed term exclusion in the last three years
- have been persistently absent in the previous year
- have low levels of Key Stage 2 attainment
- attend schools rated less than good, as at 1 September 2015
However, there are also differences between pupils in the managed move group and the permanent exclusion group. There are proportionately more girls in the managed move group, but proportionately fewer pupils on a number of indicators (disadvantage, persistent absence, previous SEN, previous fixed term exclusions and low prior attainment).
These differences may go some way to explaining differences in the type of schools that pupils go to next following a managed move or permanent exclusion, as shown in the chart below.
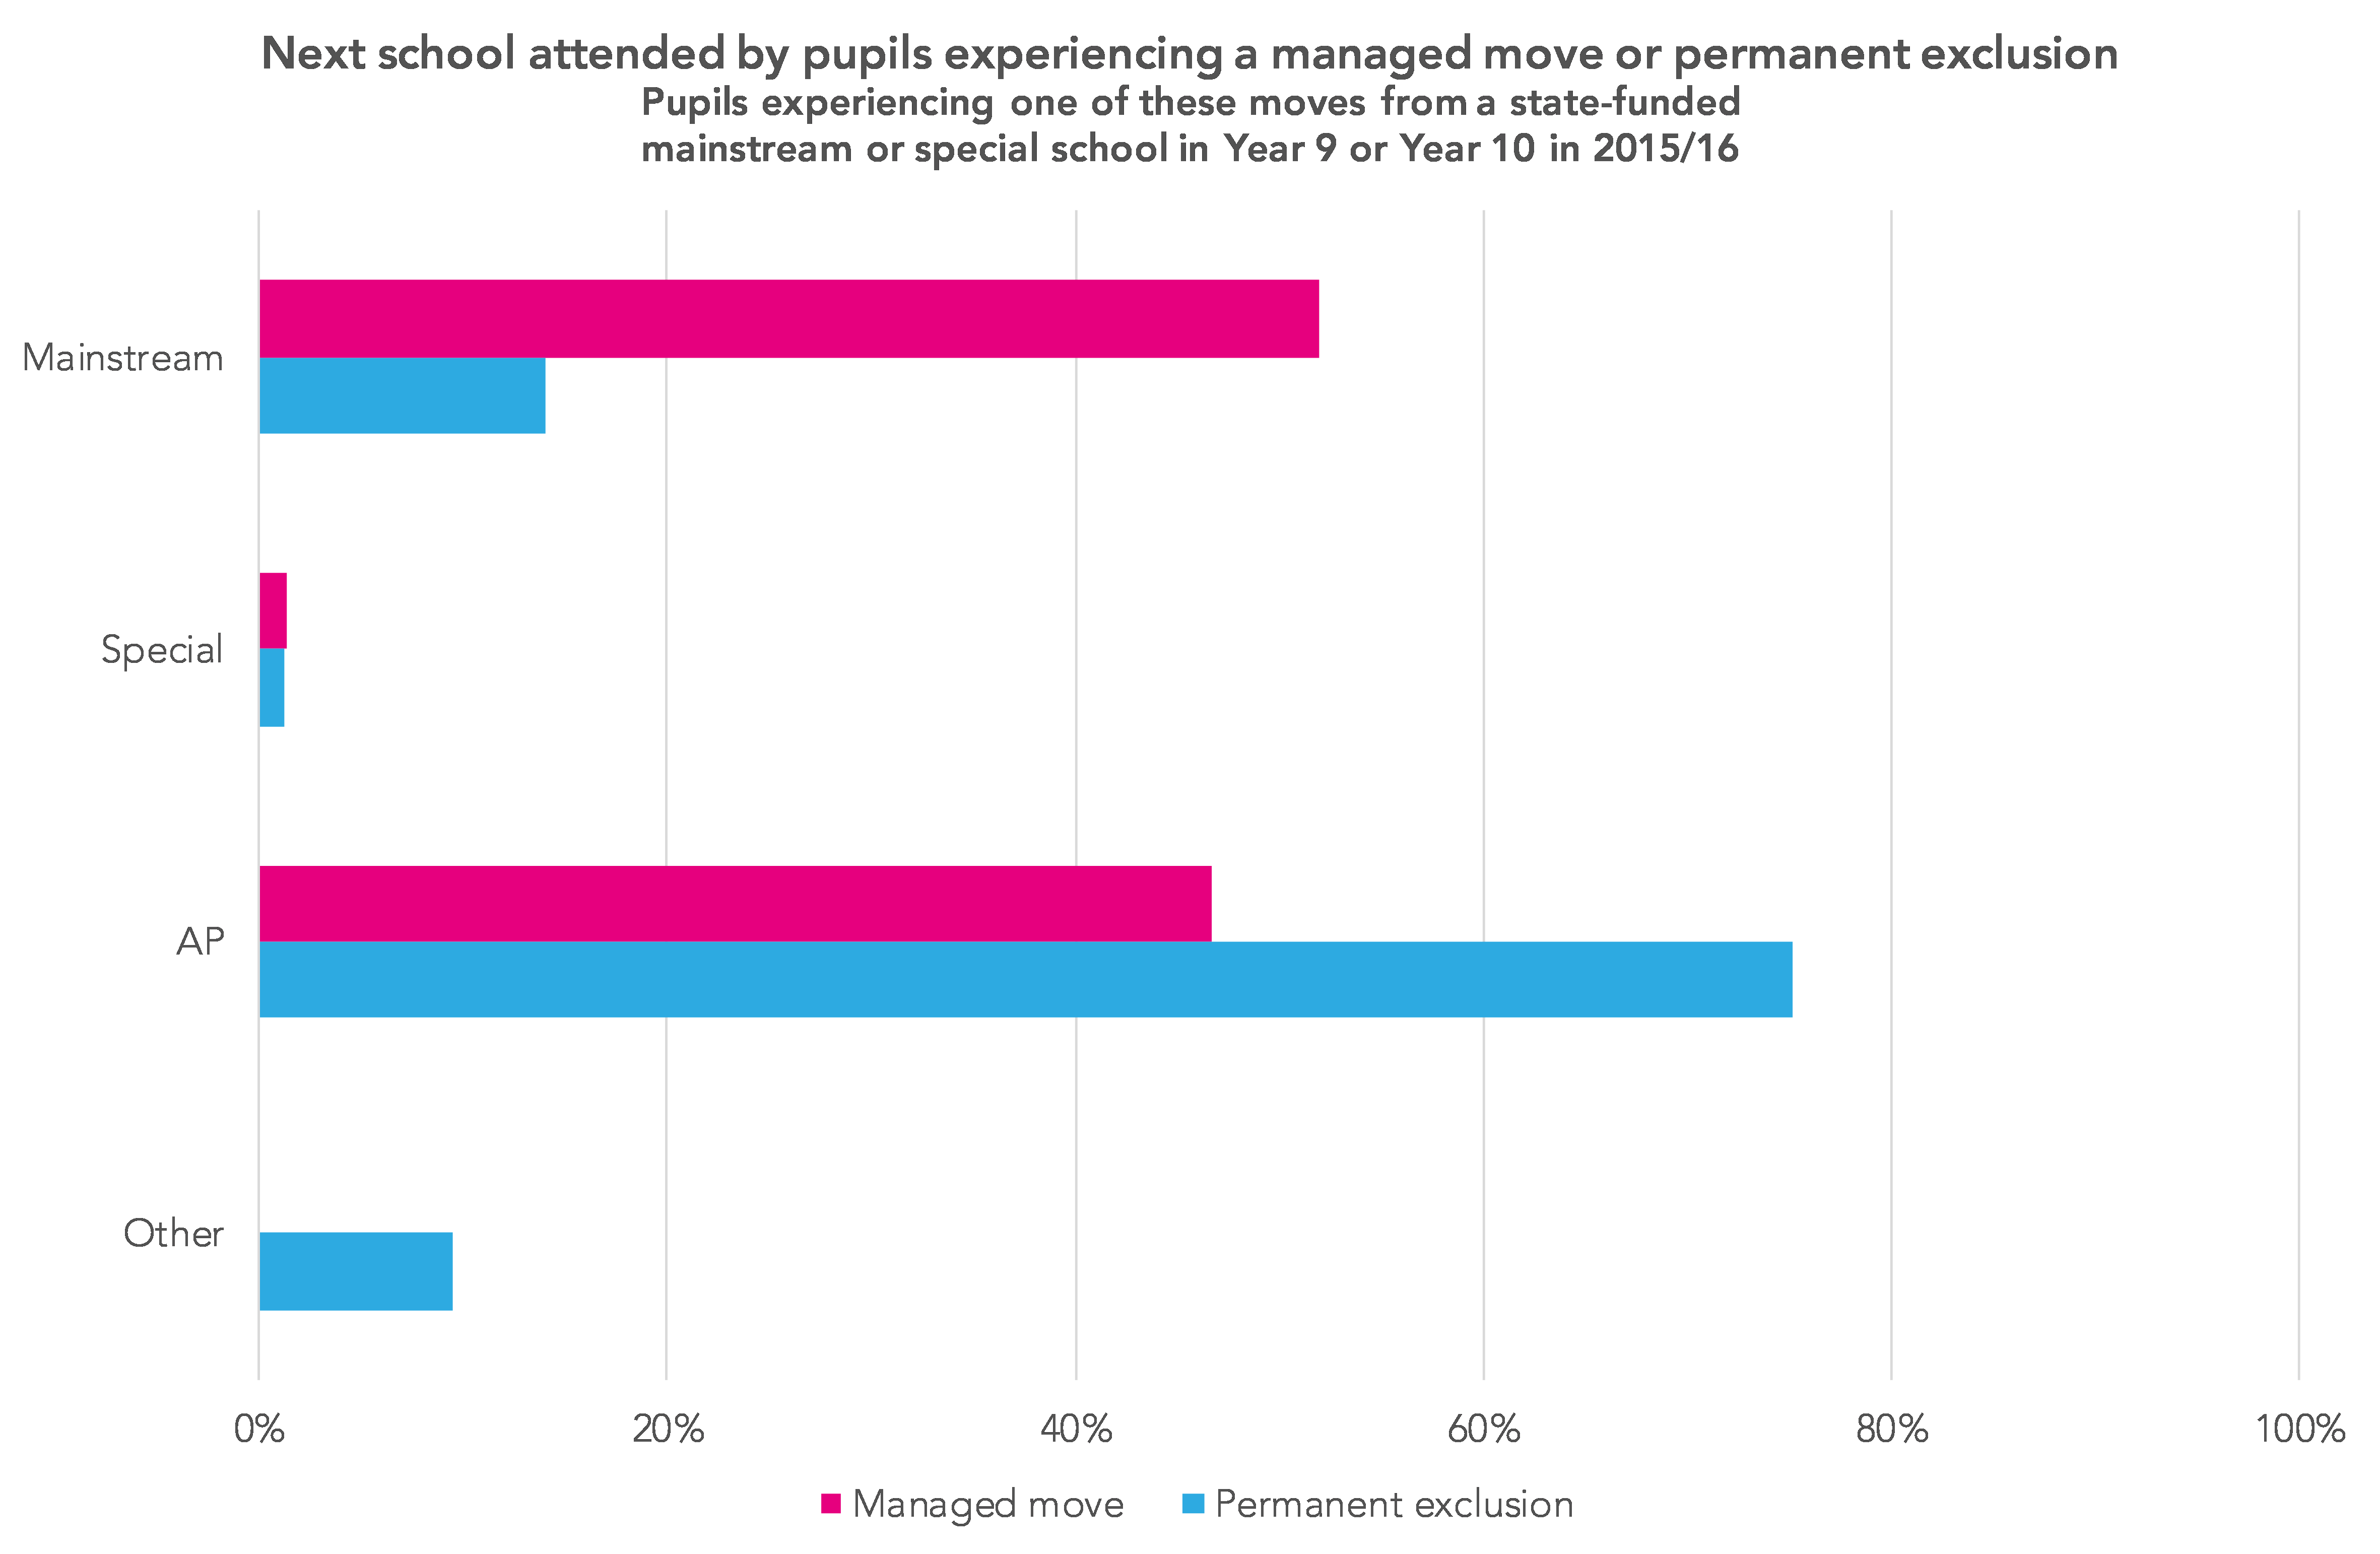
Managed move pupils were more likely to move to a mainstream school and those who were permanently excluded more likely to go into alternative provision.
Of course, it is likely that some pupils will have been permanently excluded for very serious incidents and so a placement in another mainstream school may well have been inappropriate.
Around 9% of the permanently excluded pupils do not rejoin a mainstream school, special school or AP setting – the ‘other’ group shown on the chart. Two-thirds of them subsequently appear in end of Key Stage 4 data – meaning they sat at least one qualification. In most cases they appear attached to non-school settings (which will include things like unregistered alternative provision, or the local authority paying for them to attend a further education college) or an independent establishment, including independent AP.
KS4 outcomes
Overall, end of Key Stage 4 outcomes for those who experienced either a managed move or a permanent exclusion were relatively poor. A total of 17% of managed move pupils and 6% of permanently excluded pupils achieved a grade 9-4 in both GCSE English and maths. This compares to a national average of 64% for state-funded schools.
Pupils who were initially placed in mainstream schools tended to have higher levels of attainment – see the chart below – though it is likely that they had less complex needs.

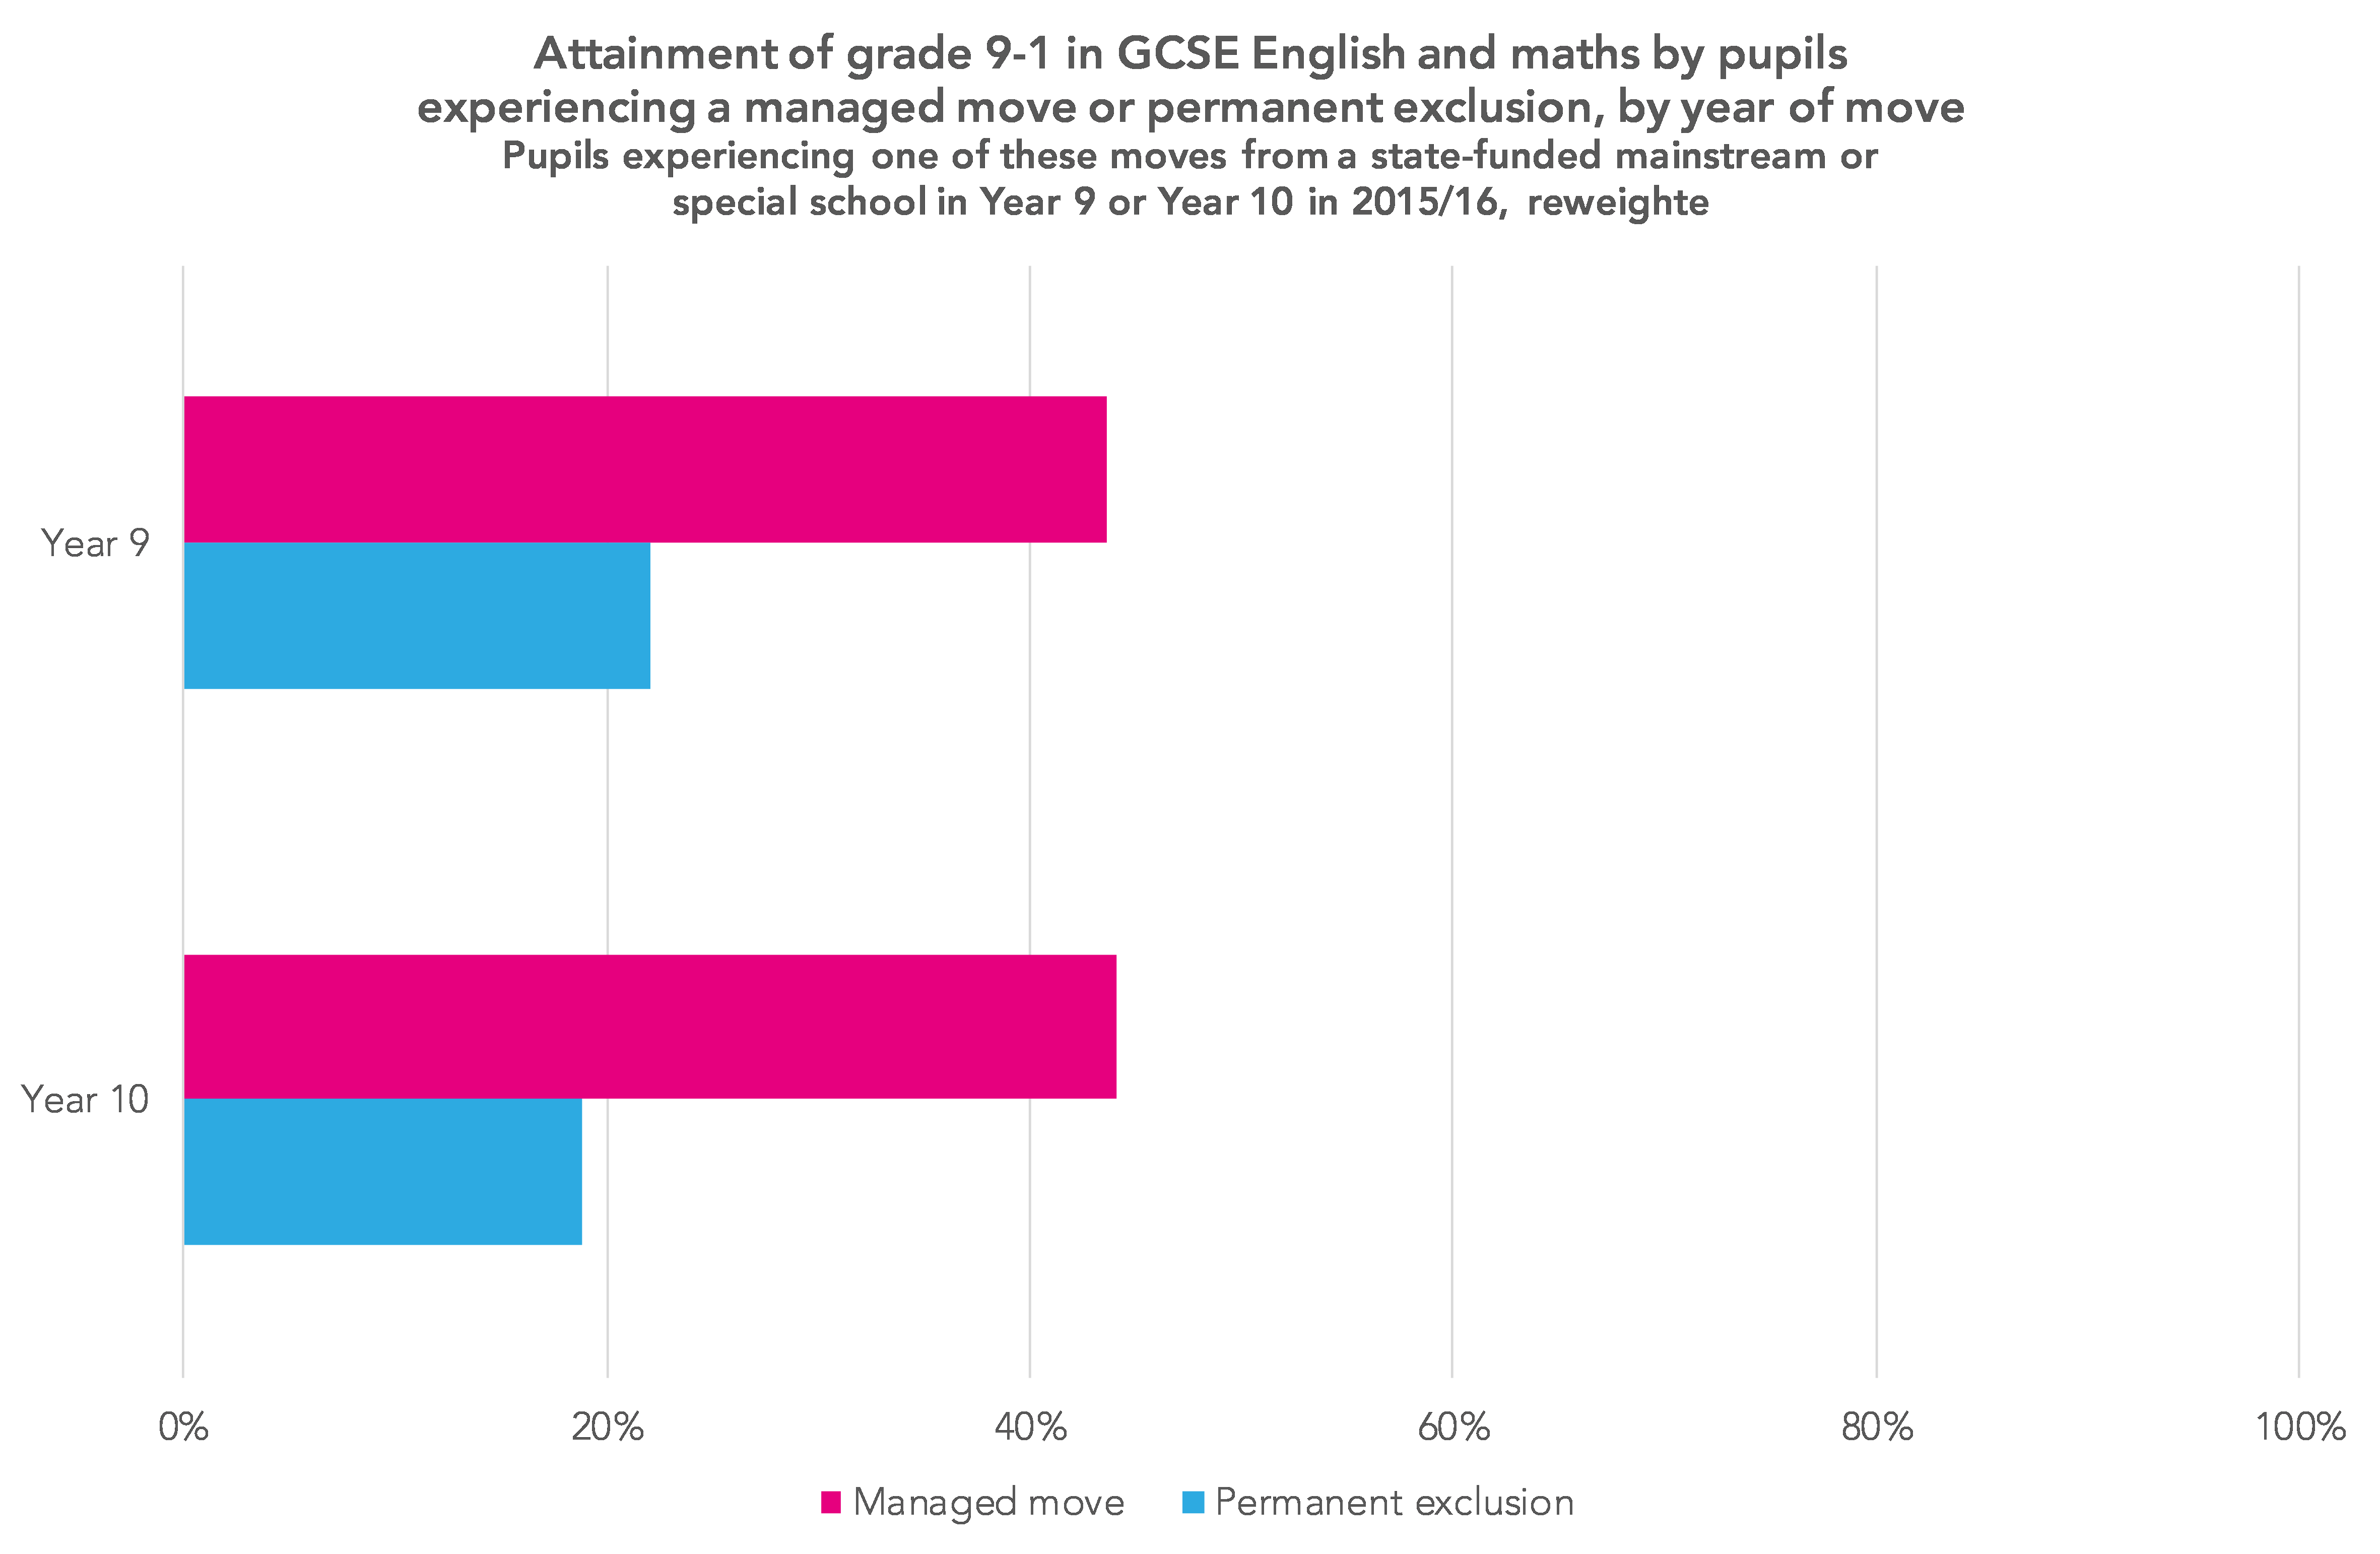
To make for a better comparison between the two groups, we can also reweight them so that they balance in terms of the characteristics shown in the first chart plus one or two others[2], then recalculate the percentage of pupils who achieved a grade 9-1 in both English and maths.
Overall, it looks like Key Stage 4 outcomes for pupils who go through a managed move are poor but might tend to be slightly better than for pupils who are permanently excluded – see the chart below, which splits out two cohorts looked at.
There are a lot of caveats here. Firstly, I may have misidentified managed moves. And secondly, we’d really want to only include permanently excluded pupils for whom a managed move may have been an appropriate alternative. For instance, not including pupils who were excluded for physical assault. Unfortunately I do not have exclusion reason in the data I have available so this is as far as I can take things at present.
Want to stay up-to-date with the latest research from FFT Education Datalab? Sign up to Datalab’s mailing list to get notifications about new blogposts, or to receive the team’s half-termly newsletter.
1. A total of 260 pupils were in both the permanent exclusion and managed moves groups. These pupils are included in the former group in the analysis.
I remove around 30 cases of permanent exclusion related to pupils who had previously been permanently excluded and/or had been permanently excluded from a pupil referral unit or AP academy/free school.
2. The variables used are month of birth, gender, percentage of school career in receipt of FSM, percentage of school career on SEN register, first language, ethnic background, percentage of sessions missed due to absence in 2014, number of days missed due to fixed-term exclusion in the previous three years, school Ofsted rating, region, KS2 fine grade (reading and maths), IDACI score of home neighbourhood, year first enrolled at a state-funded school in England, previous PRU/AP enrolment.


Hello, very interesting research. Some comparison with outcomes for pupils with a similar characteristics profile as the managed move cohort but who remained in the same school would be beneficial to see if there is an impact on outcomes of the move itself. Comparing with outcomes for all pupils is not comparing like for like. Thanks Chris
Agree with Chris. The obvious take from this is “pupils who undergo managed moves or are permanently excluded suffer educationally as a result”, when an equally plausible line is “pupils whose education is falling by the wayside are more likely to have concurrent issues that lead to them being excluded or managed out”. But I don’t know how we would go about demonstrating the counter-factual, looking at children who were in the same situation but stayed in the school rather than moving/being excluded … tricky!
Thanks Stephen (and Chris). With this post I was trying to show how the outcomes of pupils who went through a managed move compared to those who were permanently excluded. I wasn’t necessarily thinking about what might have happened to those pupils had they not been managed moved/ permanently excluded. Which would be very tricky, as you say.
This is an important debate, we could imagine a scenario where PEX reduces significantly and managed moves increase but will that necessarily improve outcomes? (including post-16 outcomes). Out of interest how are you identifying children with managed moves from data? Are you assuming that any child who has changed school represents a managed move? (some may be more managed than others – parents may have simply applied for new school place through in year process). Or are you only including ones where there has been a period of dual registration?
Hello Neil. Thanks for commenting. Managed moves are identified in cases where there has been a period of dual registration. There’s more detail about this in a linked document in the blogpost itself. In the fifth para started “These are conservative estimates” there’s a hyperlink on the word “here” in the second line. This sets out the methodology.