Performance measures for multi-academy trusts have been published this morning, alongside school-level results.
Most of the coverage of the MAT league tables takes the form: ‘Which are the best trusts/which are the worst trusts?’.
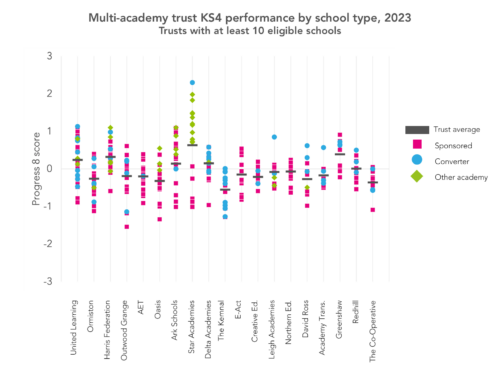
Such analysis is based on trusts’ average Progress 8 scores[1] and there are differences in the scores that trusts achieve. The chart below shows what these average P8 scores look like for the largest MATs – those with 10 or more schools within the scope of these MAT league tables.

We can add in further detail by including individual schools’ results, and showing the different types of academy that make up each trust – see the next chart.
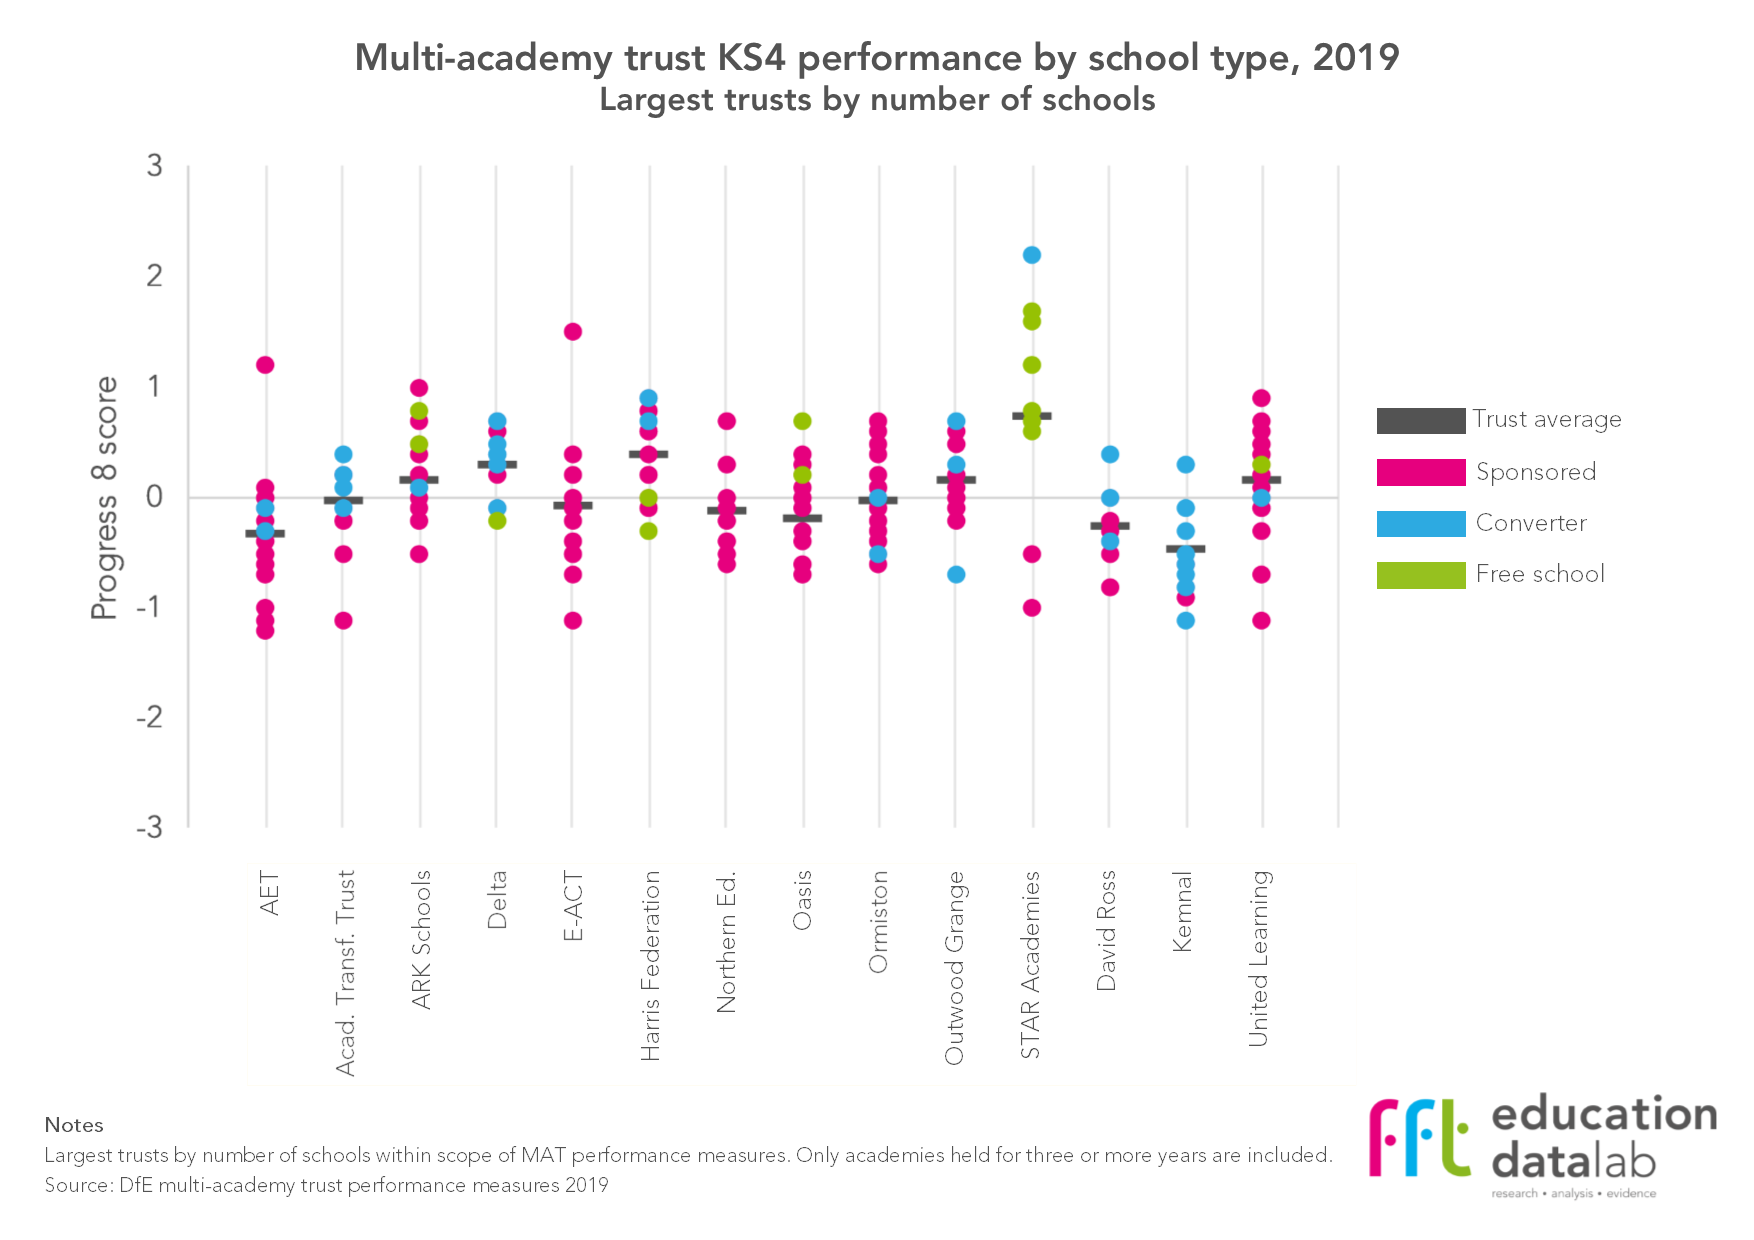
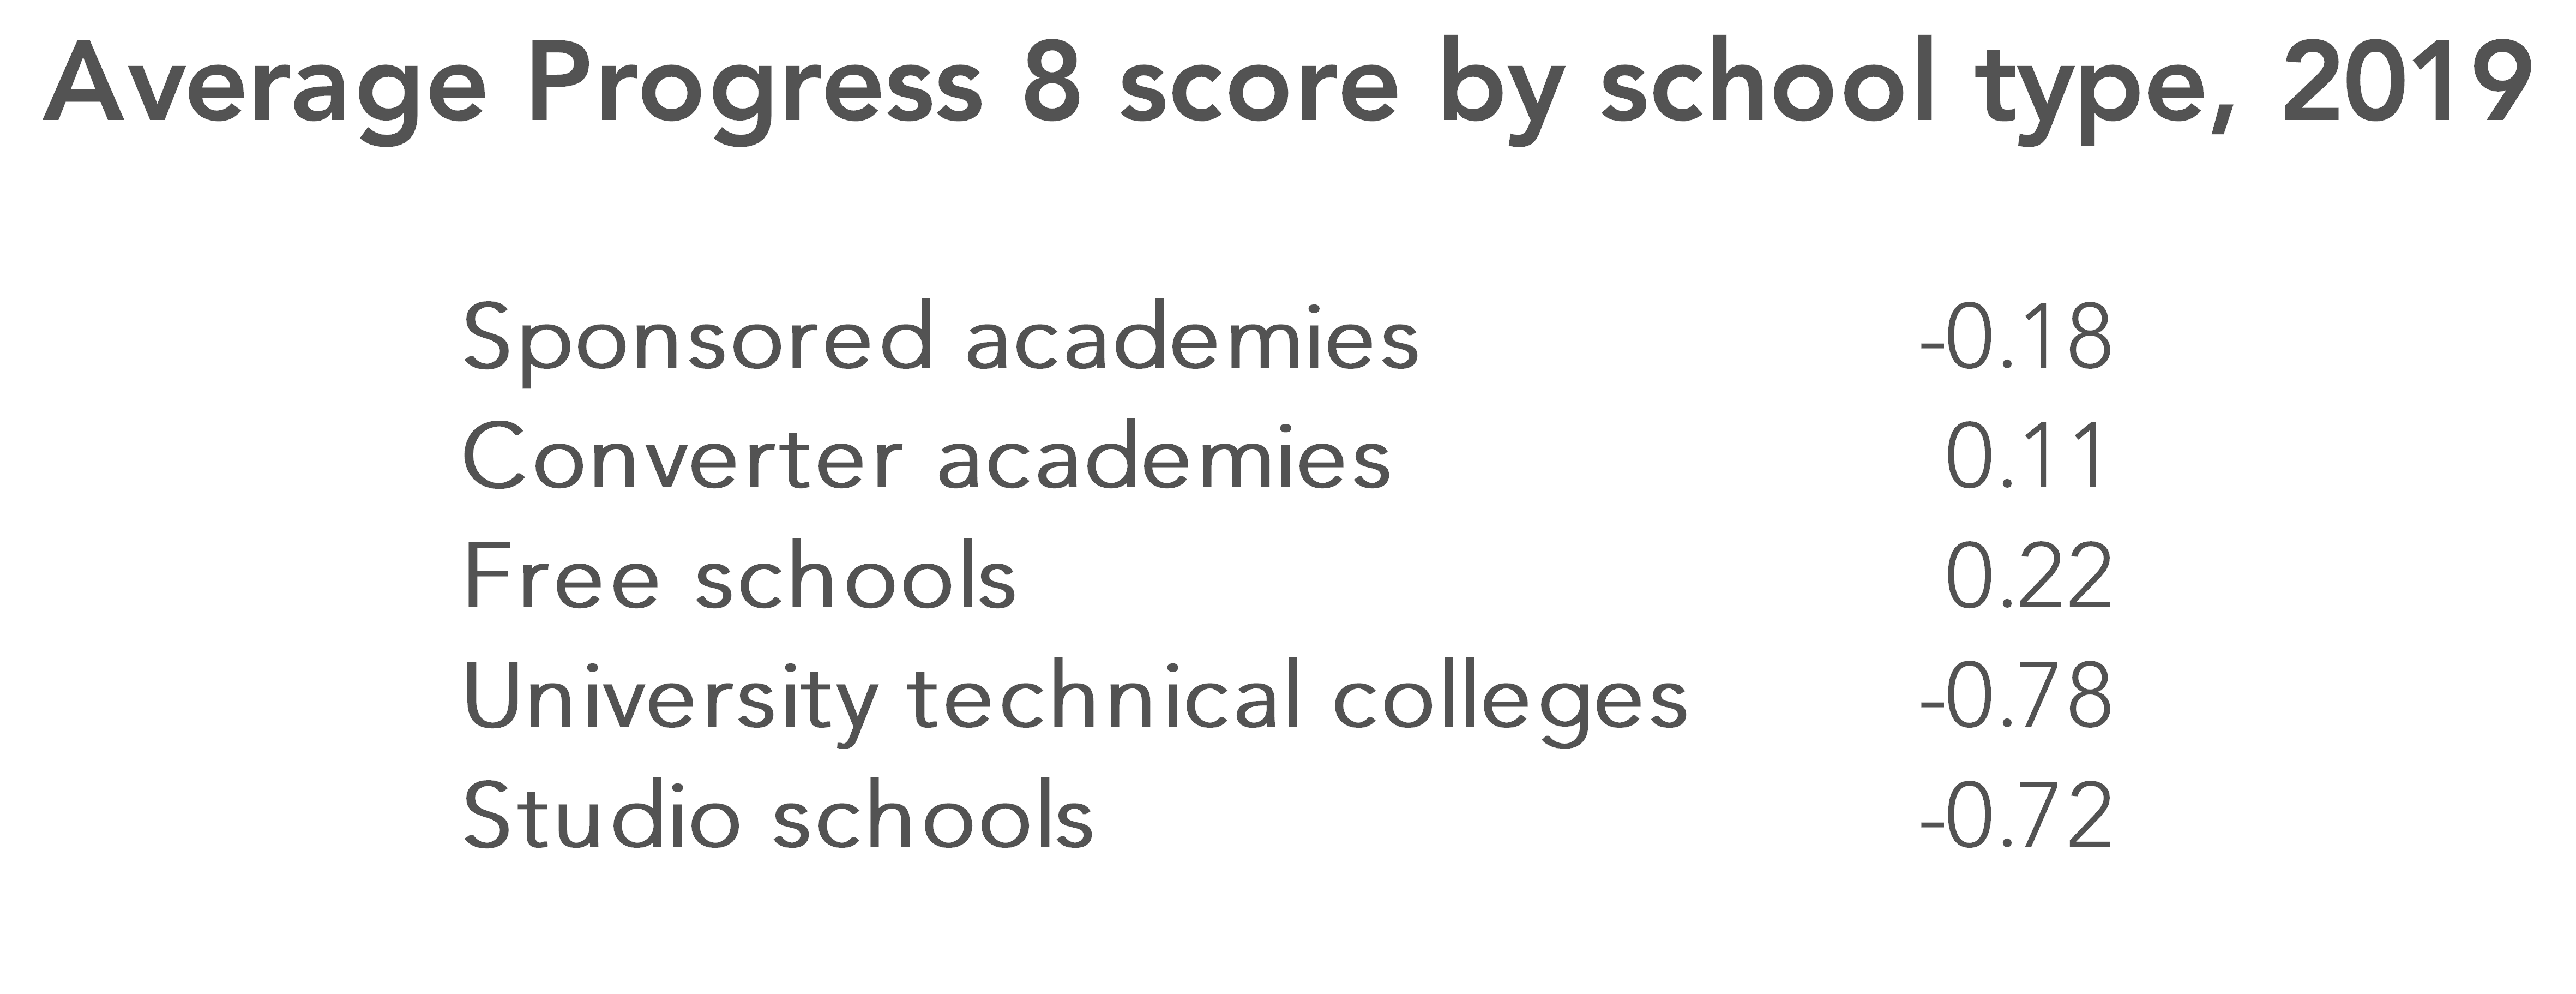
But, as this chart shows, we’re comparing trusts that are quite different to one another in their composition. And statistics published this morning by the Department for Education show that average P8 scores vary markedly by type of academy – see the table below.
So we’re forming judgments based on comparisons of organisations that aren’t necessarily very comparable. (We’ve also previously noted that published performance measures broadly speaking only include pupils who remain on the roll of a school by January of Year 11 – something that can’t be taken as a given.)
Adjusting for context
To demonstrate that there are different ways of looking at things, the chart below adjusts the MAT P8 scores published this morning by school type, comparing them to the unadjusted scores.
A university technical college with a P8 school of -0.84 is adjusted up by +0.78, for example, to become a P8 score of -0.06. (By +0.78, as the national average P8 score for UTCs is -0.78). This is done for every school within a trust – so trusts with more sponsored academies, UTCs and studio schools, where average P8 scores are negative, will see their scores adjusted up.
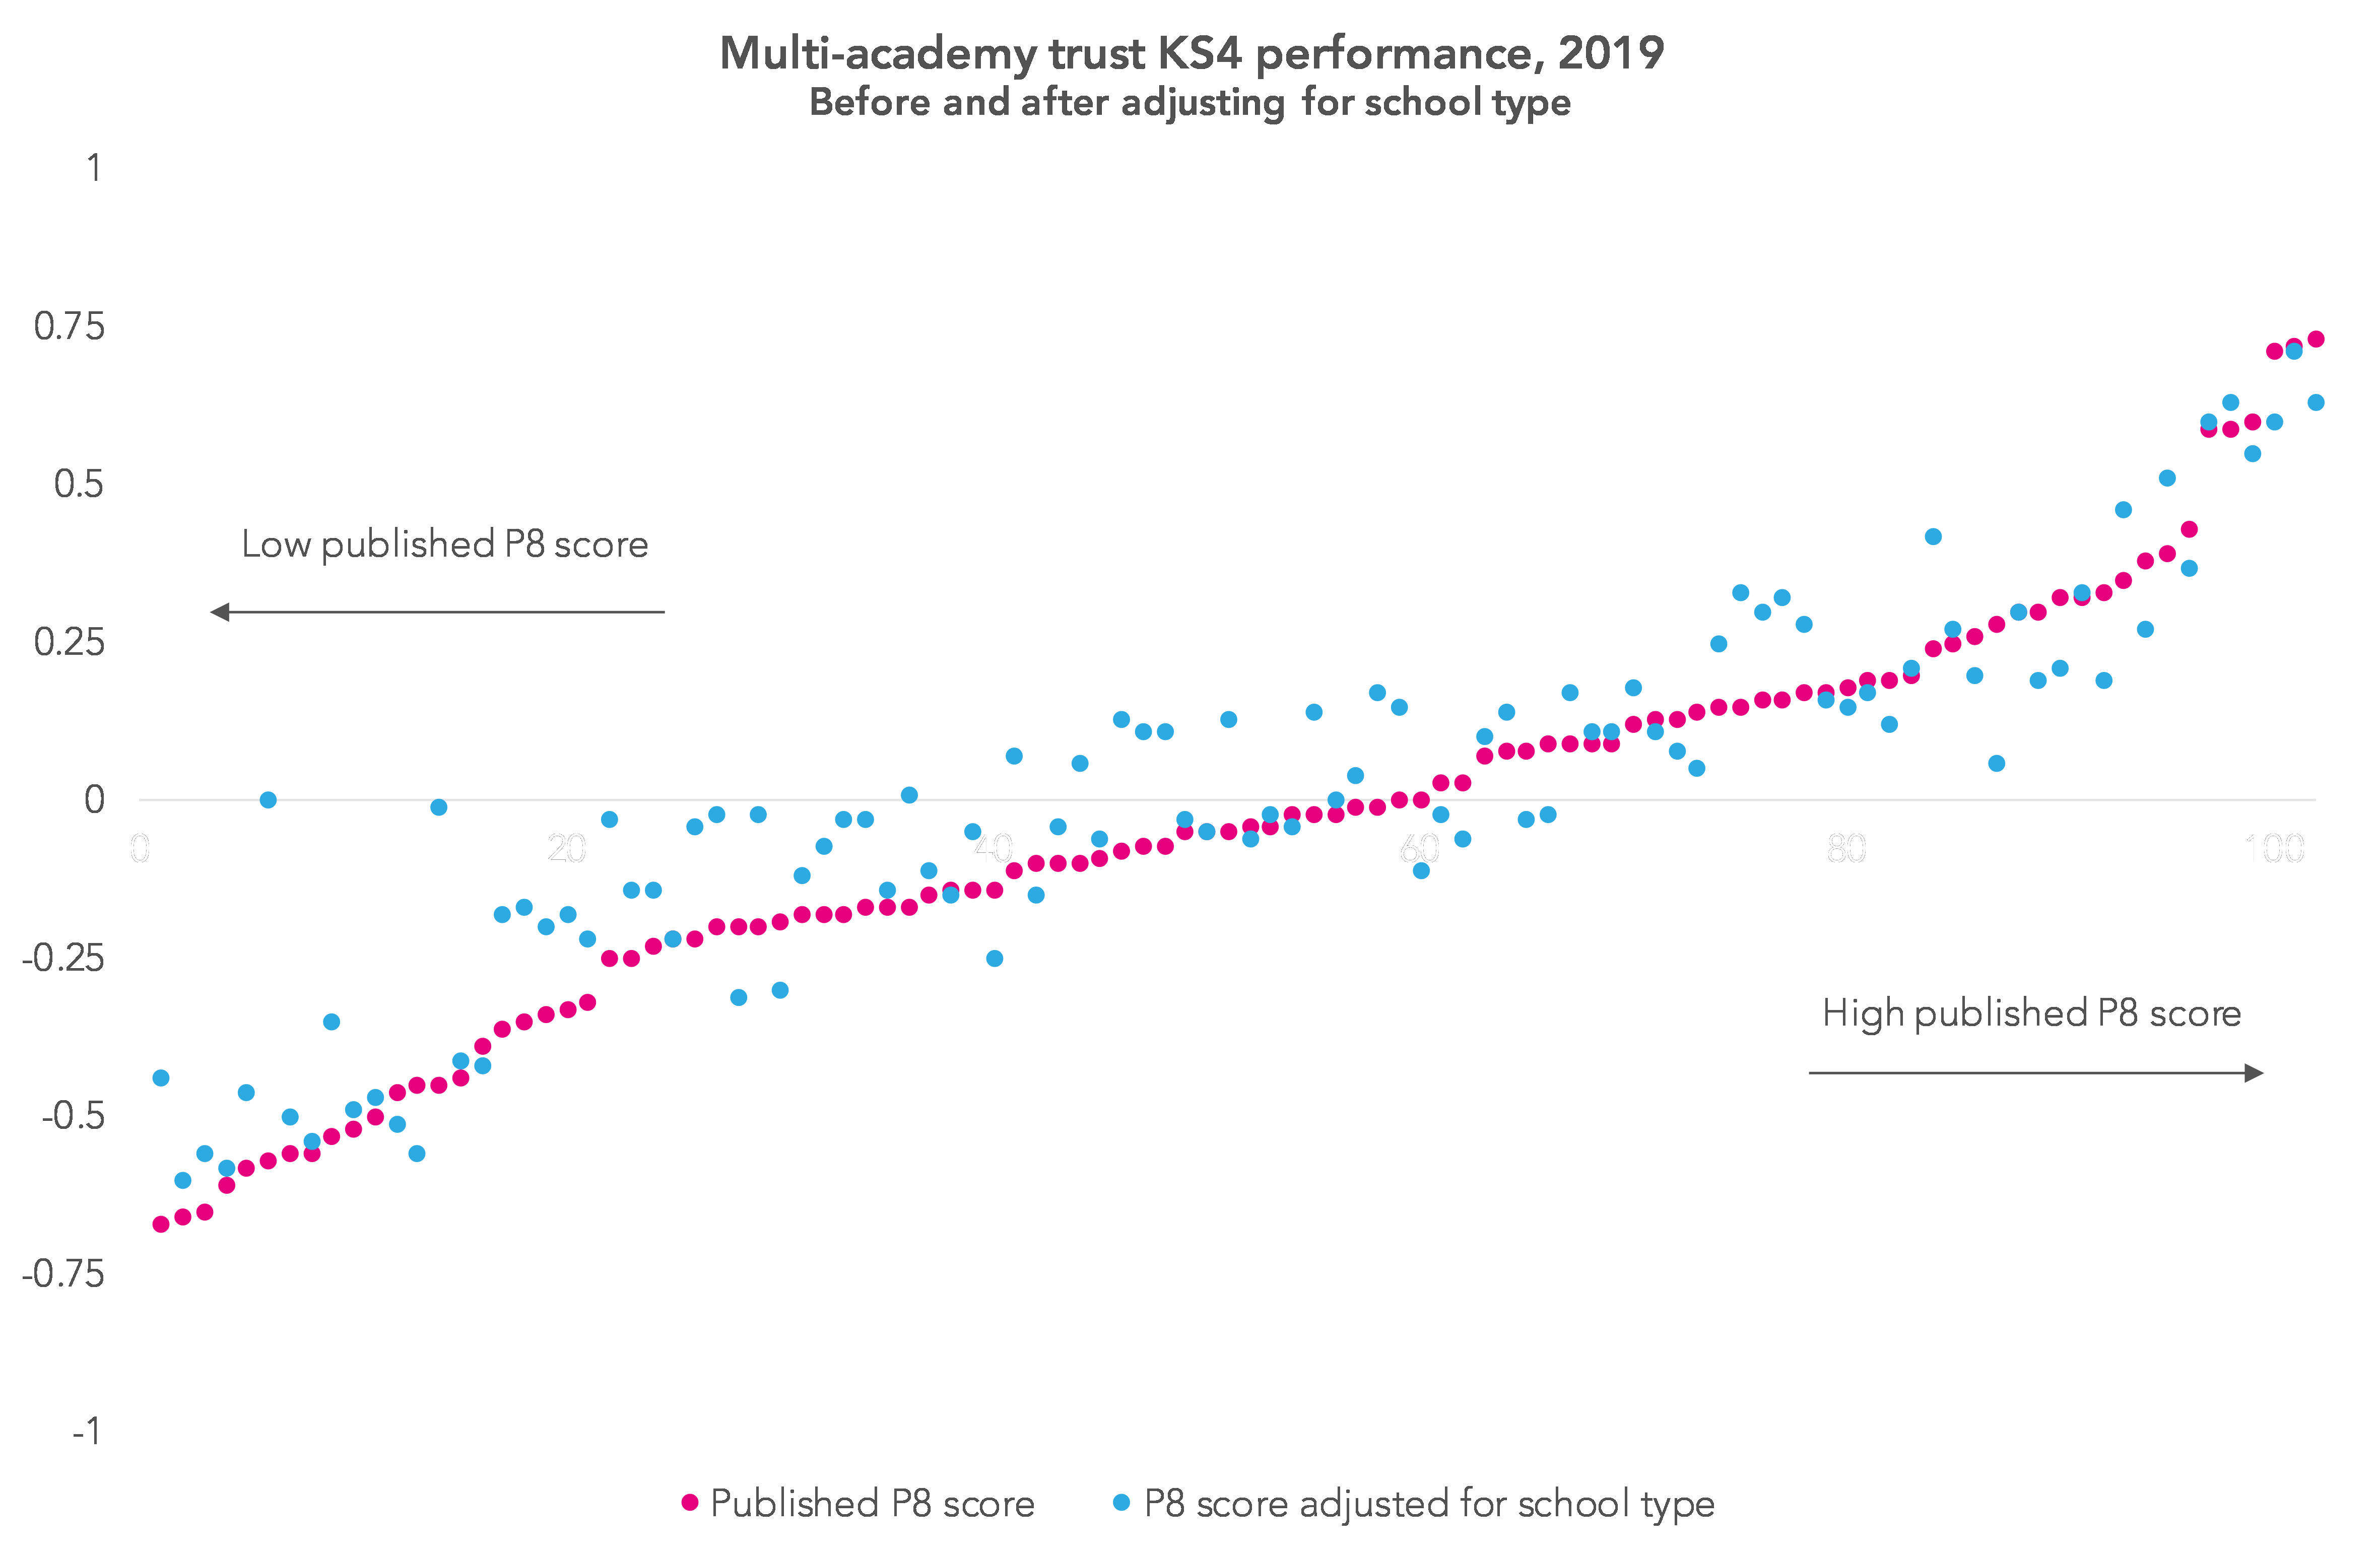
For some trusts this changes their apparent performance by a large amount. Particularly noticeable on the left of the chart, for example, Activate Learning Education Trust and Northern Schools Trust see low P8 scores transformed into scores pretty much at the national average.
Another way to shine a light on the comparability of the MAT results is to adjust the P8 scores by factors that we know have a bearing on the results that a school achieves – such as the average prior attainment of the cohort at the end of Key Stage 4, the disadvantage rate and the English as an additional language rate.
Adjusting P8 scores by these contextual factors, then aggregating them into trust-level figures following the DfE’s methodology, results in the chart below.
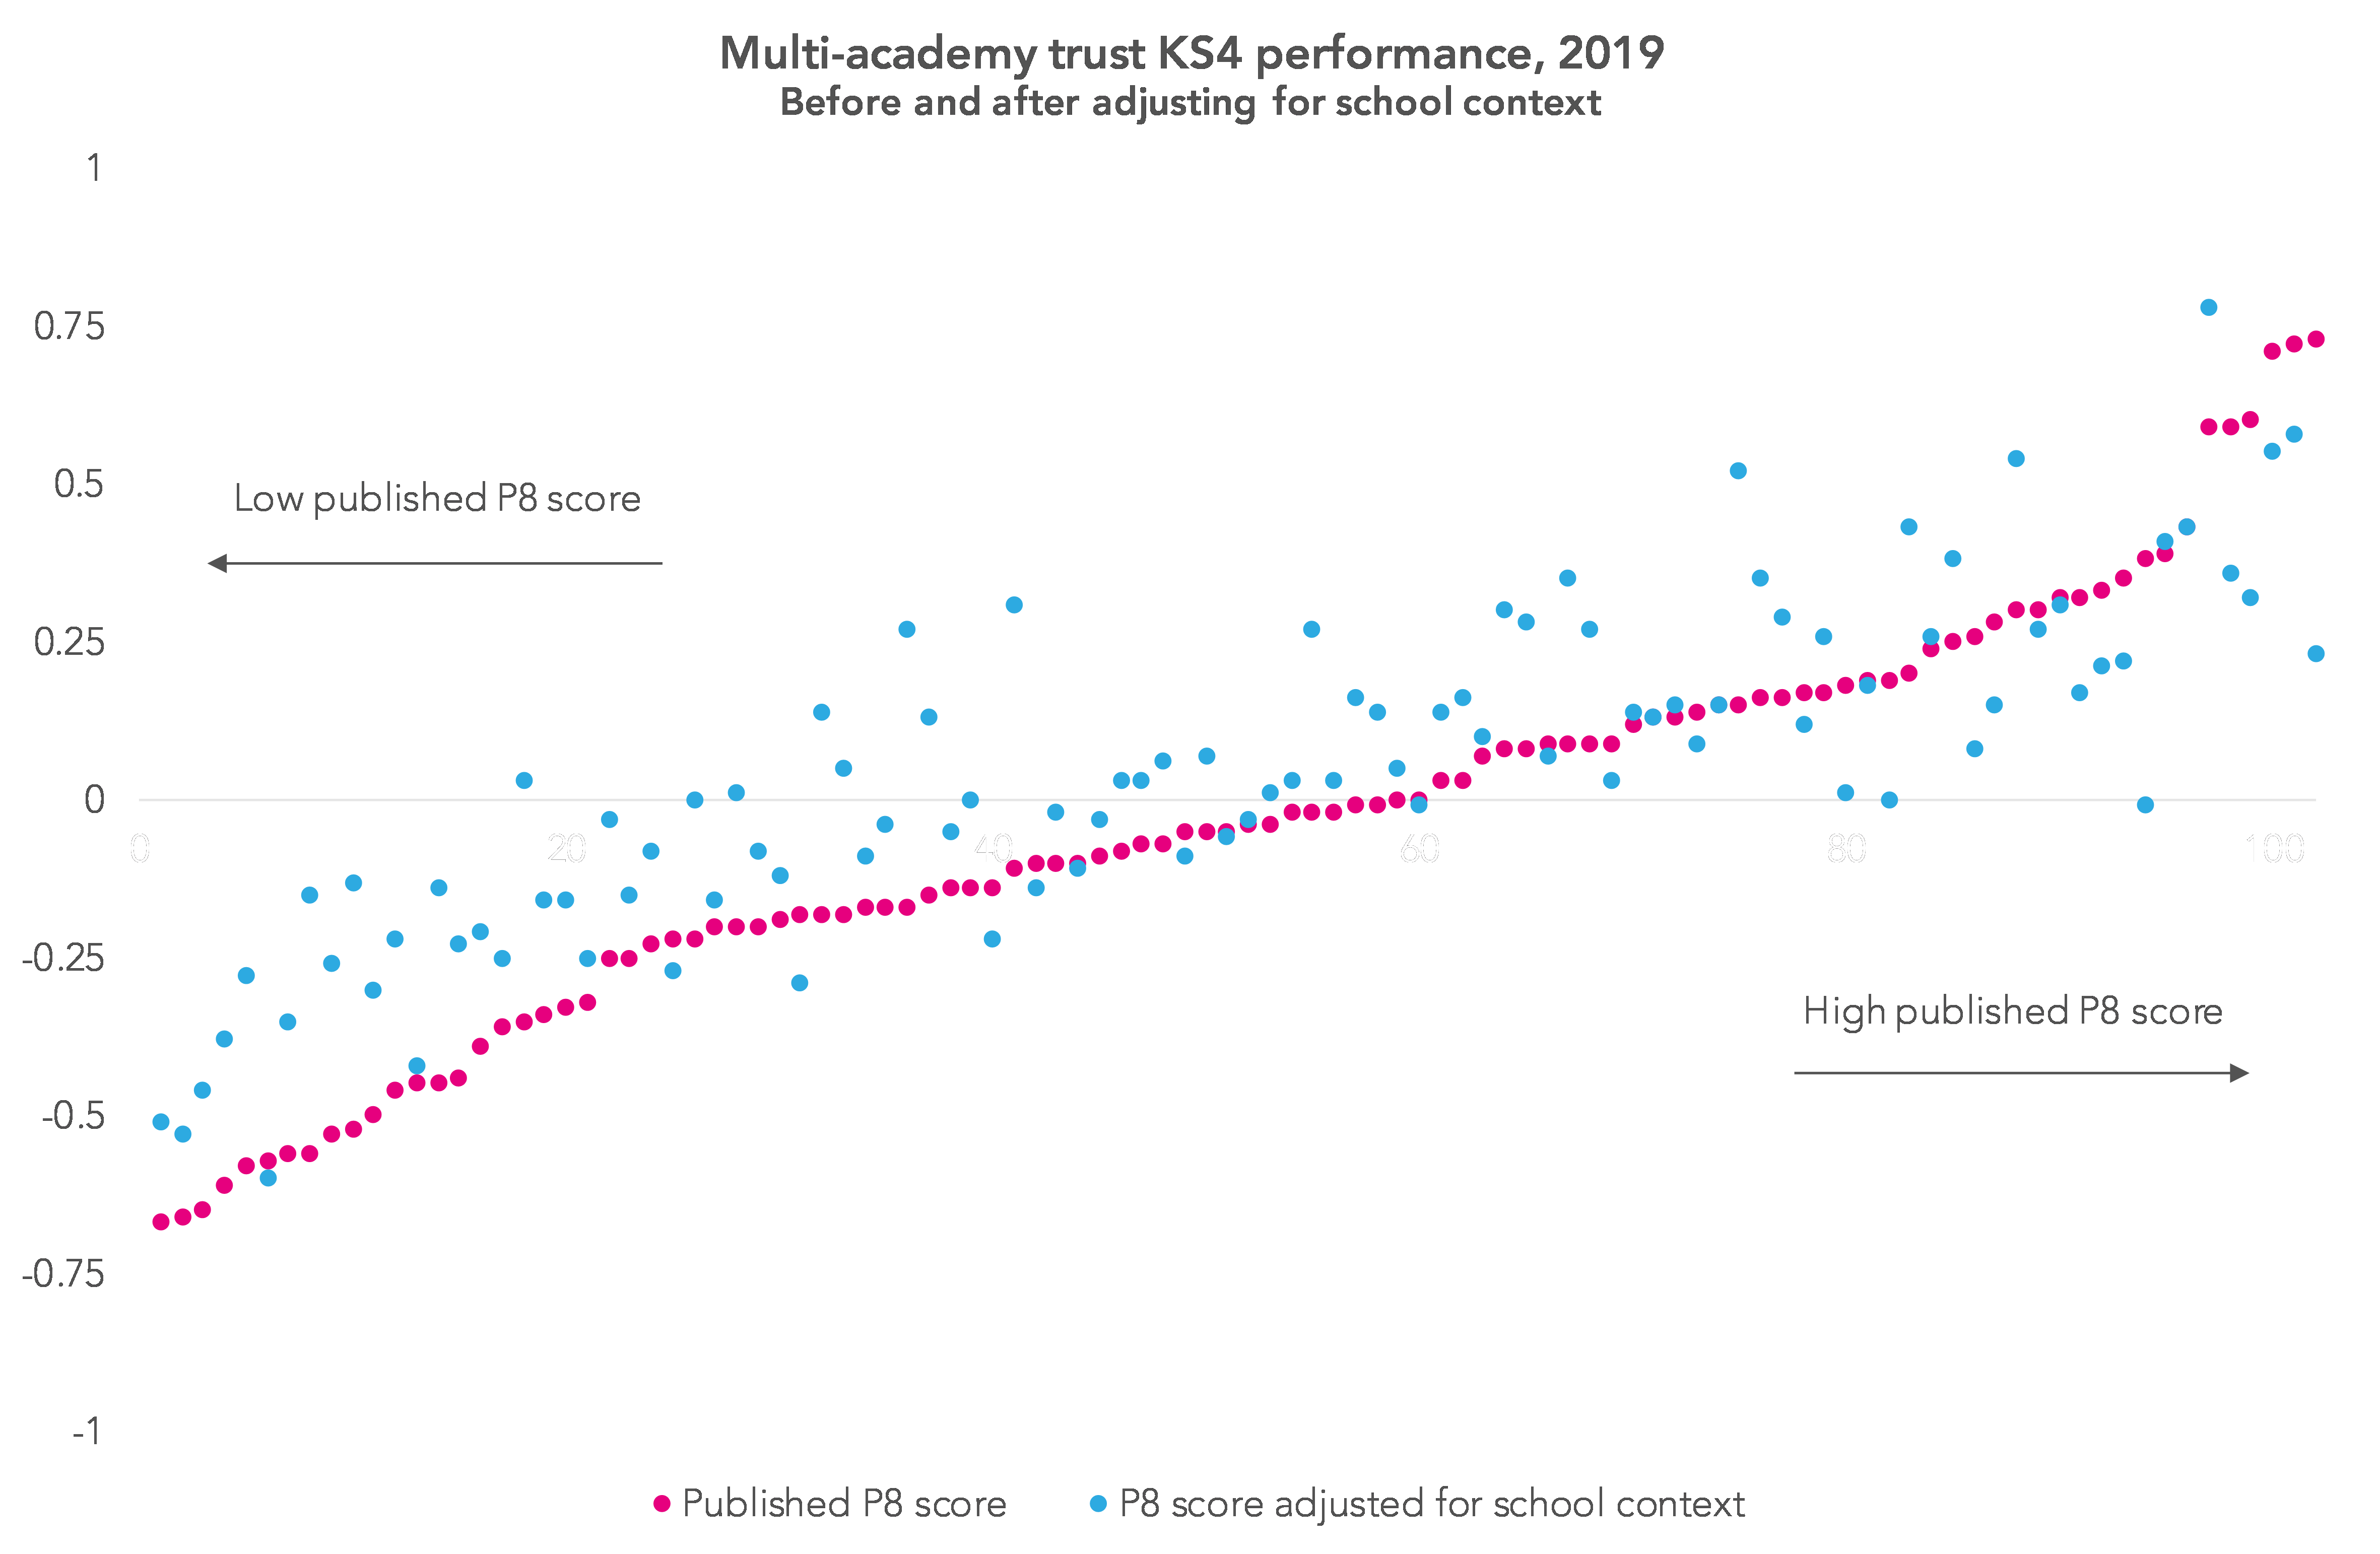
The P8 scores of individual trusts again change by some quite large amounts – and there are fewer extreme results at both ends of the scale.
Both of these adjustments to trusts’ P8 scores are fairly simple, and both have weaknesses. But this should demonstrate that we need to dig below the surface to understand the apparent performance of different MATs, whether that apparent performance be positive or negative.
We need better information
A couple of final thoughts.
There’s much more to a MAT than simply the number and type of school in it, and the context in which those schools are working.
Different trusts have grown by different amounts over time and they have also grown in different ways. Some have grown largely organically, such as STAR Academies, which has opened a large number of free schools, while others such as United Learning have grown in size recently through a number of trust mergers.
When we start to look at how trust appear to perform over time such changes will all have a bearing. Yet there is no easy way to get information on changes in MAT size and structure – the DfE’s Get Information About Schools site provides some data on academy trusts, but it is very much a limited picture.
We’ve been starting to pull together the data required to do this and we hope to blog on it soon.
Want to stay up-to-date with the latest research from FFT Education Datalab? Sign up to Datalab’s mailing list to get notifications about new blogposts, or to receive the team’s half-termly newsletter.
1. These are weighted averages based on the number of pupils in the schools in each trusts and the (capped) length of time the school has been with the trust. Only schools that have been part of a trust for three years or more are included in the performance measures. For a full description, see the methodology document published alongside the MAT data.
What does the data look like when you remove UTCs, Studio Schools and others with atypical transition years (upper schools)? DfE and Ofsted clearly state that P8 is unreliable for these schools. The method of accounting for these types of schools that you’ve used here is a little too arbitrary. What if you counted those students’ scores back into their KS3 school on a pro rata basis?