This summer, grades in GCSEs, A-Levels and other qualifications will be awarded based on moderated teacher judgments.
It seems that the intention is to ensure that the distribution of grades awarded in each subject is similar to last year.
At the moment, we have no idea what the national distribution of grades based on teacher judgments would look like. Maybe it would be very similar to the distribution produced by exams.
But if not, some degree of moderation will be necessary.
In this blogpost, I’m going to look at some of the statistical options that might be used in this process, and their advantages and disadvantages.
Awarding grades in 2020
According to the latest information from the Department for Education, Ofqual is developing an awarding process based on teacher judgments in collaboration with the awarding bodies. At its heart will be teachers’ judgments about “the grade that they believe [each] student would have received if exams had gone ahead”. Guidance will be issued on how to do this.
The information available from the DfE also says: “The exam boards will then combine this information with other relevant data, including prior attainment, and use this information to produce a calculated grade for each student, which will be a best assessment of the work they have put in.”
This suggests that there will be a moderation exercise of some form.
This moderation exercise is likely to employ a range of evidence. I’m going to look at two forms of statistical evidence. Firstly, comparison with last year. Secondly, statistical predictions.
Comparison with last year
Schools’ exam results are predictably unpredictable, especially for small cohorts.
Each year, Ofqual publishes “centre variability” charts, which summarise, for each subject, the school-level changes in attainment from one year to the next.
Charts like this could help in the moderation process this year to monitor differences in results compared to last year.
I’m going to use something similar here: going back to the 2018 GCSE data and comparing the percentage of pupils achieving grade 9-4 (or A*-C) to the previous year in each subject at each state-funded mainstream school.
The chart below shows the differences that result for all 3,000 schools and the 30 main GCSE subjects, splitting schools into four groups based on the number of entries they had in each subject in 2018.[1]
Two things are clear from the chart. Firstly, there are lots of schools with relatively few entrants in a given subject. Secondly, that results in these schools tend to be more volatile than in schools with larger numbers of entrants – shown by a broader spread of differences in 2017 and 2018 results.
Taking all subjects together, 57% of schools’ results differ by less than 10 percentage points when we compare them to the previous year’s.
But in subjects with 30 or fewer entries, this figure was just 43%. And in some subjects with more than 180 entrants, it was almost 90%. Put another way, you can predict a set of results for a school based on last year’s results reasonably well for subjects with a large number of entrants but not so well for smaller cohorts.
A school’s results may change even if there is no difference in teaching and learning. Firstly, especially in small cohorts, the prior attainment profile of pupils may be very different from one year to the next. Secondly, even if prior attainment is the same, measurement error can play a part.
Imagine we somehow managed to clone a class. If we give this year’s exam to the class and next year’s exam (of the same syllabus) to the clones, in normal circumstances they wouldn’t necessarily be awarded the same grades. Chances are, results would be closer in some subjects more than others. As this blogpost from the Higher Education Policy Institute notes, exam grades are not precisely measured and some students might not get the grade they deserve.
With larger numbers of entrants, the errors at student level (largely) cancel out when aggregated to school level. As a result, there is less volatility from year to year.
Following this approach, the closeness with which centre variability in 2020 matches the centre variability seen last year could determine how much more Ofqual does to moderate results.
Statistical predictions
In this blogpost, I set out a method by which the Key Stage 2 results of pupils entered for a subject could be used alongside past performance (value added) data to determine the set of grades a school could award.
Such a process could be used to moderate teacher judgments instead of using comparison to the previous year’s results, outlined above.
As it takes account of changes in prior attainment it does a slightly better job of predicting schools’ results, increasing the percentage predicted to within 10 percentage points from 57% under the above approach to 63% when all subjects are considered together.[2]
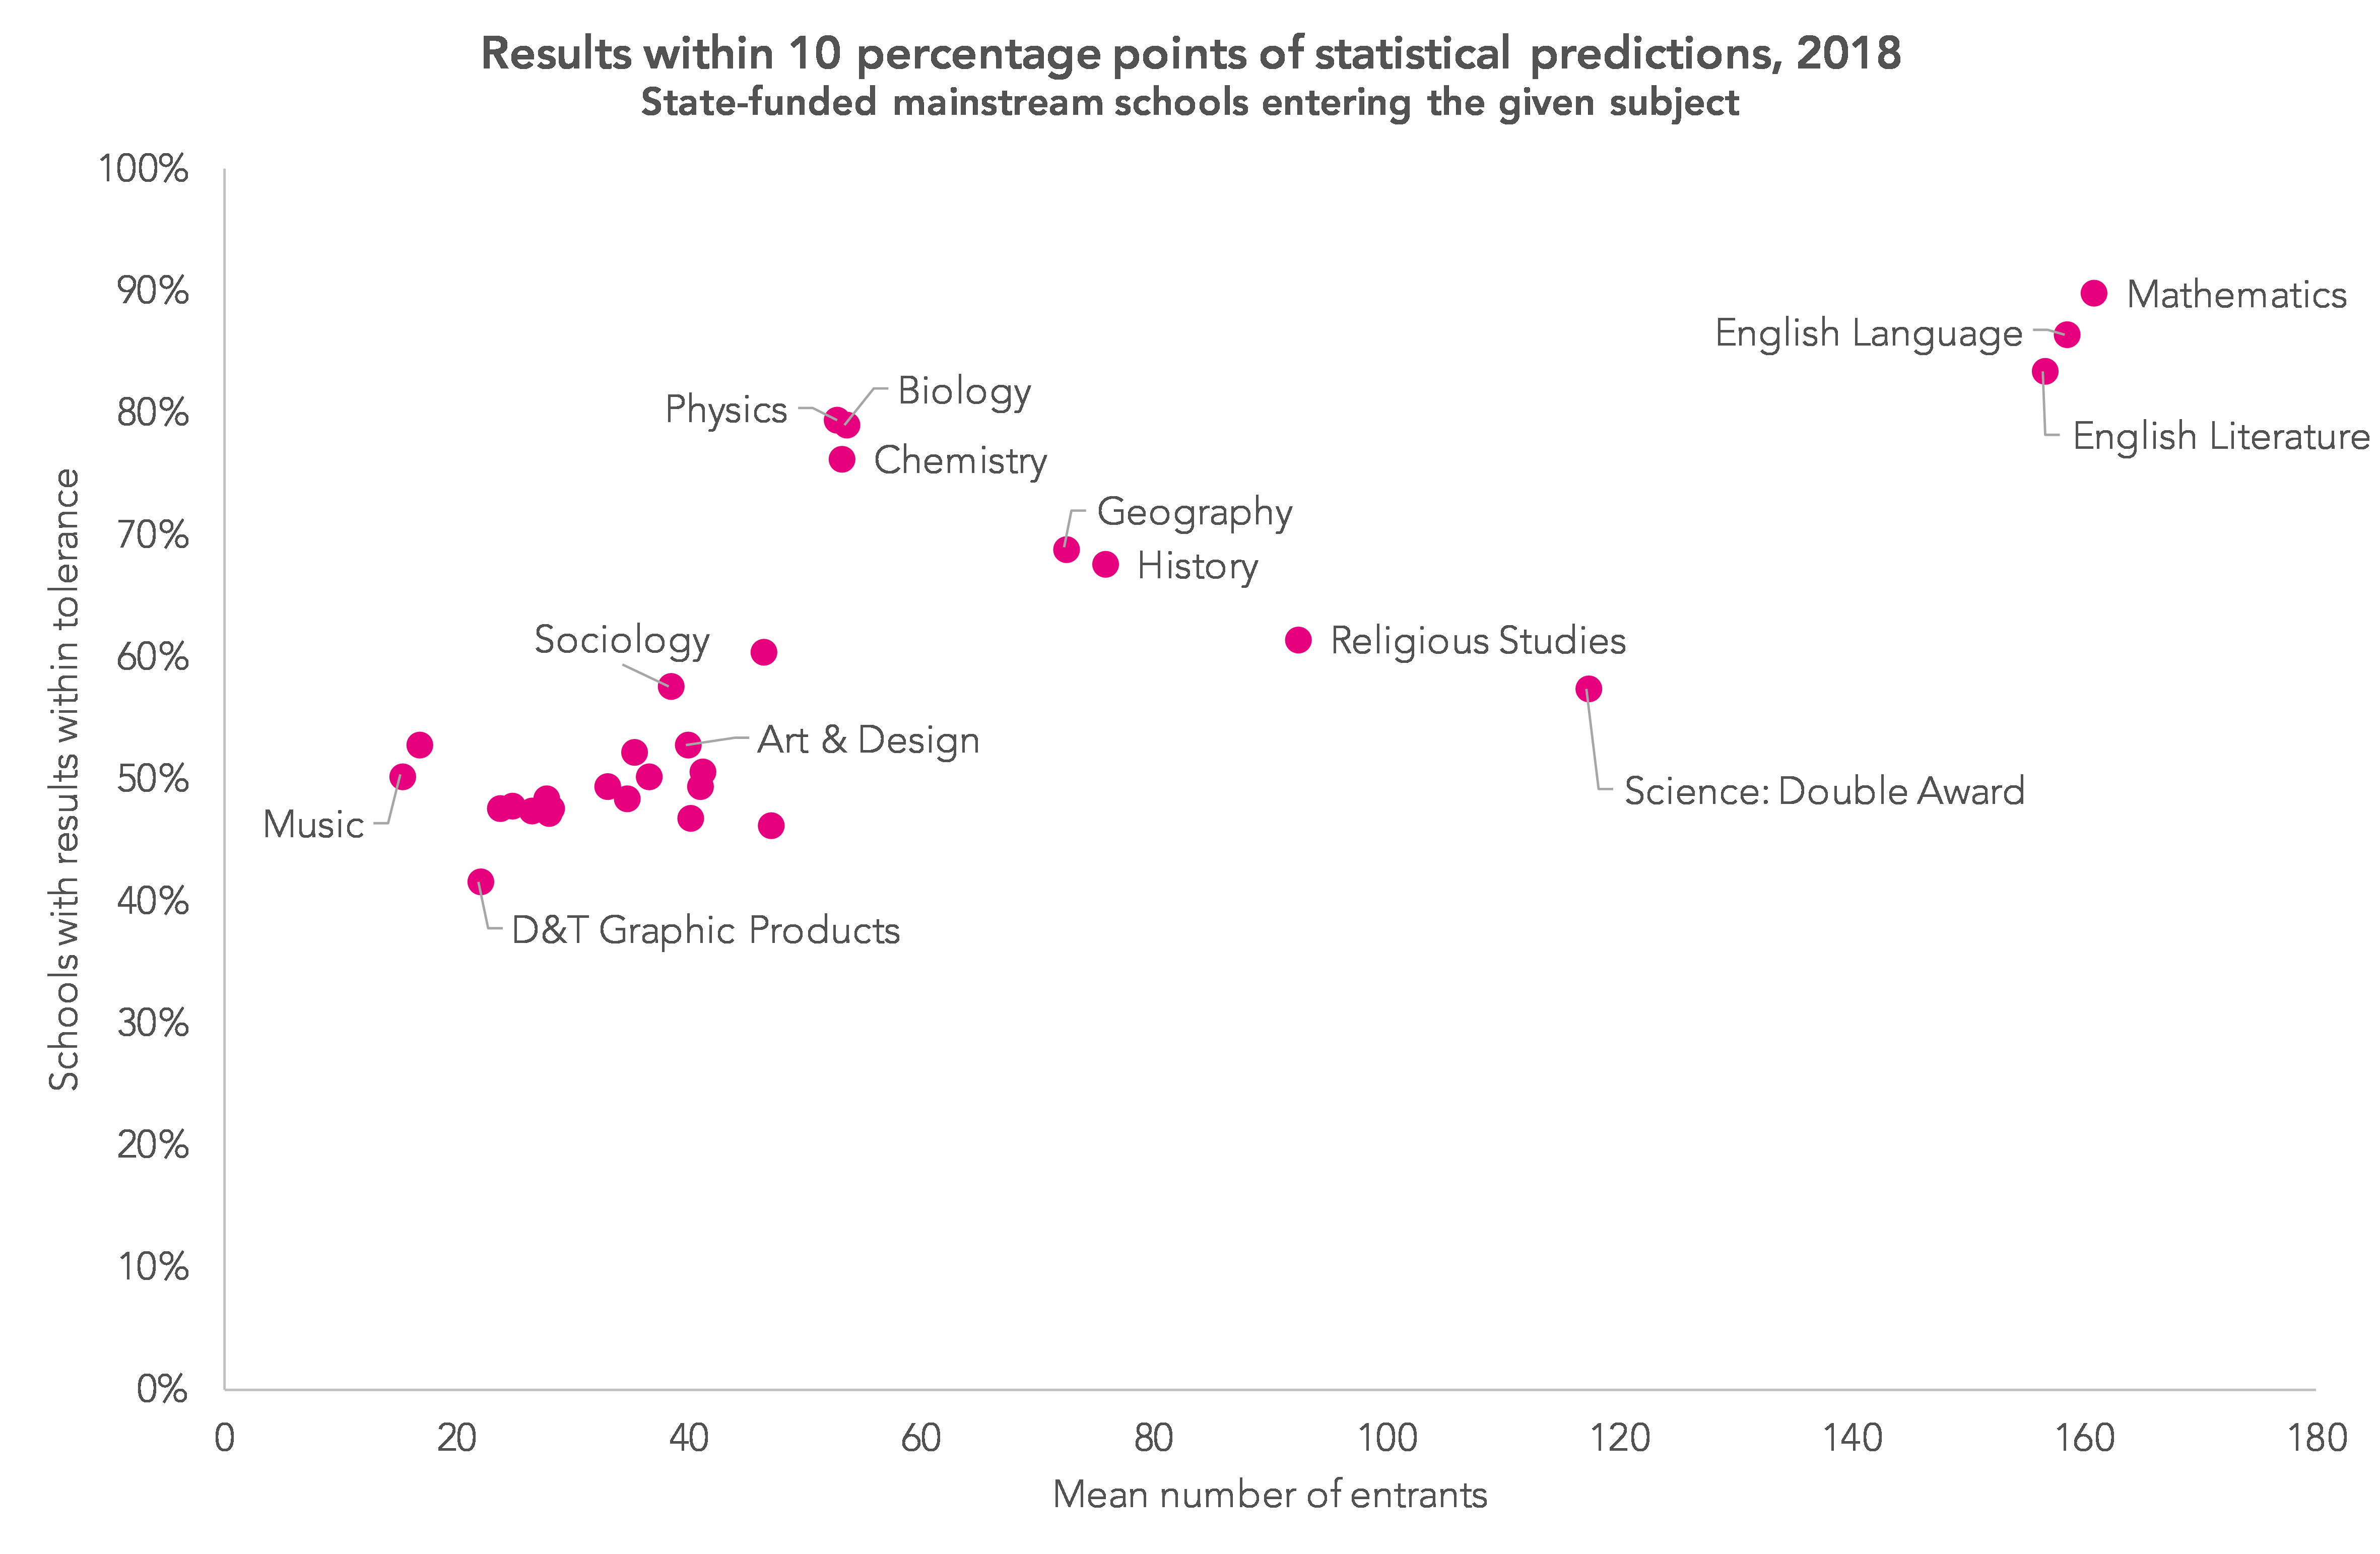
The chart below gives an indication of accuracy on a subject-by-subject basis.
This method works pretty well in some subjects, particularly English and maths where there are large numbers of entrants and cohorts are largely (but not always) similar from one year to the next However, it works much less well in subjects where there are typically fewer entrants such as music, citizenship and D&T graphic products (which is no longer available).
Summing up
The thing to take from this is that even if we had exams this year, some schools’ results would improve and some would fall. In some cases, these changes could be quite large but for every large increase somewhere, there would be a similarly sized decrease somewhere else.
At the moment, we just don’t know what the national results in each subject would look like if based on teacher judgments. If they produce something similar to last year, and there is a similar amount of volatility, with some schools’ results going up and some going down then moderation could be fairly light touch.
But if aggregated judgments appear manifestly different to last year’s results, moderation will be tougher and decisions would have to be made about which schools’ results could go up and which would have to go down.
In other words, there will be winners and losers, in terms of both schools and students, just like there are with exams. It is possible, in theory at least, that teacher judgments may be more reliable than exam grades, particularly in those subjects where exam reliability is lower. That said, we know that changes to assessment can disproportionately affect some groups more than others. This means there will be different winners and losers to if we still had exams. (Here’s how judgments could be validated to reduce bias)
And I should acknowledge that I’ve only looked at Year 11 pupils here. There are Year 10 and Year 12 pupils to consider as well. Nor have I looked at the wide range of subjects with fewer entrants or vocational qualifications. There is a lot to do.
Want to stay up-to-date with the latest research from FFT Education Datalab? Sign up to Datalab’s mailing list to get notifications about new blogposts, or to receive the team’s half-termly newsletter.
1. At least 10,000 entries in 2018. A school-subject combination is only included if there were at least six entries in both 2017 and 2018. In total, the chart is based on 54,000 school-subject combinations.
2. I’ve used a fairly crude method to do this – it should be possible to improve it further



Hi, I am very interested in views expressed in this post and previous ones. I am concerned for vulnerable pupils that have suffered major trauma, affecting their learning. What, if any, consideration will be given to these pupils that underperform in class/mocks but historically prove more able in actual GCSE exams?
Hi Rob. Suspect we’ll know more about arrangements for such pupils when Ofqual publishes its guidance on how teacher judgments should be made, including how special consideration can be applied.
Hi,
Would one outcome of your work here suggest that a different approach may be needed for subjects with small cohorts within schools compared to those larger subjects?
Ie. OFQUAL may generate one approach that is used for Maths, English and English Lit (and perhaps the individual sciences) but a different approach for the smaller subjects?
Hi Steve. Yes, I think so. Probably both in terms of the guidance it produces for schools (though you would know far better than me about the different types of evidence available in different subjects) and in any statistical approaches to moderation.
You’ve got a raft of subjects (often smaller cohorts in schools)with almost completed controlled assessment – that would seem a solid set of data for moderation in those subjects – compare grade distribution last year to this.
Potential problem – this year they are not quite complete (couple of weeks left) plus they are in school and staff are not. This would delay any marking.
Then btecs etc. have significant evidence base already completed. These again would tend to be smaller cohort subjects in schools.
That may ‘tick off’ the largest and many of the smallest subjects.
Tougher are the middle swathe of subjects – those with considerable variability from one year to next in schools (that is not as a result of cohort strength). They tend not to have controlled assessment but will have collection of objective data from mocks, tests etc.. that vary significantly from school to school.
Dear Steve
Can you comment any further on A level grade awards?
This is tremendously helpful work Dave. Thanks, as ever, for the agile response!
Do we have some evidence in the system where we have both teacher assessment and examination data and can compare the distributions of both, especially where the assessments are designed to cover the same types of outcome? The obvious examples are back in the days when we had teacher assessments and SATS results, but is there anything available to examine distributions for KS4 or KS5 outcomes?
Thanks Chris. I imagine MATs/ LAs/ individual schools have this available to them. This would be helpful in thinking about whether any groups of pupils are likely to be disproportionately affected by the new arrangements (either positively or negatively).
We’d need to be careful as teacher assessments were not designed to be predictions. For example in maths the teacher assessment included ‘application of the data cycle’ which was untreatable in the tests.
Having said that it will give a useful insight.
Ofqual said they were going to address the severe grading in GCSE German and French exams this summer by bringing them more in line with other subjects. What should teachers do when predicting this year’s grades? We have set and marked mocks using last year’s grade boundaries. Should we predict using last year‘s criteria and rely on Ofqual to align grades with different subjects or should teachers build in this promised raising of grades when they predict? Have not had a reply from Ofqual. Maybe you can get one.
Hi Monica. That’s a really good point and I really don’t know is the honest answer. To be fair to Ofqual, they’ve not had much time to think about this so far and the more you think about it, the more complicated it seems.
Monica,
My ‘best bet’ would e to hold fire until ofqual put something out there. Key is that you are consistent within your team – no good if some staff do one things and the others another.
Any ‘moderation’ would by at school level not teacher.