Regular readers will know that here at Datalab we’re always interested in the subject choices that students make. So when the Bank of England approached us about putting together a report taking a deep dive into trends in the study of economics, we jumped at the chance.
We looked at trends over the last ten years at GCSE, A-Level and first degree level, focusing in on the school and pupil characteristics that are most – and least – associated with studying economics. You can read the full report here, or read on for some of the highlights.
Data
Our analysis used data from the National Pupil Database and the HESA student record for students who completed GCSEs, A-Levels and first degrees between 2012 and 2023. One important limitation is that our analysis of first degrees only includes those students for whom data is available in the National Pupil Database – that is, those who attended school in England.
We included GCSEs and A-Levels with subject mapping codes of ‘economics’ or ‘business studies and economics’, and degrees in which at least 50% of the subject content is recorded with a JACS code L100 to L170, or a HECoS code under the common aggregation hierarchy of ‘15-02-01’.
Setting the scene
Let’s start with a look at how popular economics is as a subject, and how that’s changed over the last ten years.
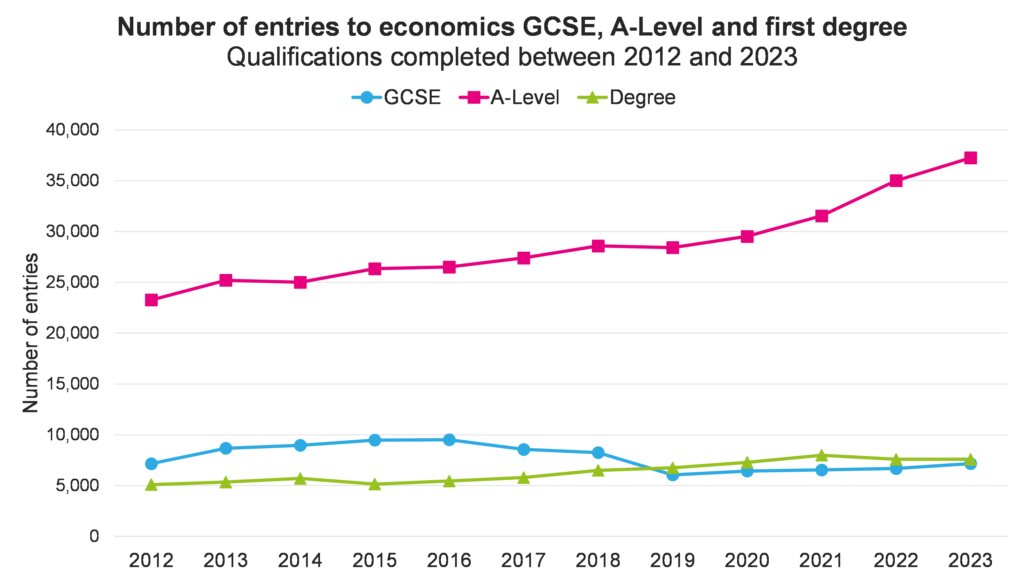
The hump that we see in GCSEs between 2012 and 2019 reflects the increasing popularity, followed by the withdrawal, of GCSE business studies and economics. See the full report for more on this qualification and how it affected trends at GCSE.
If we ignore the business studies and economics GCSE, economics has become more popular in recent years, particularly at A-Level. In 2023, around one in eight A-Level students were studying economics (12%); that compares to 29% for the most popular A-Level subject, maths.[1]
It is not quite such a popular choice at degree level, taken by around one in 25 first degree students in 2023. At GCSE it’s a rather niche option, taken by around one in 90 pupils in 2023; although the number of economics GCSE students is fairly similar to the total number of degree students, the GCSE cohort is far larger than the first degree cohort.
Demography and geography
We have a saying at Datalab: it’s demography not geography. And what we’re getting at is that regional differences are often explained by looking at differences in pupil and school characteristics across regions. The regions with issues are often those with a higher proportion of pupils from groups that are more likely to struggle with whatever outcome we’re looking at. So focusing policy efforts on particular regions can be misguided, because it misses the fact that pupils from these groups exist everywhere, they’re just more concentrated in some regions than others.
I bring this up because there are some very striking regional differences in the uptake of economics. Here we look at: the proportion of the GCSE cohort who took economics by the region of the school in which they completed KS4, the proportion of A-Level students who took economics by the region of the school in which they completed KS5, and the proportion of first degree students who took economics by the region of the school in which they completed KS5.[2]
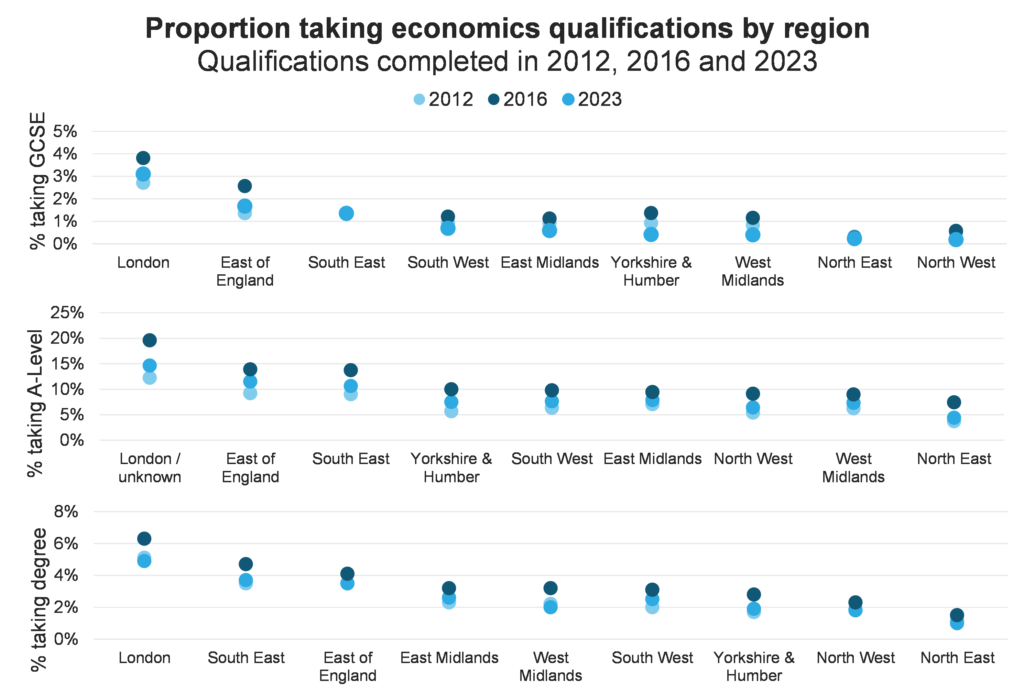
At GCSE, 43% of those taking economics in 2023 went to school in London and just 1% in the North East. The differences are not quite so extreme at A-Level (29% vs 2%) or degree (30% vs 1%) but still very large.
So why do we see such extreme differences? Is it because of differences in pupil and school characteristics, or is there more to it?
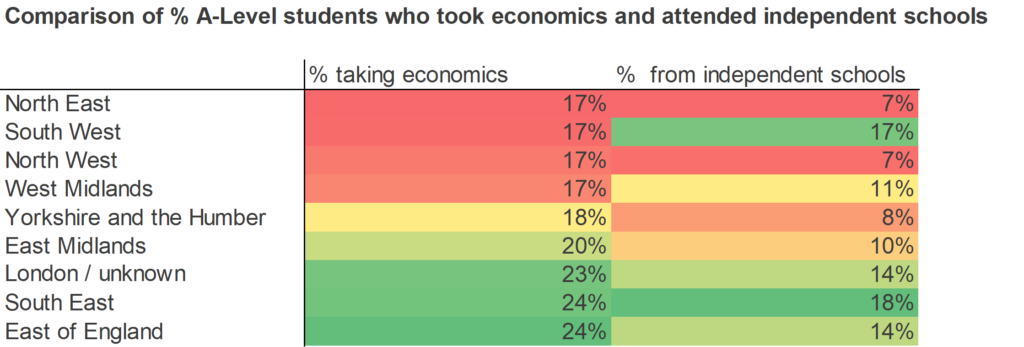
We have some clues. Economics A-Level tends to be more popular among students in independent schools: 21% of A-Level students who went to an independent school took the subject in 2023, compared to 11% of those from non-selective state schools. And the regions with high proportions of students taking A-Level economics also tend to be those with a high proportion of students from independent schools – with the South West being a notable exception.
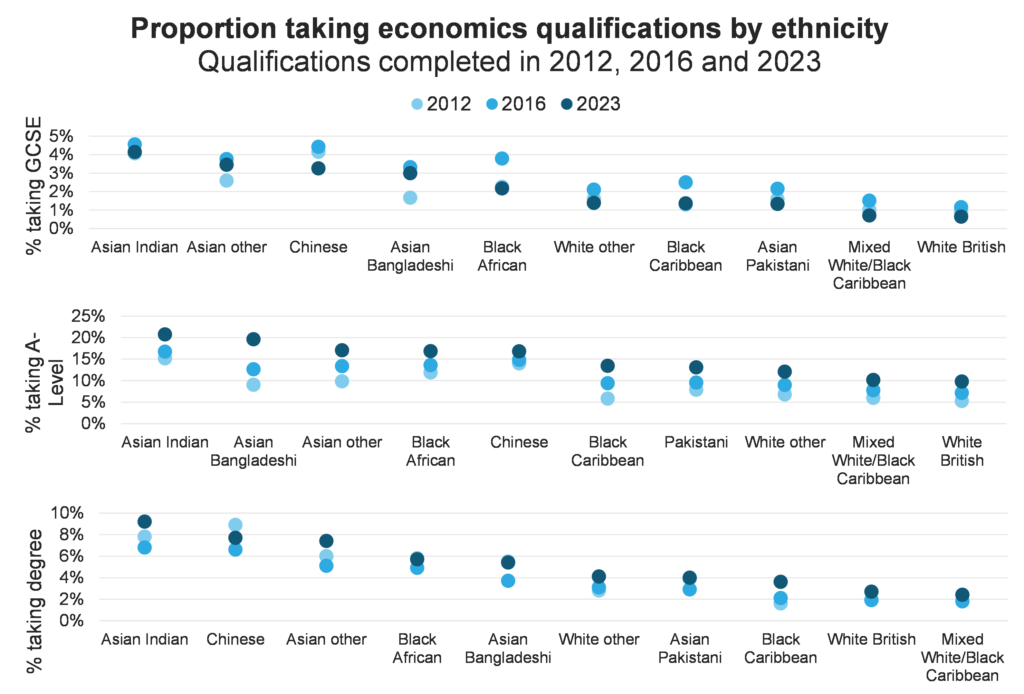
Another factor is differences in ethnic background. Students from some backgrounds – including Asian students, with the exception of those from a Pakistani background – are more likely to study economics than their peers. And others – including those from a White British and Mixed White / Black Caribbean background – are less likely.
Some regions have a far higher proportion of students from groups who are less likely to study economics than others. In 2023, just 23% of pupils in London state-funded secondary schools were white British, compared to 85% in the North East, according to DfE figures.
There may well be other differences that we didn’t cover in this piece of work, so at this point we can’t say whether regional differences are entirely explained by differences in student and school characteristics, but what we have seen suggests that at least some of the differences will be.
Just demography
Moving away from regional differences, let’s look at some trends in the profile of economics students.
Across all three qualifications that we looked at economics students were consistently around 70% male.
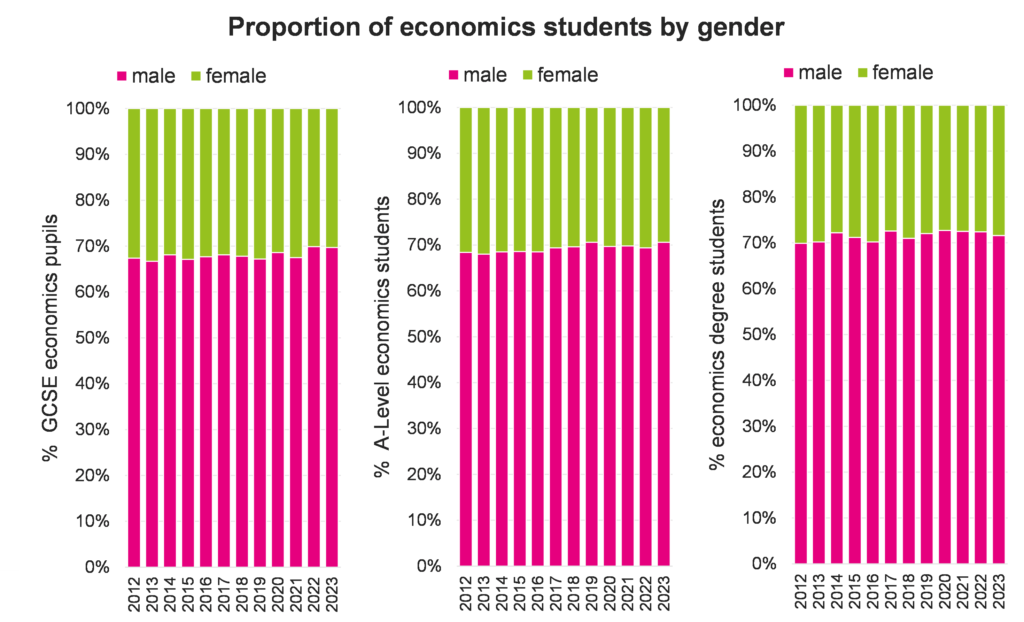
These are among the highest proportions of male students for any subject at both GCSE and A-Level. The only A-Level subjects with a higher proportion of male students in 2023 were computer science, physics and further maths.
Disadvantaged students were less likely to choose to study economics than their peers, particularly at GCSE.[2]
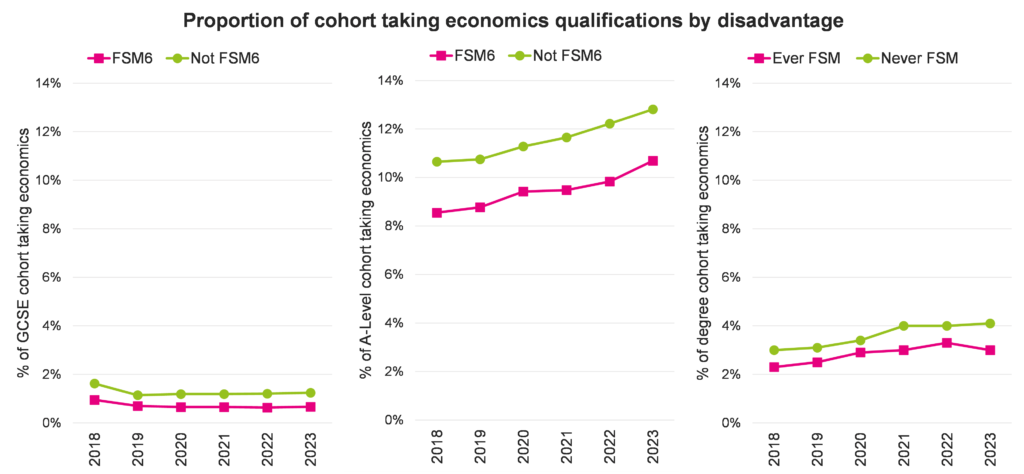
It’s worth noting that disadvantaged students are less likely to take any A-Level or first degree than their peers. We’ve shown in the past that only around 16% at least one A-Level compared to just over a third of their peers, for example.
Gender and disadvantage gaps in the uptake of economics have remained fairly consistent over the last ten years, but other things have changed. At GCSE and A-Level, economics has tended to be more popular with those who had high prior attainment, but at A-Level that tendency has lessened as the subject has become more popular.
In the chart below, we’ve split pupils into terciles based on their average points score in Key Stage 2 tests (for GCSE) and their average GCSE points score (for A-Level).
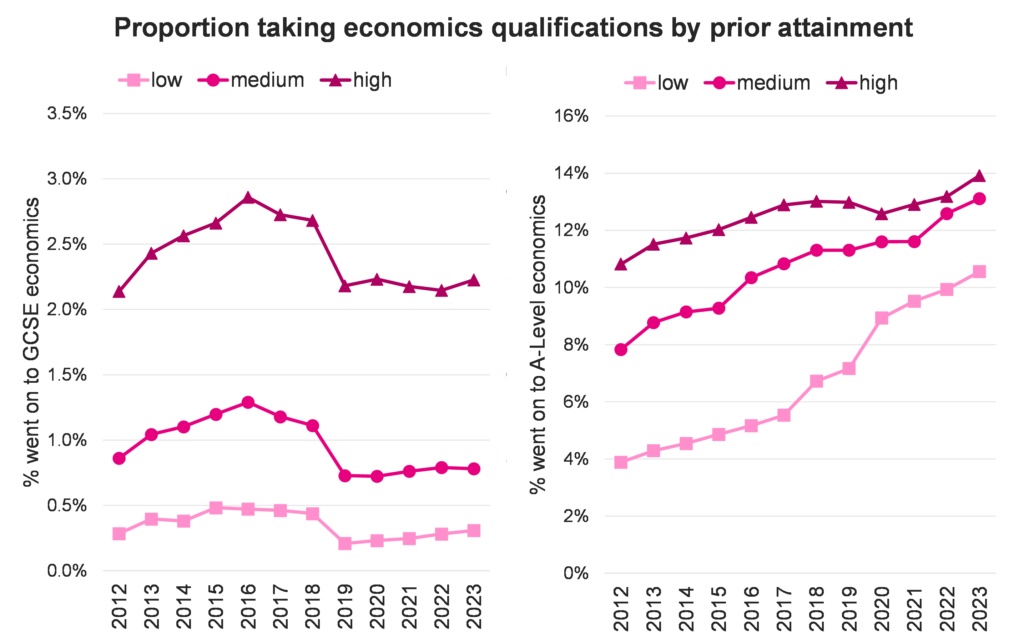
As noted earlier, the hump that we see in GCSEs between 2012 and 2019 reflects the increasing popularity, followed by the withdrawal, of GCSE business studies and economics. Over the last five years, the picture at GCSE has remained fairly consistent, unlike at A-Level.
Another thing that’s changed over time is the representation of students from state schools among economics students, particularly at degree level.[4]
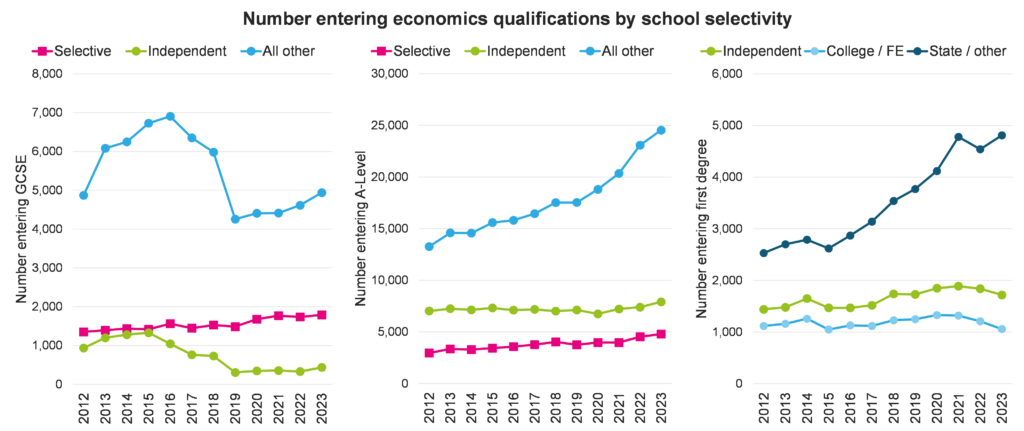
Once again, the figures between 2012 and 2019 are affected by the business studies and economics GCSE, but after 2019 we can see an increase in numbers from state schools across all three qualifications. There has been a big increase in state-school students across higher education as a whole, but the increase has been slightly faster in economics than other subjects. Although we would note that students from independent schools were still over-represented at this stage.
Summing up
Economics is a subject that has increased in popularity in recent years, particularly at A-Level. During that time it has in some ways become more diverse, with increasing numbers of students from state schools and with lower levels of prior attainment.
On the other hand, disadvantaged students are still less likely to take the subject than their peers, and, despite more take-up from state schools, it remains disproportionately popular among those from independent and state-funded selective schools. A large gender difference has remained consistent for at least the last ten years, and the subject is persistently less popular among students from some ethnic backgrounds than others.
It’s also hard to ignore the differences in take-up between regions, although we would stress, as always, that too much focus on geographical areas can be a distraction. Wherever they went to school, some groups – including disadvantaged students, female students and white British students – were less likely to study economics than their peers.
[1]: The A-Level cohort is much smaller than the GCSE cohort: around a third of KS4 pupils go on to take A-Levels.
[2]: For A-Level figures, we have included figures for pupils for whom no region is recorded in the data along with figures for London. We did this because these figures were below the disclosure threshold for working with NPD / HESA data.
[3]: Note that for GCSE and A-Level, we use FSM6 as our measure of disadvantage, while for first degree students we use whether or not they were ever eligible for FSM during their school career.
[4]: In the A-Level chart, ‘selective’ includes state-funded selective schools only. Sixth forms, colleges and non-selective state-funded schools are all included in ‘all other’.

Want to stay up-to-date with the latest research from FFT Education Datalab? Sign up to Datalab’s mailing list to get notifications about new blogposts, or to receive the team’s half-termly newsletter.

Leave A Comment