Results for A-Levels, T-Levels and other Level 3 qualifications are out today. As always, we’re bringing you our analysis of all of the main trends, hot off the press.
If this post isn’t quite enough for you, why not join us tomorrow morning for our free webinar when we’ll run through all of the below plus some additional content and analysis.
We’re basing all of our analysis on the national figures published today by the Joint Council for Qualifications and Ofqual. These figures do largely focus on A-Levels, along with some limited data on T-Level entries, so that’s where this post will start. But we will be including analysis of trends in other qualifications as and when data is made available.
If you want more detail about any individual A-level subject then check out our dedicated results microsite.
Grades in England are up (very) slightly this year
There has been a small increase in top grades at A-Level since last year. This is the second year in a row that the percentage of entries achieving grade A or A* has increased. In 2023, it stood at 26.5% for students in England. This year, it’s up to 28.2%.
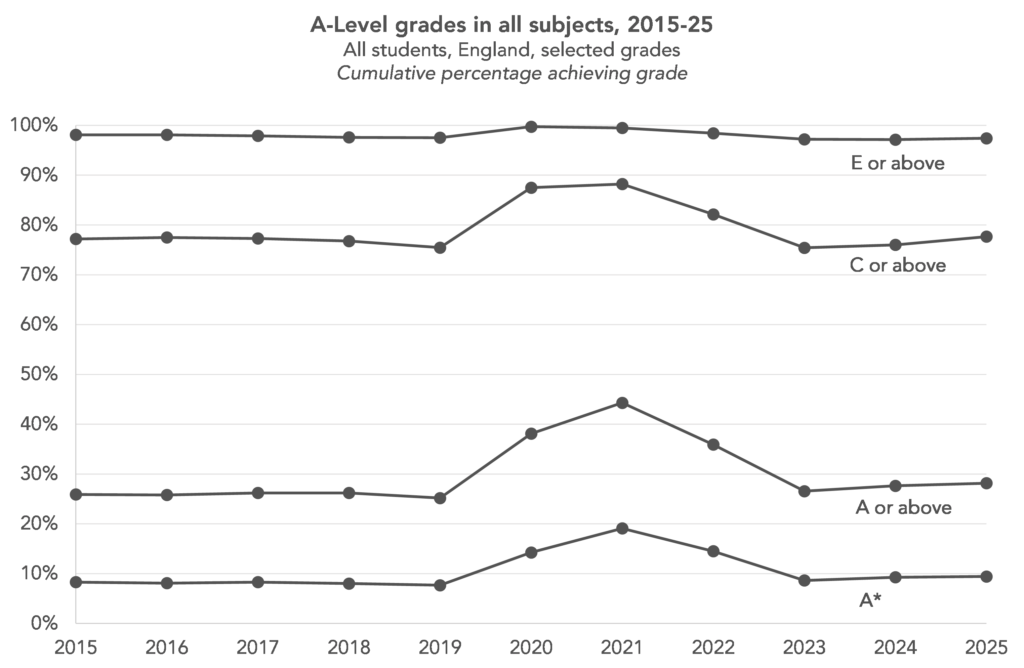
We should stress again that this is a small change, particularly when compared to the dramatic changes that we saw during and immediately after the pandemic.
But it’s worth noting that grades in 2023 were already slightly higher than the typical pre-pandemic level. With the increases since then, the percentage of entries achieving a grade A or A* is now three percentage points higher than in 2019.
If we look at Wales and Northern Ireland, we see a slightly different picture. Top grades in Wales are very slightly down compared to last year, and those in Northern Ireland have barely changed.
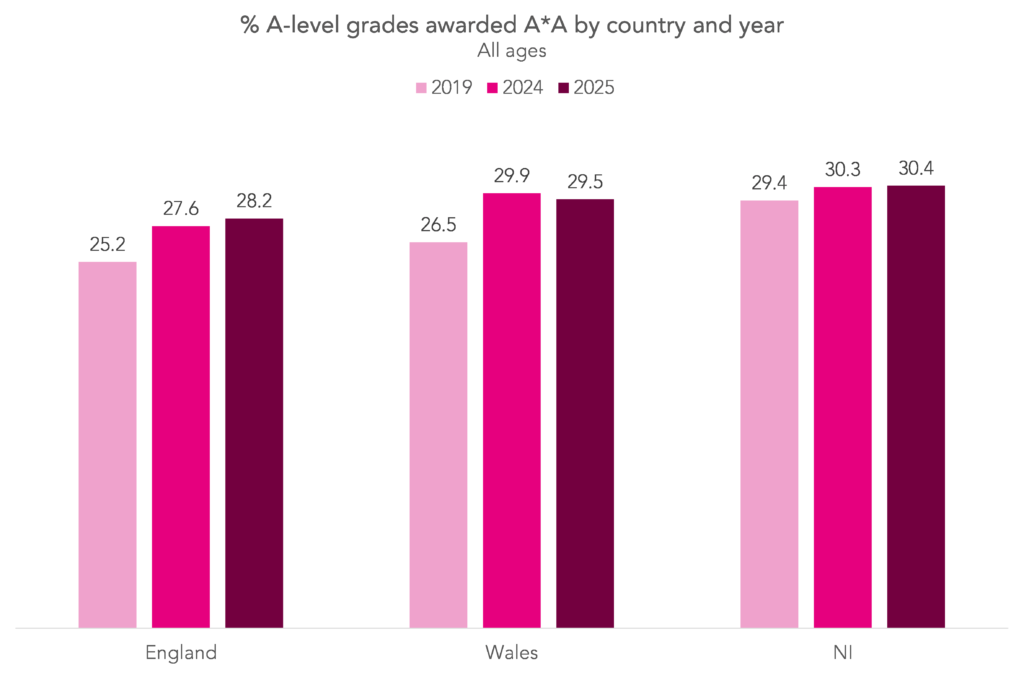
Grades in all three nations are somewhat higher than in 2019, although the difference is smallest in Northern Ireland.
Results for most A-Level subjects remain stable
The overall picture of little change in results across all subjects is largely reflected in results in individual subjects.
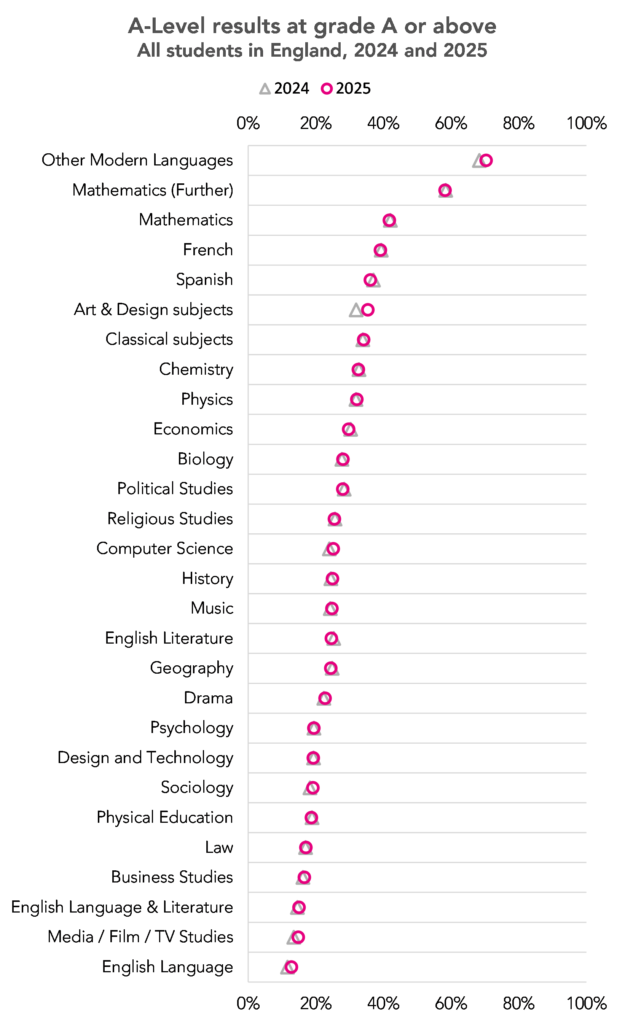
There was an increase of around 2 percentage points in the percentage of students awarded grade A*-A in art and design and other modern languages (languages other than French, German and Spanish). The latter is the subject with the highest percentage of entries graded A*-A.
In all other subjects shown in the chart above, the percentage of entries awarded A*-A in 2025 was within 0.5 percentage points of 2024.
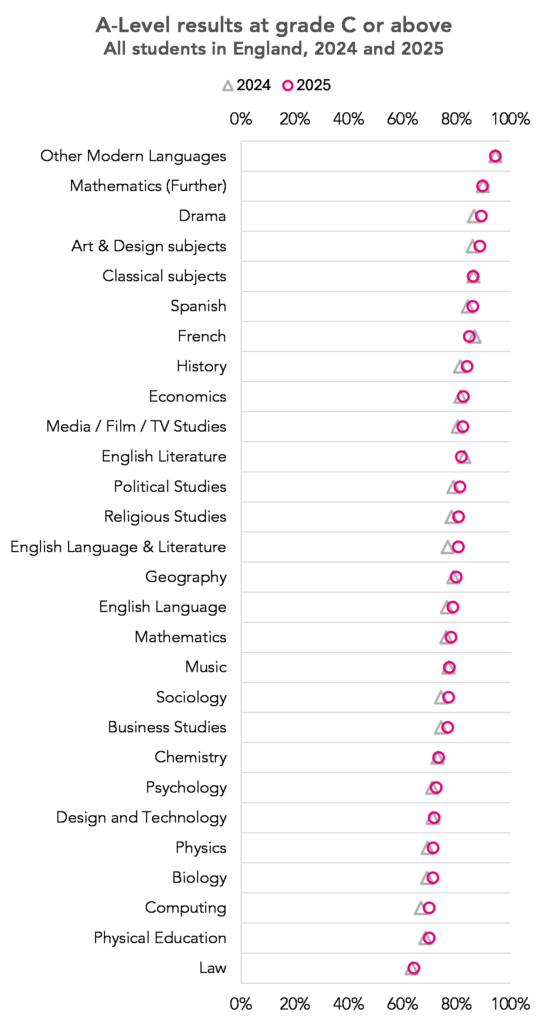
Slightly more change is observed at grades A*-C.
There were increases in the A*-C rate of 2 percentage points or more in drama, art and design, history, political science, religious studies, sociology, English language, business studies, physics, biology and computer science.
The interactive chart below allows you to select an A-Level subject and see the grade distribution in 2019, 2024 and 2025.
T-Level entry numbers continue to climb, but retention is still a problem
Almost 12,000 young people received results in T-levels today, an increase of over 60% on last year’s entry numbers. This rapid growth is to be expected given that T-levels are a relatively new qualification which will take time to bed in.
For context, more young people entered A-level PE this year.
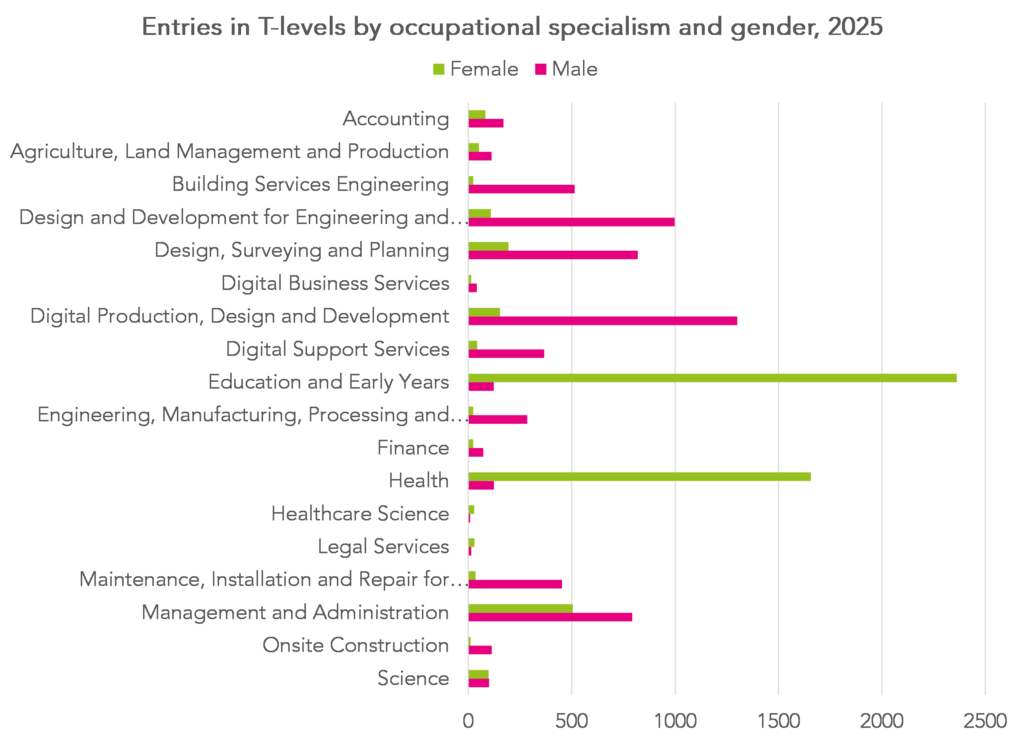
Results were achieved in 18 different occupational specialisms, two more than last year.
Almost 75% of girls who entered a T-level did so in just two specialisms: Health and Education and Early Years. Boys were more evenly distributed across the specialisms.
Retention on T-level programmes remains a concern. Provisional data published today by the Department for Education shows that 27% of those who started a T-level programme at the start of 2023/24 were not “retained and assessed” at the end of 2024/25.
Sign up to our newsletter
If you enjoy our content, why not sign up now to get notified when we publish a new post, or to receive our half termly newsletter?
An increase in top grades in Applied General qualifications
The main route to achieving advanced level (level 3) qualifications for those who do not study A-levels remains via vocational and technical qualifications (VTQs), an umbrella term for a vast array of different qualifications that are available to learners post-16.
VTQs generally consist of two types: applied general qualifications (of which BTECs are the most widely known) and technical qualifications.
These qualifications were largely overlooked on A-level results day in the past. However, both JCQ and Ofqual have put in much effort in recent years to produce results day statistics. This is fairly challenging given the diversity of the qualifications landscape.
Reporting tends to focus on the subset of these qualifications are eligible for inclusion in DfE Performance Tables.
In the chart below, we show the percentage of students achieving D*-D in Applied General Qualifications with a starred distinction (D*), distinction (D), Merit (M) and Pass (P) grading structures. We do this for three types of qualification, those equivalent to 1 A-level, those equivalent to 2 A-levels and those equivalent to 3 A-levels.
Entries in Applied Generals equivalent to 1 A-level are by far the most common with 116 thousand entries in 2025, compared to 16 thousand in those equivalent to 2 A-levels and 32 thousand in those equivalent to 3 A-levels.
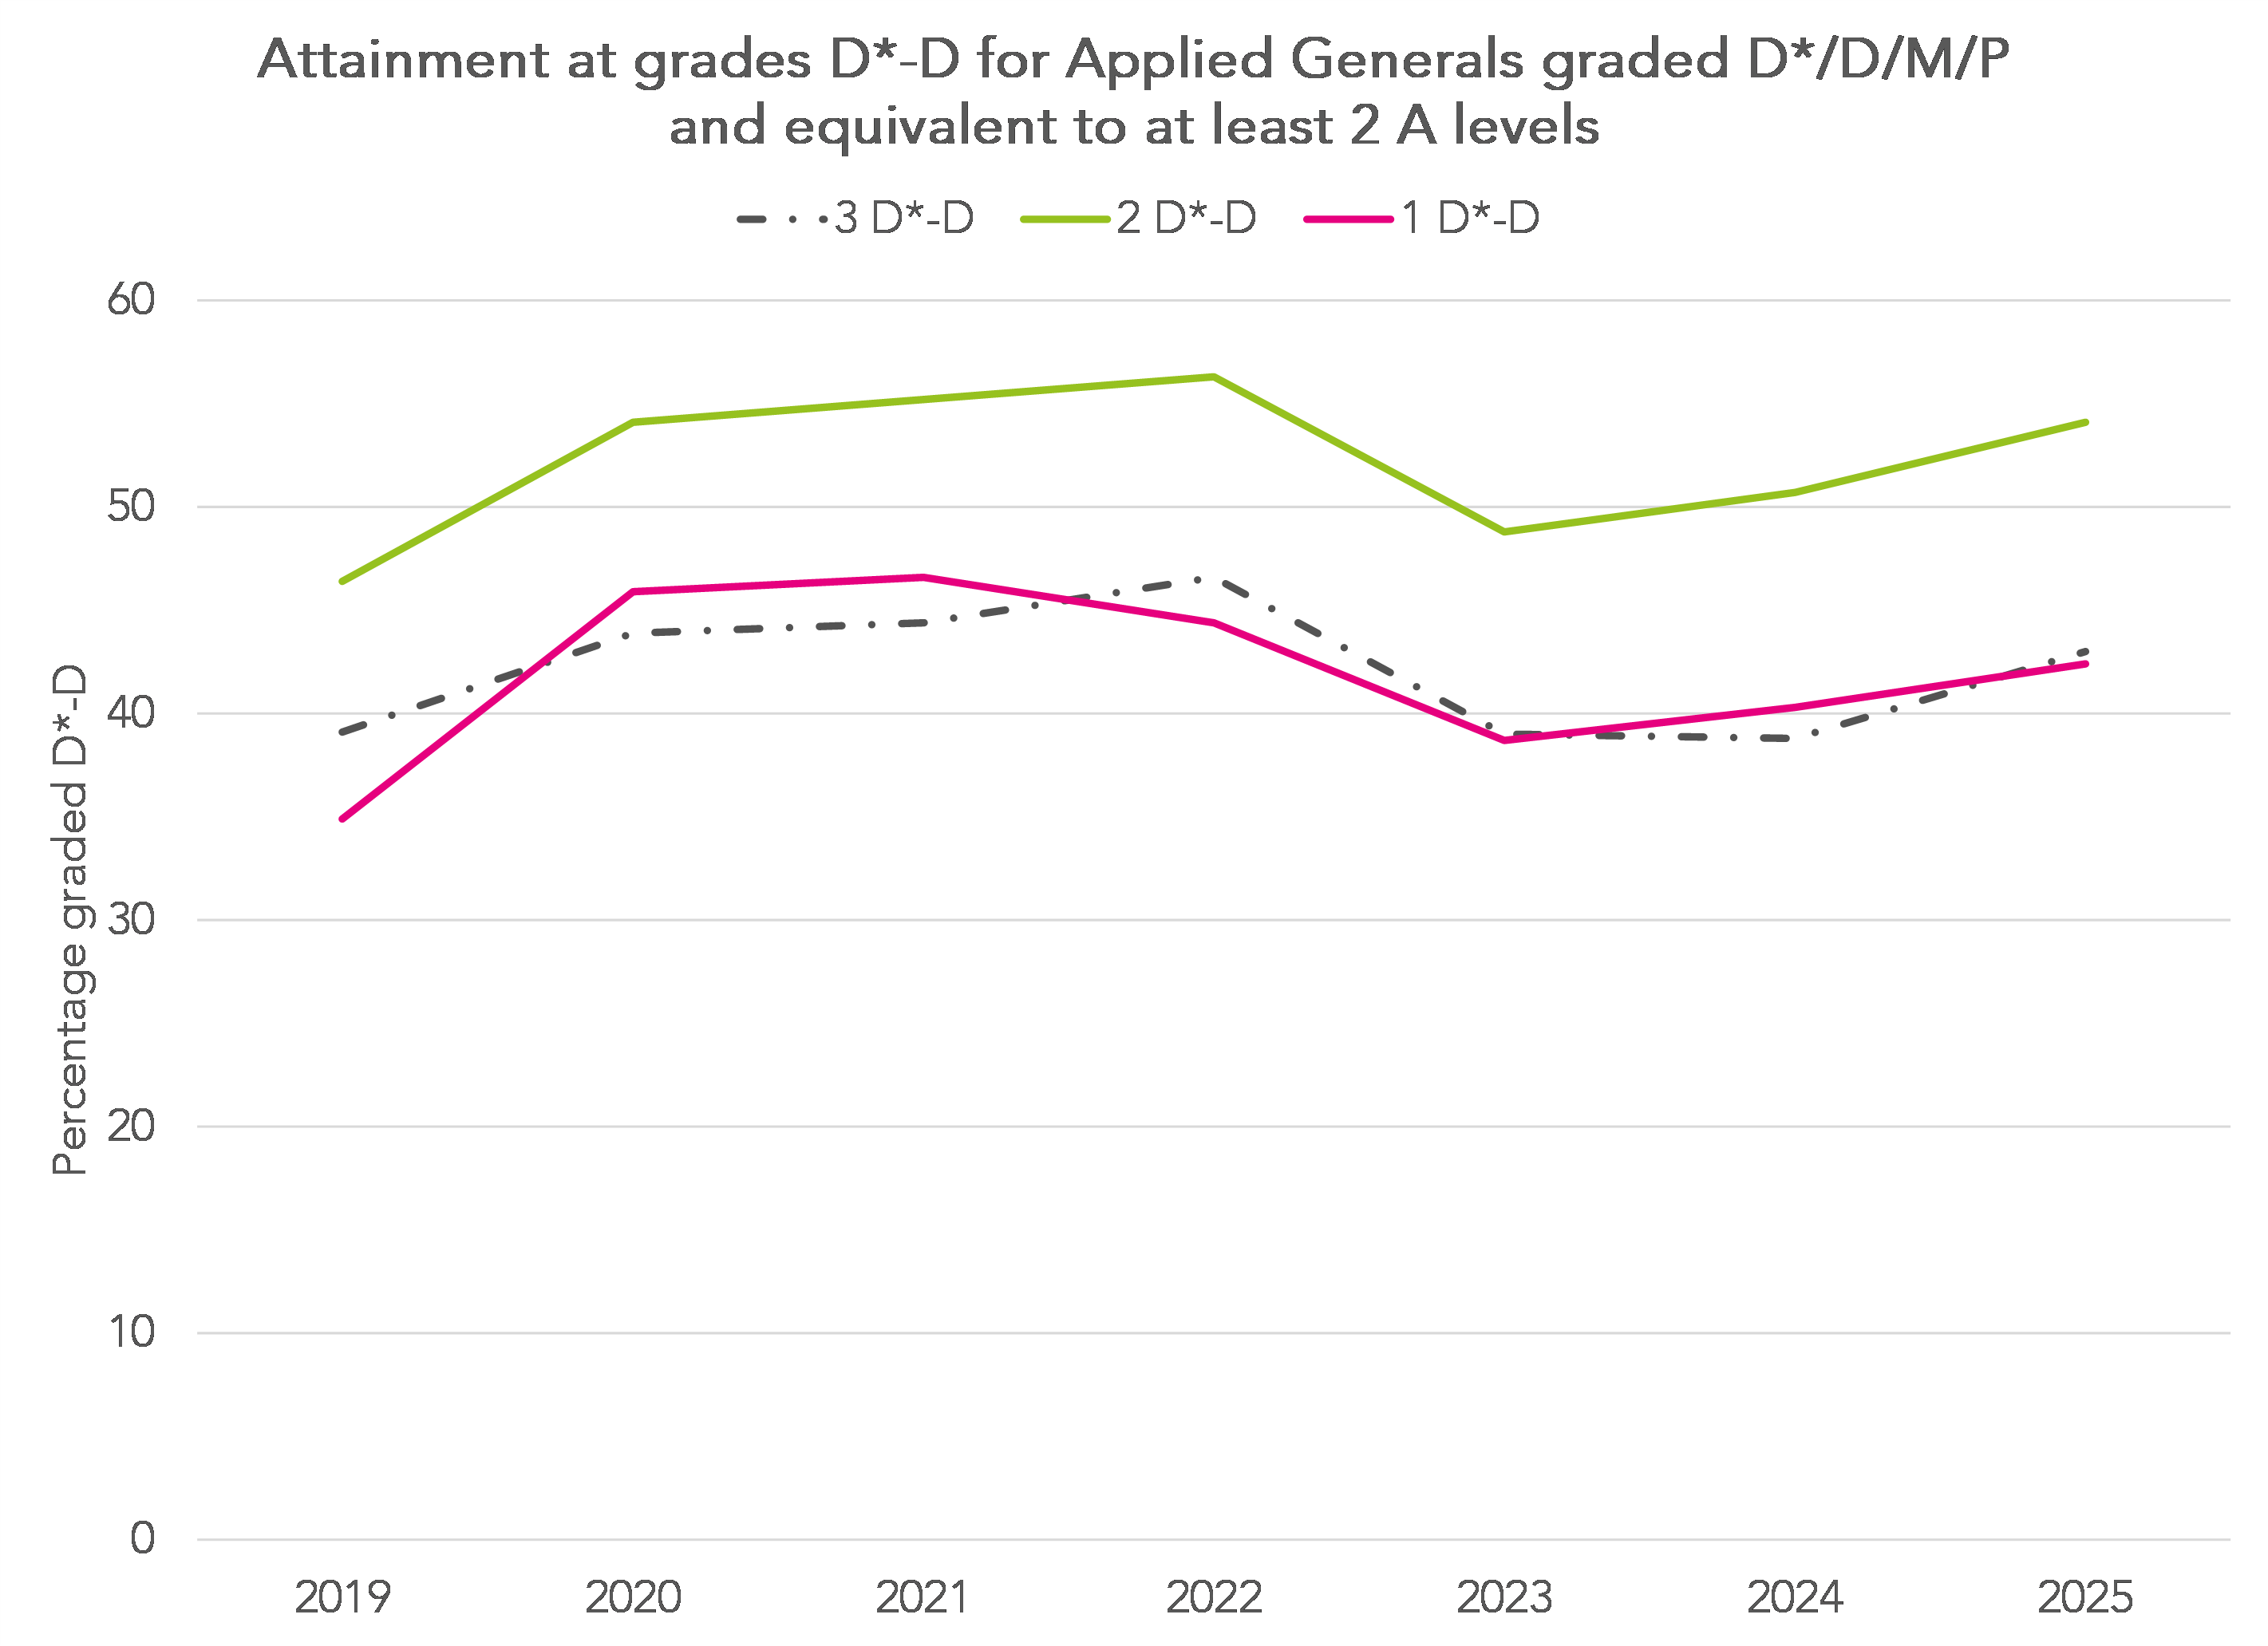
Across all sizes of Applied General qualification, there was a slight increase in the percentage of entries graded D*-D again this year.
The D*-D pass rate was broadly similar to that recorded in 2020 (for which Centre Assessment Grades were used in place of the exam component) in Applied Generals equivalent to 2 (or 3) A-levels.
Attainment remains higher in Applied Generals equivalent to 2 A-levels.
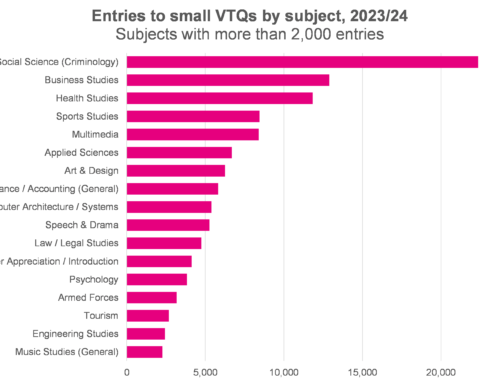
Ofqual publishes data on attainment in VTQs broken down by Sector Subject Area (SSA). In the following chart we show the percentage of entries graded D*-D by SSA in Applied General qualifications equivalent to 1 A-level.
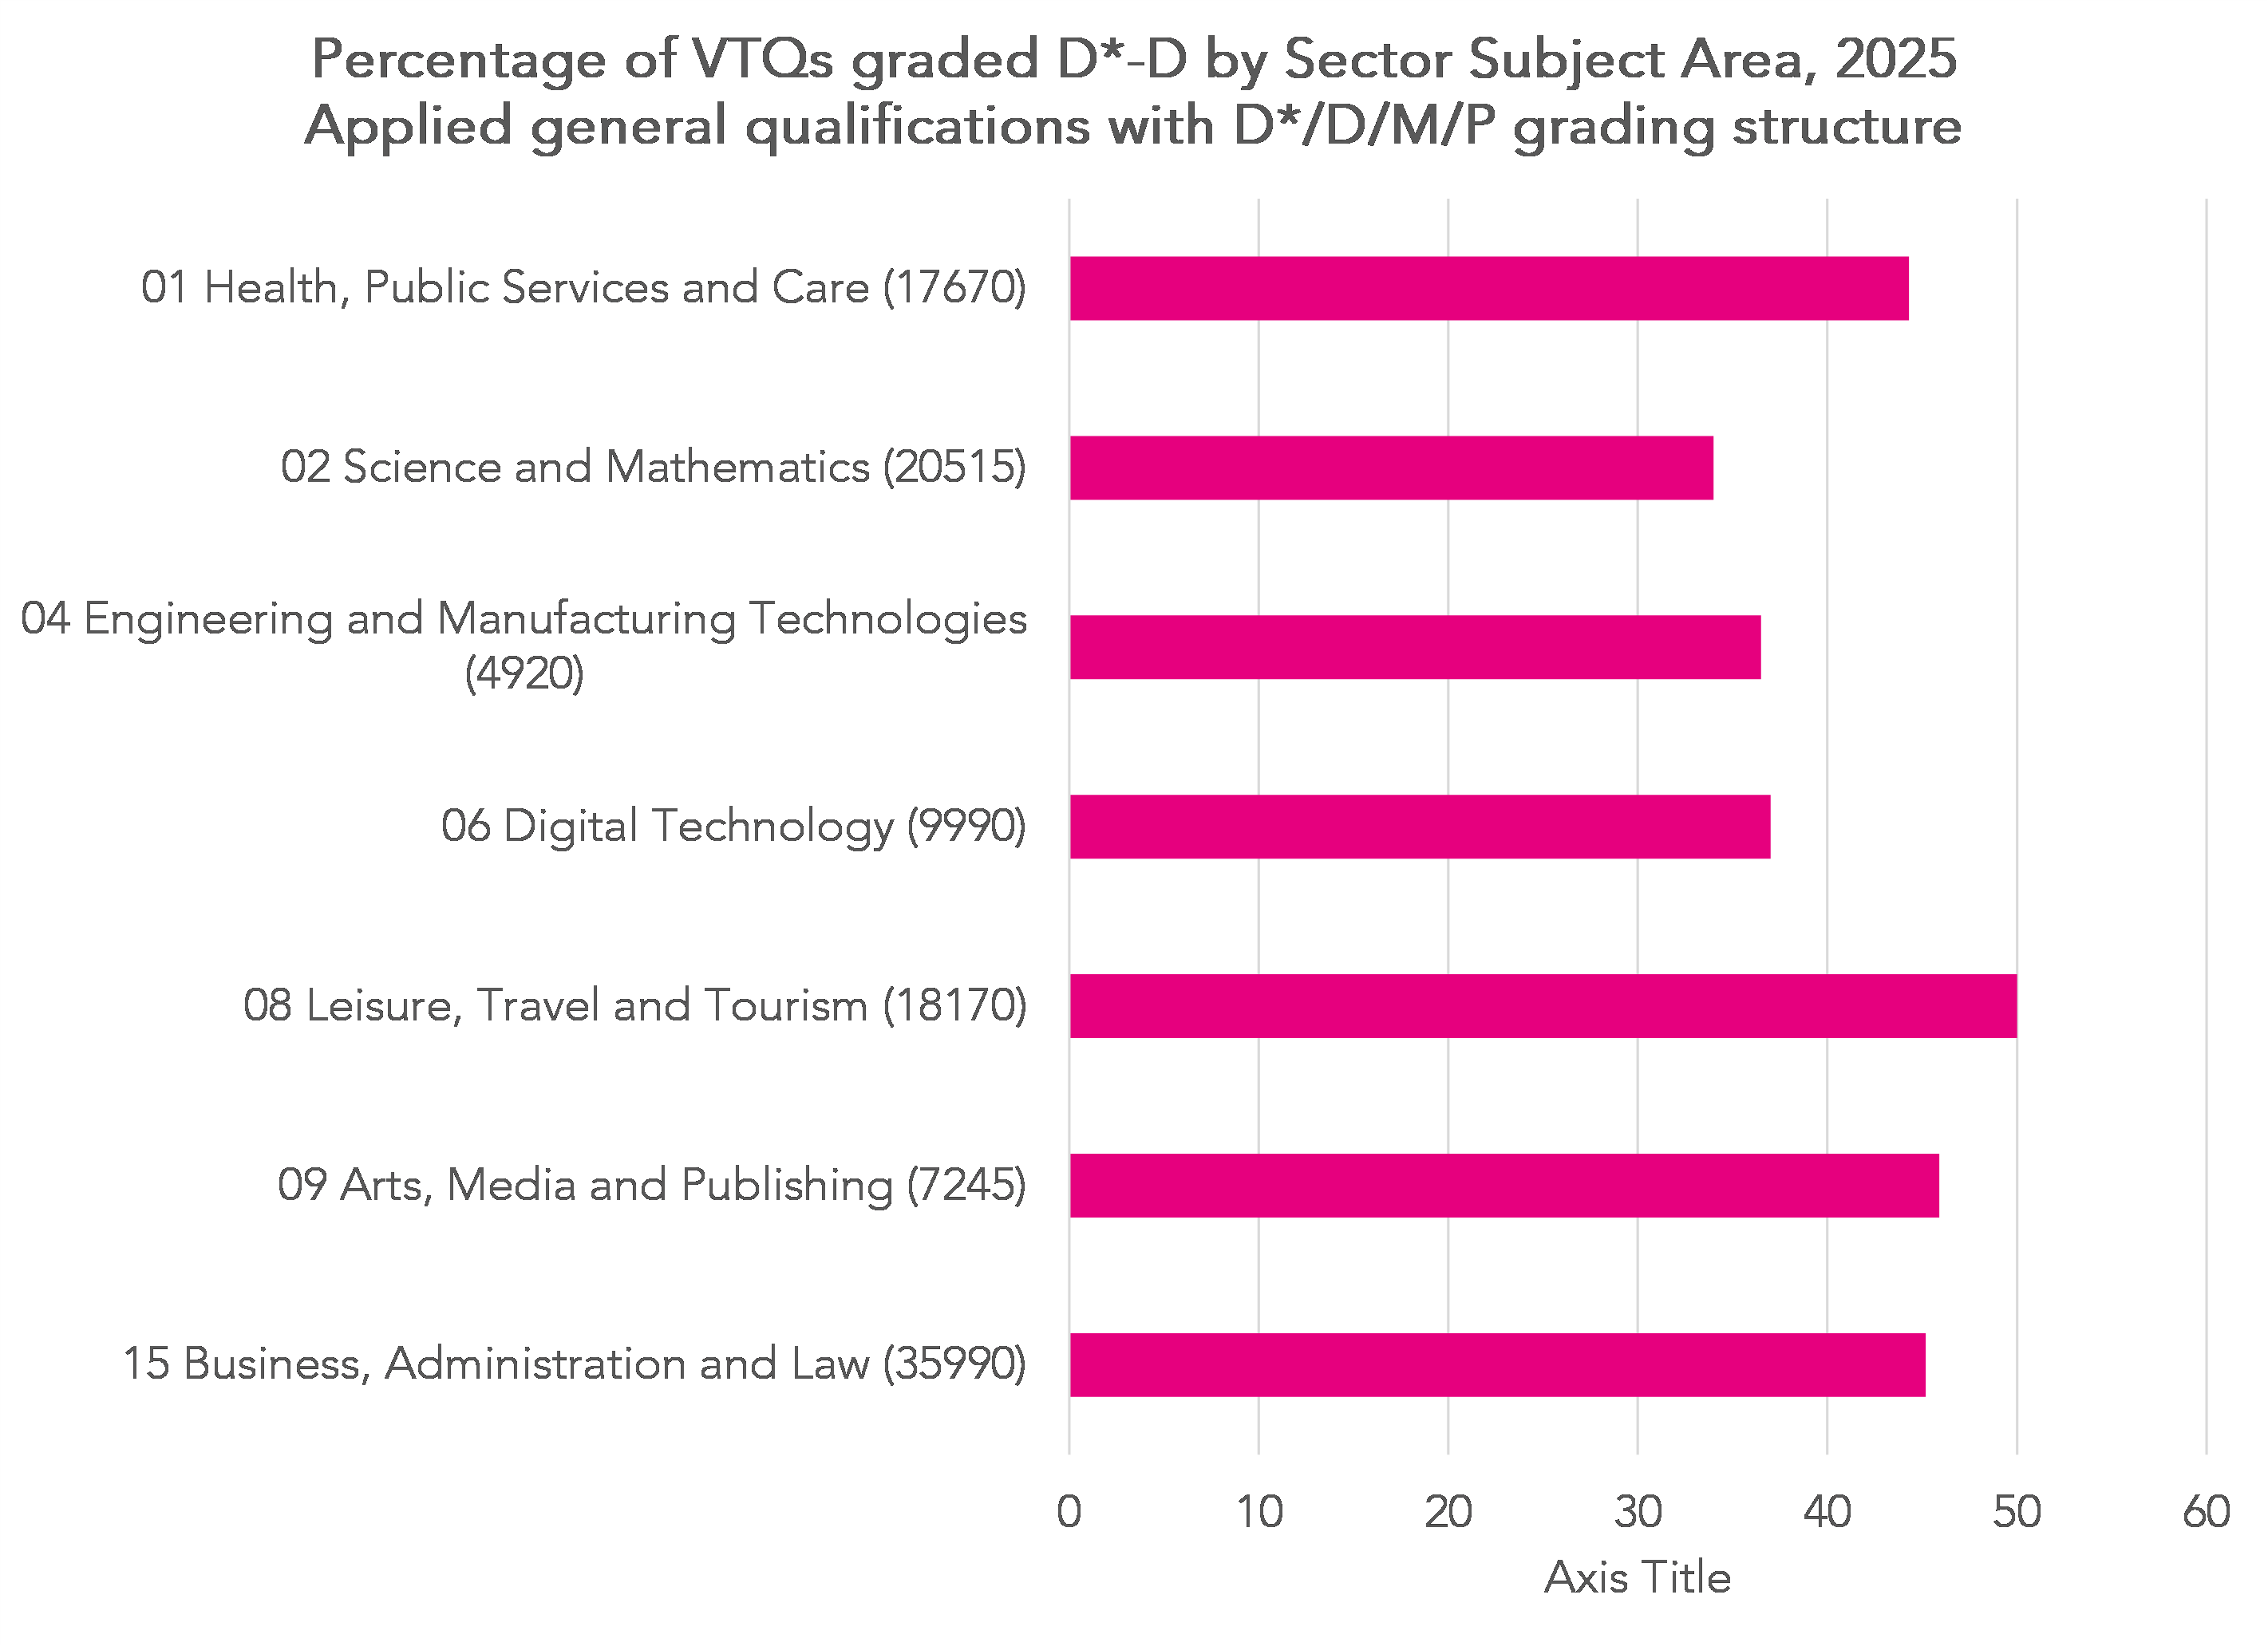
50% of students with entries in Leisure, Travel and Tourism achieved D*-D.
By contrast, attainment at D*-D within the Science and Mathematics SSA (the SSA with the second largest number of entries) was lower at 34%.
A-Level entries are up in maths, physics and economics
Maths continues to be the subject with most entries, up 4% to almost 105 thousand entries this year. This is part of a general longer-term trend although, as we show here, there have been years where the number of entries has fallen compared to the previous year.
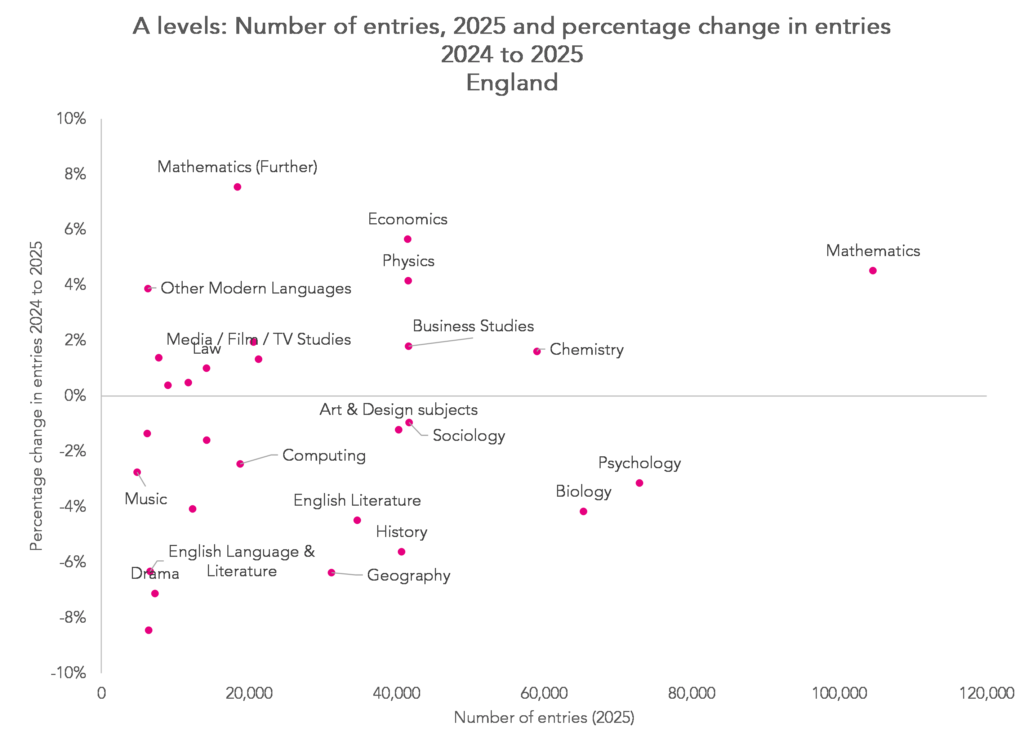
Having fallen between 2021 and 2023, entries in physics increased by 4% this year, having increased in 2024 as well.
Entries in economics continue to rise, increasing by 5% this year.
A number of subjects, such as geography and history, have seen slight falls in entry rate this year.
In some cases, such as drama, this is part of a longer-term trend.
However, entries in geography and history have tended to fluctuate from year to year. Don’t read too much into the change between one year and the next in these subjects.
Finally, there has been a second year of a fall in entries in psychology, a subject which had experienced several years of rapid growth beforehand.
There’s not much change in the gender gap in A-Level grading
Earlier in students’ school careers, there tends to be a marked gender gap in grading. At GCSE last year, for example, 25.5% of entries from female pupils achieved grade 7 or higher, compared to just 19.8% of those from male pupils.
At A-Level, the gender gap usually looks different. It’s worth remembering that female students are more likely to enter A-Levels than male students – there were nearly 440,000 entries from female students this year, compared to less than 380,000 from male students.
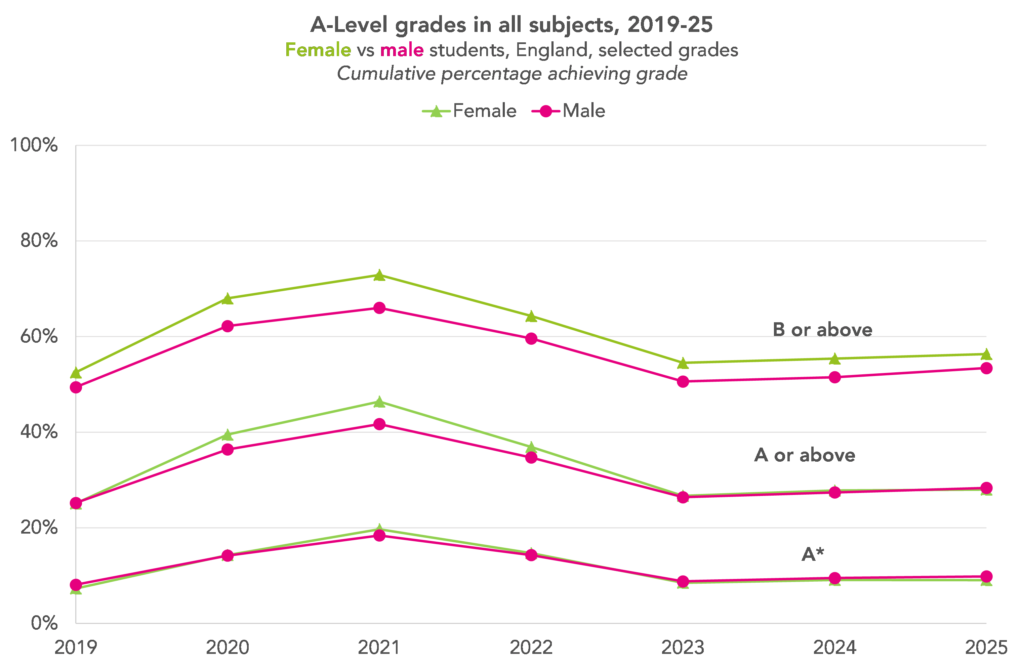
Pre- and post-pandemic, male students have been slightly more likely to achieve an A* grade than their female peers. This year, 9.8% of A-Level entries from male students did so compared to 9.1% of female students. They are also slightly more likely to receive lower grades: this year, 21.2% of entries from male students received a grade of D or below, compared to 18.5% of entries from female students.
As noted above, top grades are slightly up overall this year. But they’ve increased slightly more for entries from male students than those from female students. The percentage graded A or A* from male students is up from 27.4% to 28.4%, an increase of one percentage point, compared to an increase from 27.8% to 28.0% from female students, an increase of just 0.2 percentage points.
As with overall grading, the changes to the gender gap this year are much smaller than the dramatic changes seen during the pandemic. From 2020-22, entries from female students were more likely to achieve top grades those from male students, but we do now seem to have returned to something close to the pre-pandemic norm.
Regional differences in grading persist
In terms of the percentage of A*-A grades awarded in each region, there was little change between 2024 and 2025.
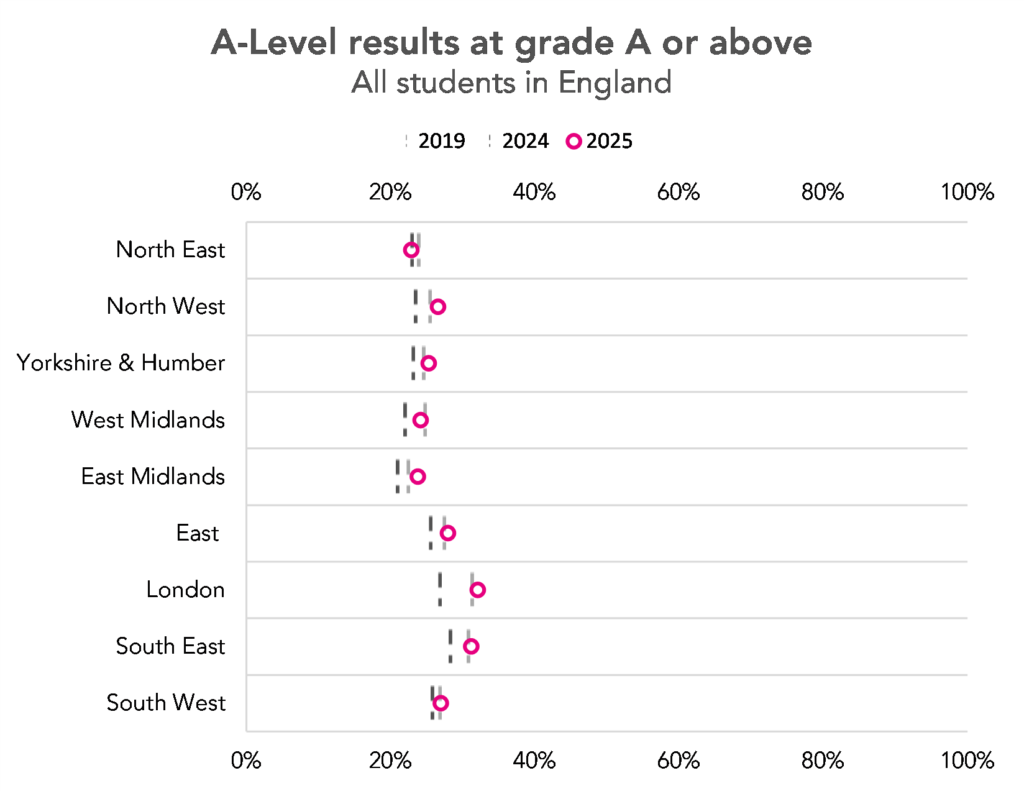
Compared to 2019, the A*-A rate in London was 5 percentage points higher in 2025, the largest increase of all the regions in England.
Grades in independent and selective schools remain above those in other centre types
Results broken down by centre type also show little change compared to last year.
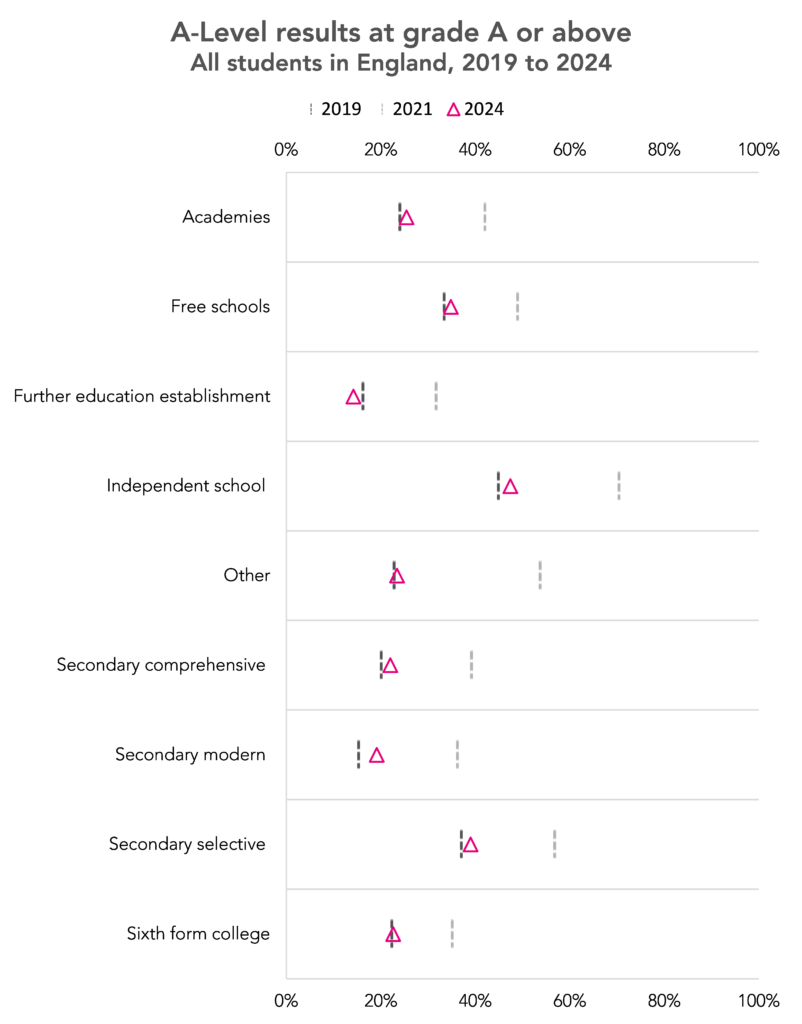
We generally advise caution when using the data published by Ofqual. The centre types are those reported by schools and some of the categories are not mutually exclusive (e.g. most academies are secondary comprehensive schools).
Taking the data at face value, there is little change across the centre types in the percentage of A*-A grades awarded.
Compared to 2019, there has been an increase in the A*-A pass rate across all centre types with the exception of FE colleges.
The A*-A pass rate was at least 5 percentage points higher in 2025 compared to 2019 in independent, secondary selective and free schools. In the case of the latter group, the number of centres with results increased from 47 to 86 over the period as more new schools received their first set of results.
Don’t miss our results day webinar at 10am on 15 August. Sign up now for your free place.
Want to stay up-to-date with the latest research from FFT Education Datalab? Sign up to Datalab’s mailing list to get notifications about new blogposts, or to receive the team’s half-termly newsletter.

Thank you for this information. Lat year you shared a really useful graph with National data for Applied Generals so we were aware of National averages Dist*-Dist and Dist*-Merit. Could a similar one be produced? This was useful in my work across the borough of Barnet.
Hi Tracy. Thanks for commenting and especially for being so quick off the mark – less than 10 mins after we published the post! Unfortunately the data that we used to make the chart you mention hasn’t yet been published for this year. We’re hoping it will be made available later in the day. If and when it is, we’ll update the post to include a version of the chart.
We should not forget, although everyone seems to have done so, that 2019 was still in the ‘saw tooth’ model used for the new syllabus, with the expectation that grade levels would continue to be deliberately lowered as students became accustomed to the expected standard. (I speak with especial reference to A Level Maths.)
On the face of it, grades are still inflated.