Over the past year or so we’ve been working with children’s charity Chance UK on an analysis of primary school exclusions. They wanted to know about the outcomes of children who experience permanent exclusion or suspension at primary school.
You can read the report in full here. For the highlights, read on.
Suspensions and exclusions are much rarer at primary than secondary
Most research into exclusions tends to focus on pupils in secondary schools. And there’s a good reason for that: the majority of suspensions and permanent exclusions take place among older pupils.
In the latest year for which data is available, 2021/22, there were around ten times as many suspensions and exclusions at secondary than at primary (1.42 primary vs 13.96 secondary suspensions per 100 pupils, 0.016 primary vs 0.16 secondary permanent exclusions per 100 pupils).
As a result, we don’t know very much about outcomes of pupils excluded at primary school. This is the gap we aim to address with this research.
The data
We used data from the National Pupil Database (NPD) to track five cohorts of pupils, born between September 2003 and August 2008, through their school careers. There were around 600 thousand pupils in each cohort, or 3.2 million in total. These pupils would have entered Reception between 2008/09 and 2012/13[1], and finished Year 11 between 2019/20 and 2023/24.
Due to the timing of the research and availability of data, we were only able to track the oldest three cohorts through to the end of Year 11.
Timings of suspension and exclusion
Across all five of the cohorts we observed, around 2.4% of pupils experienced a suspension or a permanent exclusion at primary school. 0.14% of pupils were permanently excluded, and 2.3% were suspended. (Here and throughout, when we talk about the population of pupils who were suspended, we mean those who were suspended but not permanently excluded.) We show the breakdown by cohort below:

Now, let’s look at when pupils’ first suspension/exclusion occurred.
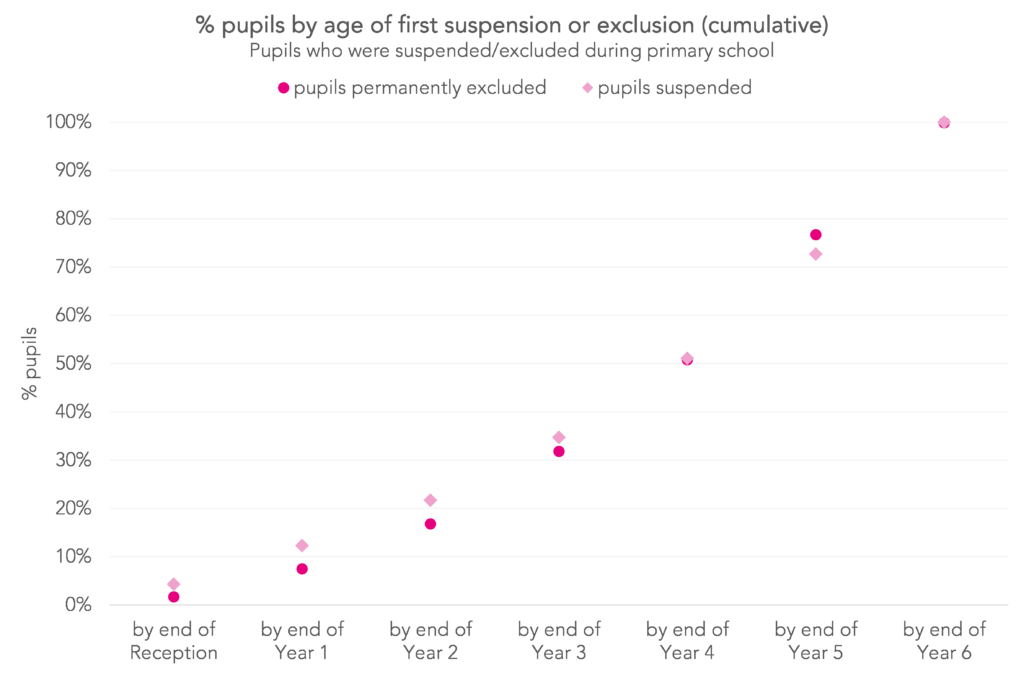
Suspension was slightly more common than permanent exclusion at the youngest ages. While 22% of suspended pupils saw their first suspension before the end of Year 2, 17% of permanently excluded pupils saw their first permanent exclusion by the same age.
Overall, for both groups of pupils, around 50% saw their first suspension/exclusion before the end of Year 4, and around 50% after.
Now let’s see how many permanently excluded pupils had also been suspended. Below we plot the percentage of pupils by the number of suspensions they received before being permanently excluded for the first time.

Overall, 91% of pupils were suspended at least once before their first permanent exclusion. The average number of suspensions was between four and five. But large numbers of suspensions weren’t uncommon, with 13% of pupils being suspended ten times or more before being permanently excluded.
Characteristics of suspended/excluded pupils
We now move on to look at some of the other characteristics of suspended/excluded pupils. Below, we show a summary of attainment at Key Stage 1, and a range of other pupil characteristics[2].
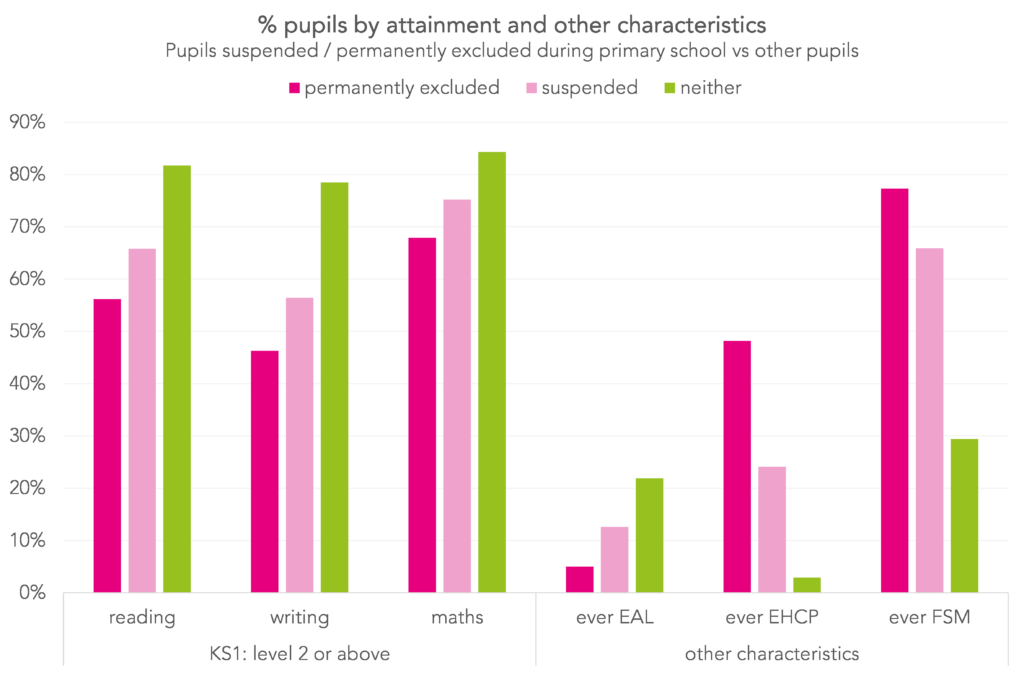
Pupils who were suspended/excluded were more likely to have low attainment, to have an education, health and care plan (EHCP), and to have been eligible for free school meals (FSM) than other pupils. They were less likely to have English as an additional language (EAL).
Those who were permanently excluded were more likely than those who were suspended to have an EHCP, and somewhat more likely to have been eligible for FSM and to have low attainment at KS1.
Matching
Now we come on to outcomes. We want to compare outcomes of those suspended/excluded during primary school and compare them to those who weren’t.
There are two reasons why this is difficult.
The first is that, as we’ve seen, pupils who were suspended/excluded are more likely than other pupils to have characteristics associated with lower outcomes. Although we can (and have, in the report) simply describe the outcomes of these three groups of pupils, we wouldn’t know how much of the difference is related to the suspension/exclusion, and how much to the other characteristics of the pupils.
We tackle this by matching each suspended/excluded pupil to a statistically similar pupil using a technique called “propensity score matching”. The characteristics we match on are as follows:
- Gender
- First language is other than English
- Proportion of terms spent eligible for FSM
- Ethnicity
- Region
- Ever looked after
- Ever in need
- Number of referrals to social services
- Highest SEND status
- Month of birth
- Number of previous suspensions
- Average absence rate
- Prior attainment
Now, when we compare outcomes of suspended/excluded pupils with their matched counterparts, we know that the difference is related to the suspension/exclusion, rather than any of the characteristics listed above.
However, we now come on to the second of our two problems. We can’t rule out that there are some unobservable characteristics that we’ve missed off our matching list, and which correlate with outcomes. For example, level of parental support. For this reason, we can’t interpret any observed differences in outcomes as causal.
Outcomes
Preamble out of the way, let’s look at some outcomes. On the left side of the plot below simply compare secondary school outcomes of suspended/excluded pupils with those who experienced neither. On the right, we show outcomes after matching, comparing those who were suspended/excluded with a matched set of pupils who weren’t, but who were otherwise similar to those who were. (Note: not all suspended/excluded pupils had a sufficiently close match in the data. These pupils are not included in the analysis, and so the outcomes of suspended/excluded pupils are not the same in both panels.)
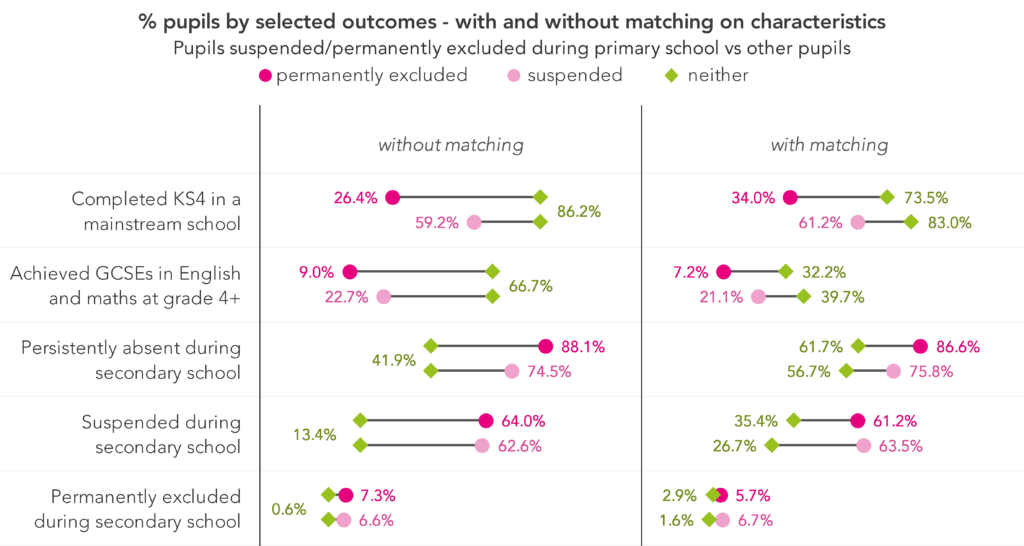
Let’s start with the unmatched case. Suspended/excluded pupils generally had much poorer outcomes than other pupils, with those permanently excluded seeing the worst outcomes. For example, only 9% of pupils who were permanently excluded went on to achieve GCSEs in English and maths at grade 4 or better, compared with 23% of those who were suspended, and 67% of those who were neither suspended nor permanently excluded.
When we look at the matched case, the difference between suspended/excluded and other pupils shrinks, but it doesn’t disappear. For example, in the unmatched case, those who were permanently excluded in primary school were around twelve times as likely as the comparison group to be permanently excluded during secondary school, but in the matched case they were around twice as likely. Similarly, before we took characteristics into account, pupils who were suspended in primary school were around a third as likely as the comparison group to achieve GCSEs in English and maths at grade 4 or better, whereas in the matched case they were around half as likely.
Summing up
Overall, and not surprisingly, pupils who were suspended or permanently excluded during primary school had worse outcomes at the end of secondary school than other pupils.
Some of this difference is related to differences in pupils’ characteristics, for example, suspended/excluded pupils being more likely than others to have spent time eligible for FSM.
However, we’ve shown that even after accounting for pupil characteristics, substantial differences in outcomes remain. We can’t claim that being suspended or excluded in primary school definitely caused poorer outcomes, but the magnitude of some of the differences even after adjusting for such a wide range of characteristics provides food for thought.

Want to stay up-to-date with the latest research from FFT Education Datalab? Sign up to Datalab’s mailing list to get notifications about new blogposts, or to receive the team’s half-termly newsletter.
[1] This is a bit of shorthand. Throughout the report we talk about cohorts of pupil who started Reception in a particular academic year, but what we actually mean is pupils who would have turned 5 years old in that year. So each cohort will contain pupils who were actually observed in Reception in the “wrong” year, e.g. because their parents elected for them to start later, as well as pupils who weren’t observed starting Reception at all, i.e. pupils who moved into the English state-funded education system in some later year.
[2] The “ever” characteristics are measured over pupils’ primary school careers.


Have you any comparison data around infant/junior against primary schools? The transition from infant to junior is tricky for child and school to manage sometimes.
Hi Robert. We don’t, unfortunately. It might be a bit tricky to spot patterns though if we did, given the small numbers of suspensions and exclusions among Year 2/3 pupils.