A test measures some underlying attribute that we cannot directly observe. It is generally referred to as ability and is a comparison of each pupil to all other pupils who have taken the same test.
In most analyses of national test data, ability will be a normally-distributed (bell-shaped) curve on a scale ranging from -4 to +4. The numbers have no meaning beyond the test being analysed.
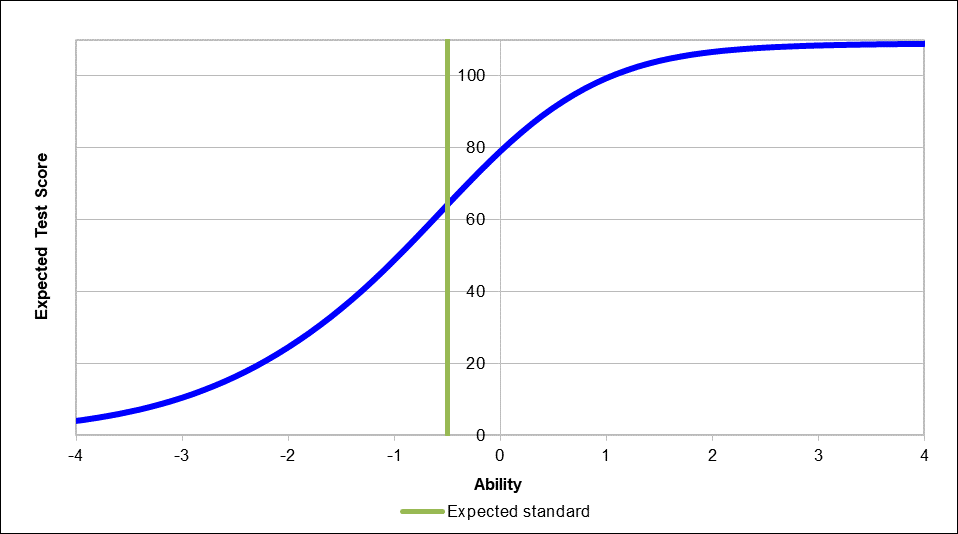
The chart below comes from the national curriculum test handbook published by the Standards and Testing Agency (STA) shortly before Christmas.
It shows the relationship between ability and expected total test score for the 2018 KS2 maths test.
Note that the expected standard is lower than average ability (76% of pupils were at the expected standard or higher).
Expected test score by ability in Key Stage 2 maths test, 2018
Alongside this, something called the test information function is presented.
This enables us to see how much information the test produces at each level of ability.
The bell-shape in the chart below, which relates to the KS2 maths test, tells us that it’s a much more informative about pupils working at around the expected standard than it is at the extremes. (Charts for the other KS2 tests have the same shape.)
In other words, it is designed to make finer-grained distinctions of pupils at or about the expected standard than it is at other parts of the distribution.
Test information function in Key Stage 2 maths test, 2018
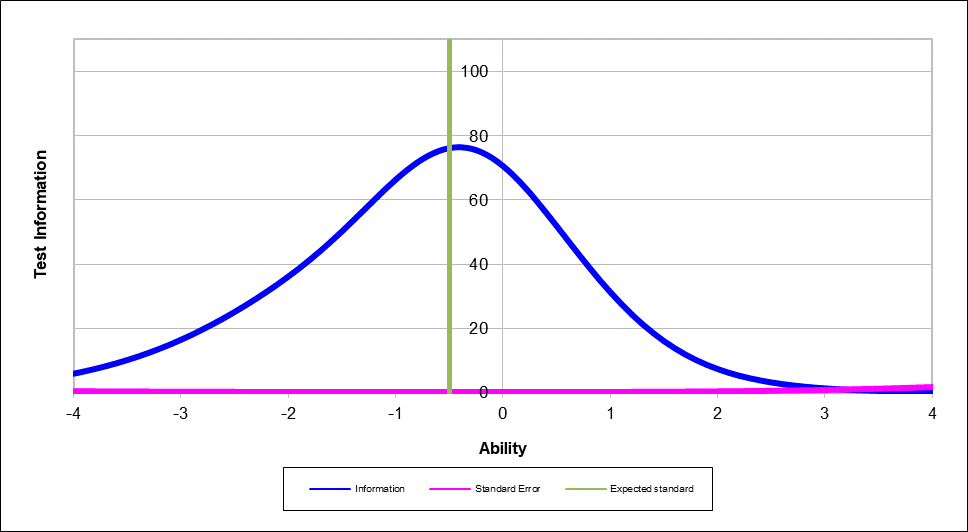
The pink line in the chart above is hard to see given the scale used. But it shows the amount of measurement error inherent in the test for each ability level and is actually U-shaped – indicating that there is more error at the extremes of the distribution. In other words, the test performs less well for pupils of very high or very low ability.
Test reliability
The STA’s handbook is a treasure trove of information about the design, development and delivery of the 2018 tests, and the technical appendix reports two key measures about each test: reliability and the standard error of measurement. The latter depends on the former.
Reliability is a measure of the extent to which the questions in a test measure the same underlying attribute or concept. It is usually represented by a statistic where 1 indicates perfect correlation and 0 means no correlation at all.
Reliability can be improved by increasing test length, although there are diminishing returns.
For the 2018 Key Stage 2 tests, reliability was at least 0.9 in all three subjects, as the table below shows. Maths, the longest test with the most items, was unsurprisingly the most reliable of the three.

Because we don’t have perfect reliability, it means that pupil ability is measured imprecisely.
In classical test theory, a pupil has a “true” score for a given test. However, unless the test has perfect reliability, it is measured with an unknown amount of error. The lower the reliability, the larger these errors will be. A pupil’s actual score could be higher or lower than the true score.
The standard error of measurement gives us an idea of how large these errors might be.
FFT Aspire
If you are a school using FFT Aspire, look at analysis of your school’s question-level analysis data now.
Not an FFT Aspire user?
This is defined in such a way that 68% of pupils will have actual marks in a test within one standard error of measurement of their true marks and over 95% of pupils will have actual marks within two standard error of measurements. So in reading, for example, the table above tells us that the actual scores of 68% of pupils were within three marks of their true score.
In fact, as the previous chart showed, the standard error of measurement will be larger at the extremes of the distribution and smaller at and around the expected standard. The STA could make these values clearer in their charts.
So the 2018 Key Stage 2 tests appear to be reliable. They are consistently measuring something. Though whether they are measuring what it is claimed they measure (e.g. how well pupils have learned the KS2 maths curriculum) is a different question.
Correct responses
Tables given in the technical appendix to the STA’s handbook also allow us to see which the most difficult questions were (or more accurately, which received the fewest correct answers).
The chart below shows the percentage of correct responses for each question in the 2018 KS2 spelling test, one of two papers forming the grammar, punctuation and spelling (GPS) test.
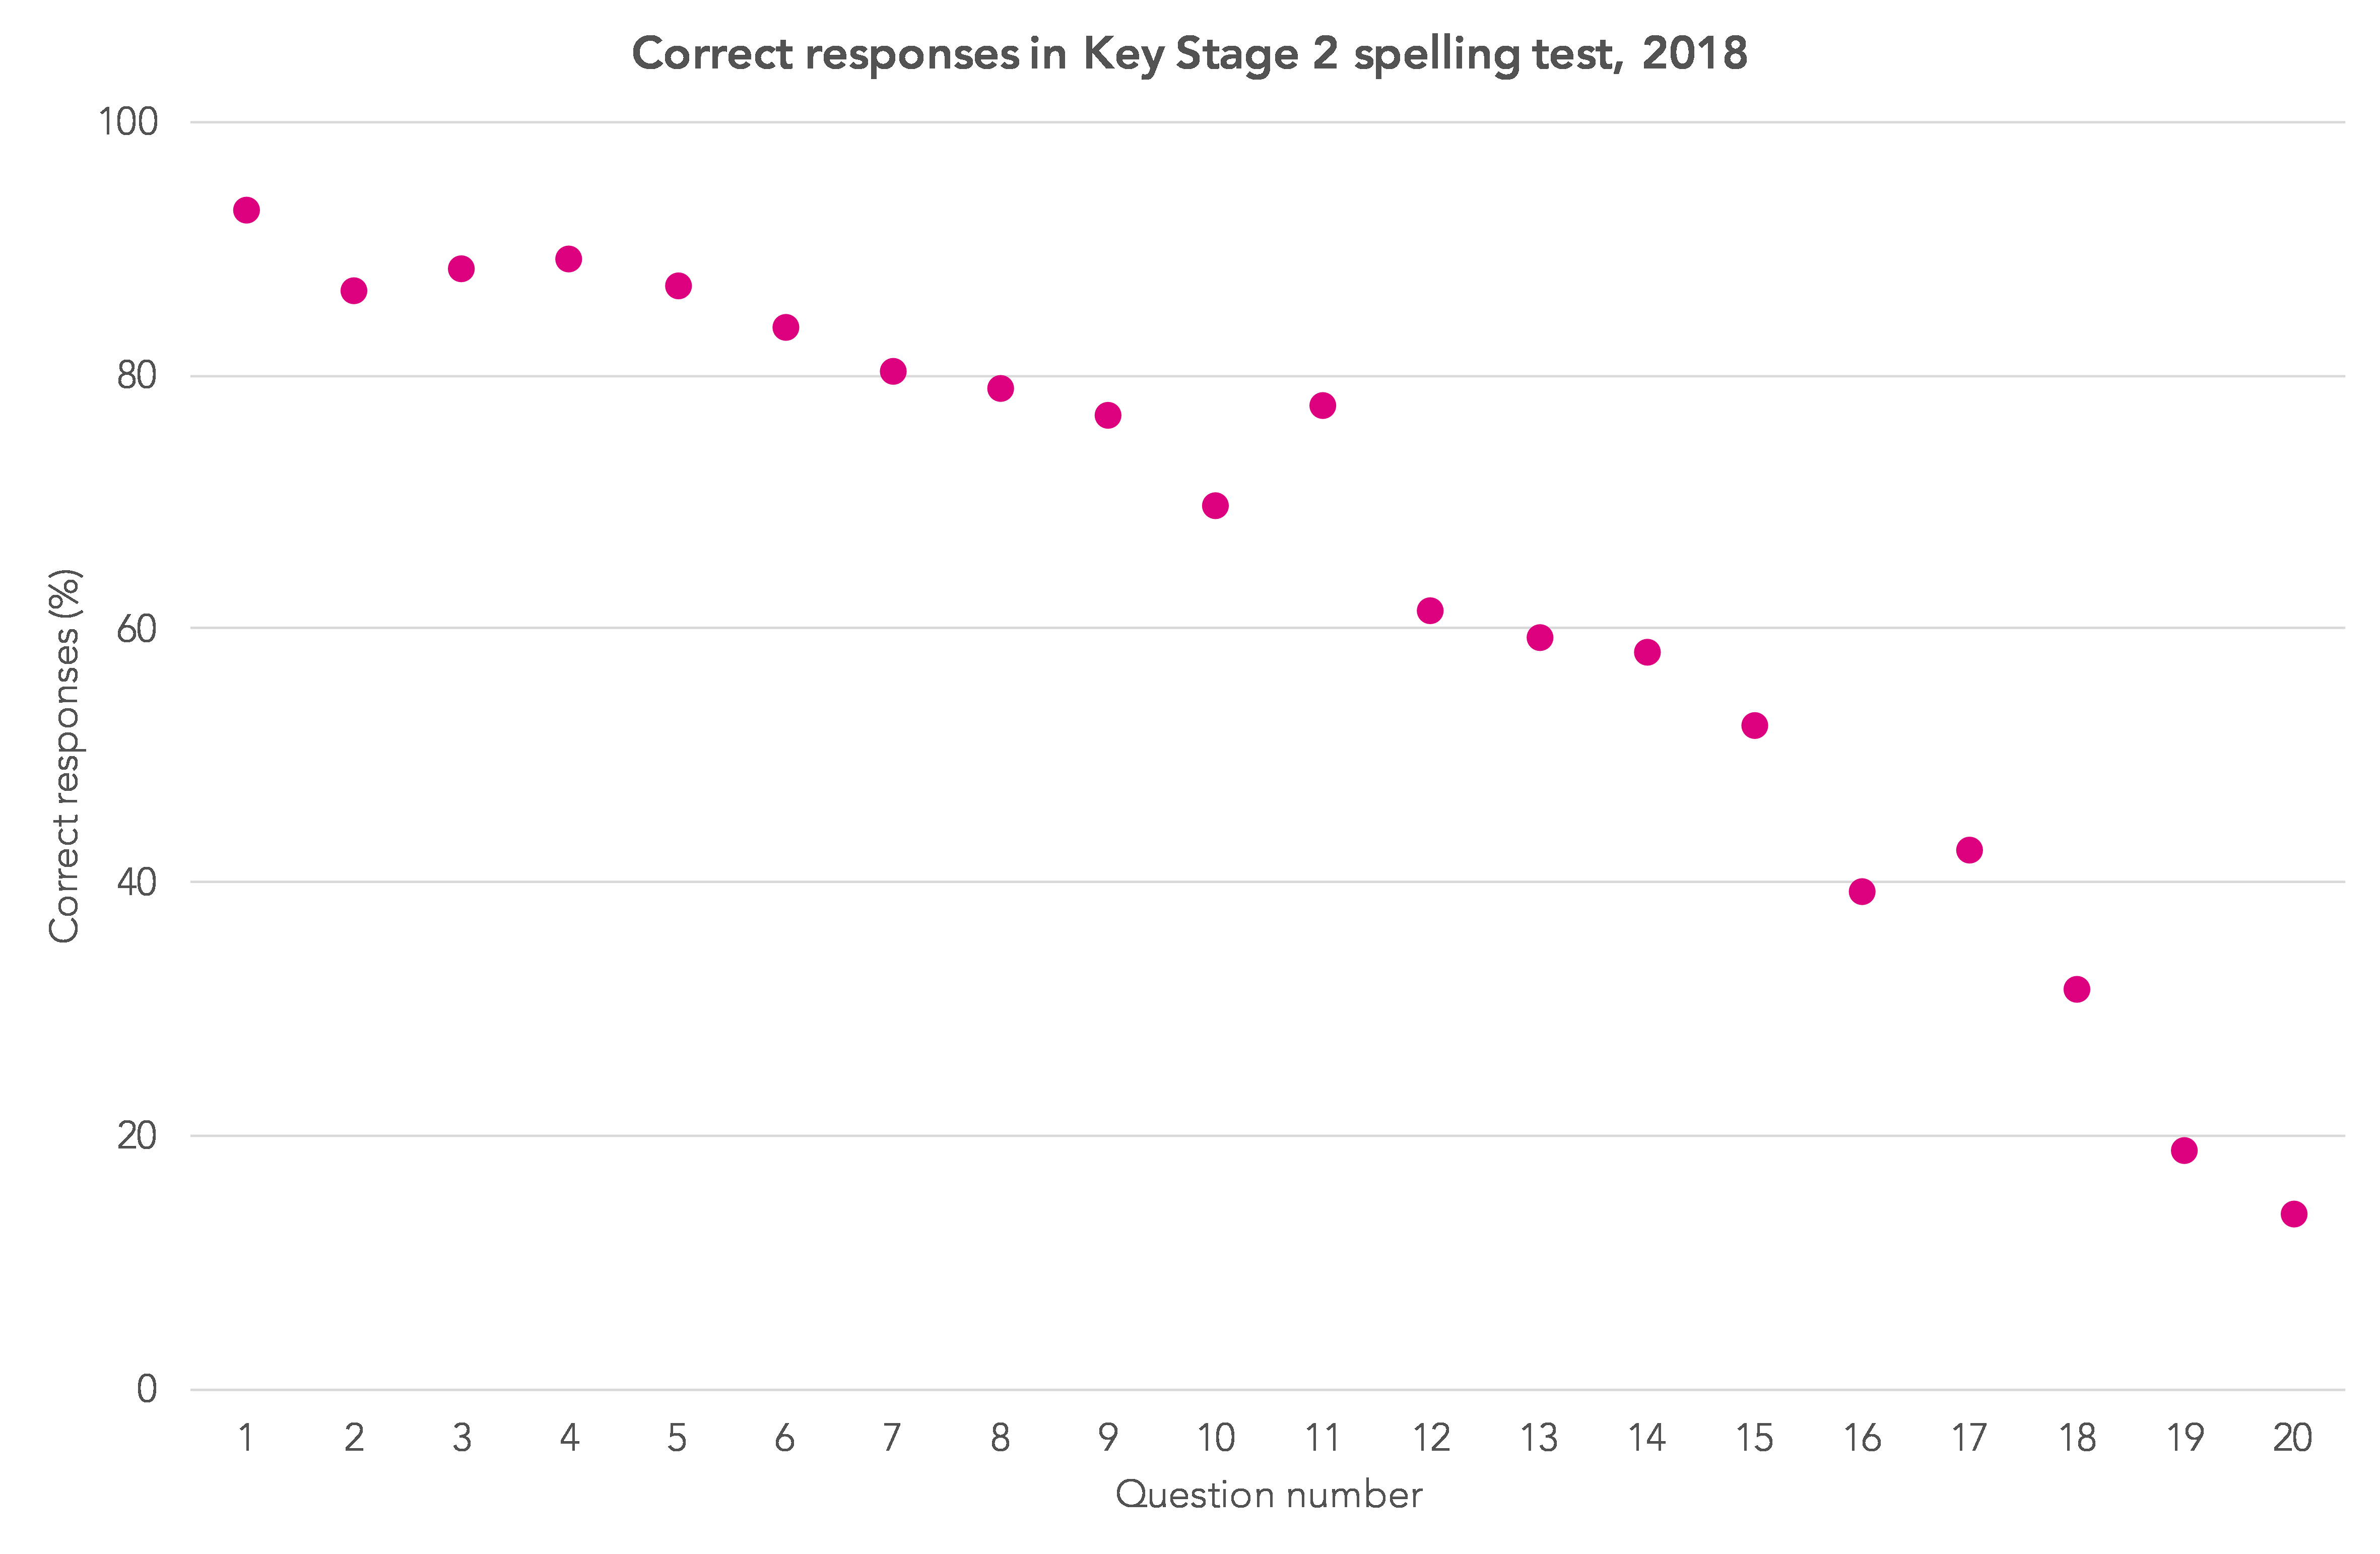
In question 20, pupils were asked to spell the word “inconceivable”. Just 13% did so. This was the lowest-scoring question across all the 2018 KS2 tests. At the other end of the scale, 93% of pupils could spell “thumb” (question one).
Difficulty and discrimination
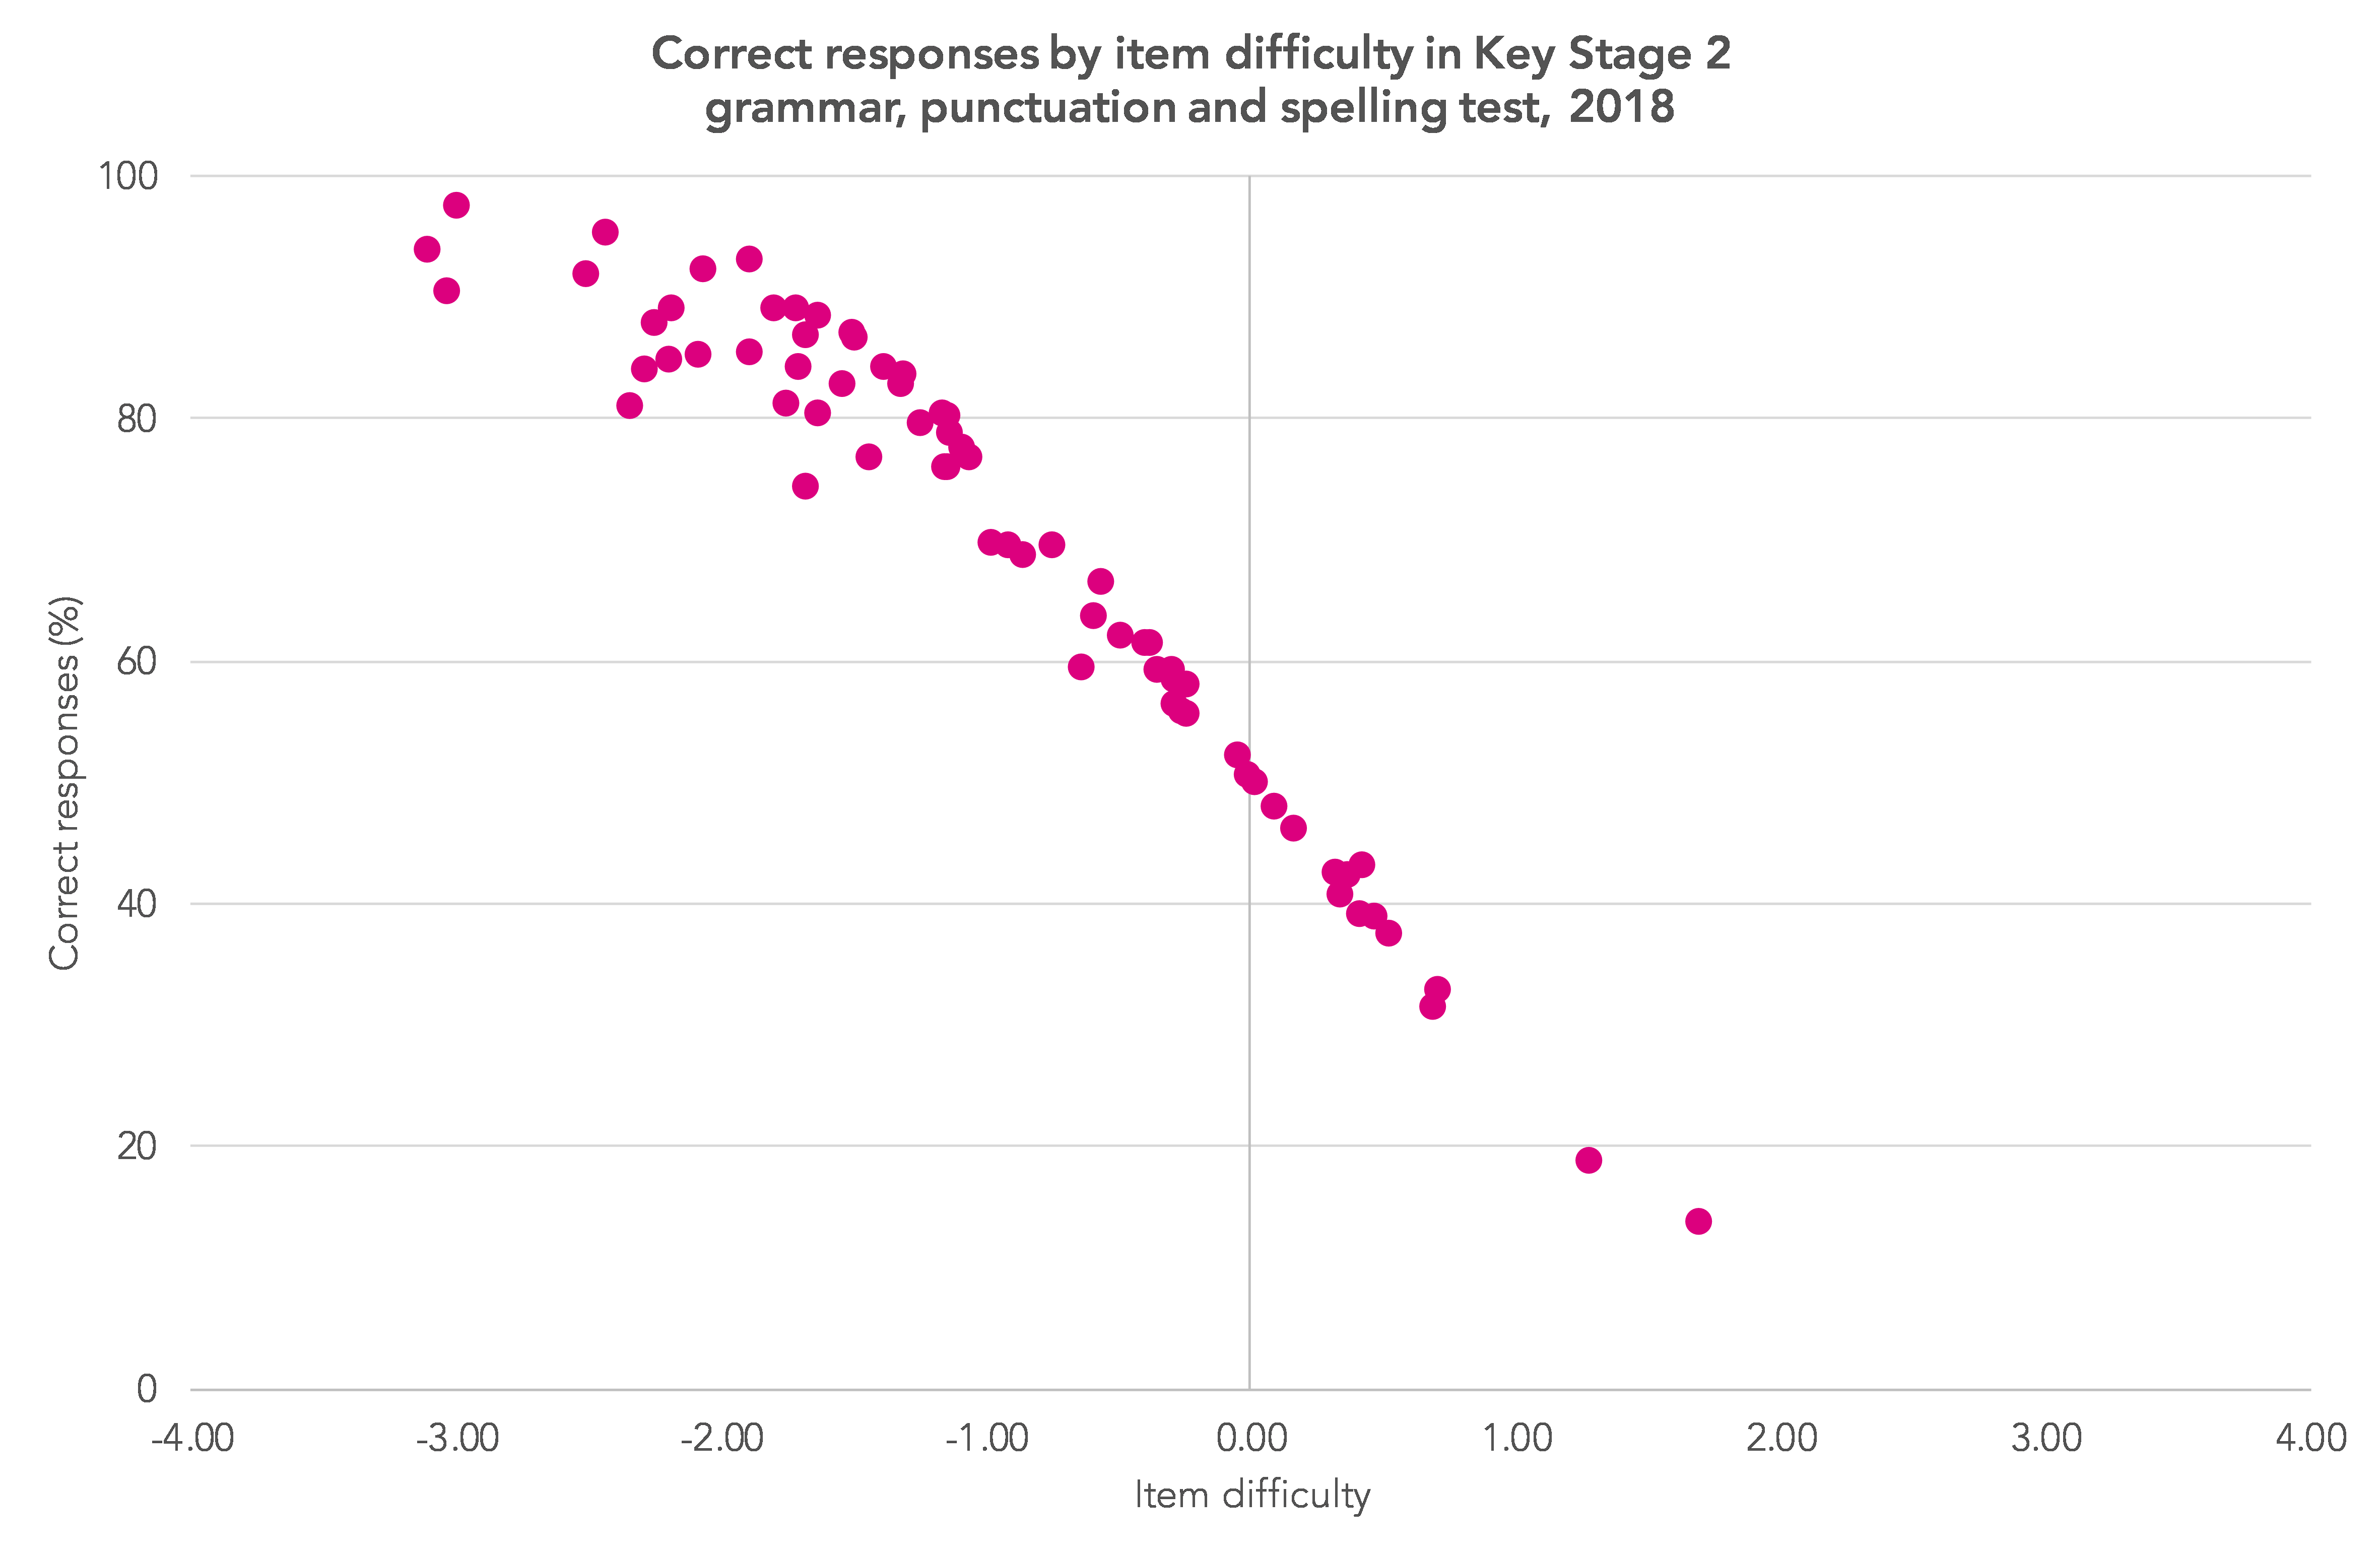
The tables also present summary statistics for difficulty and discrimination for each question.
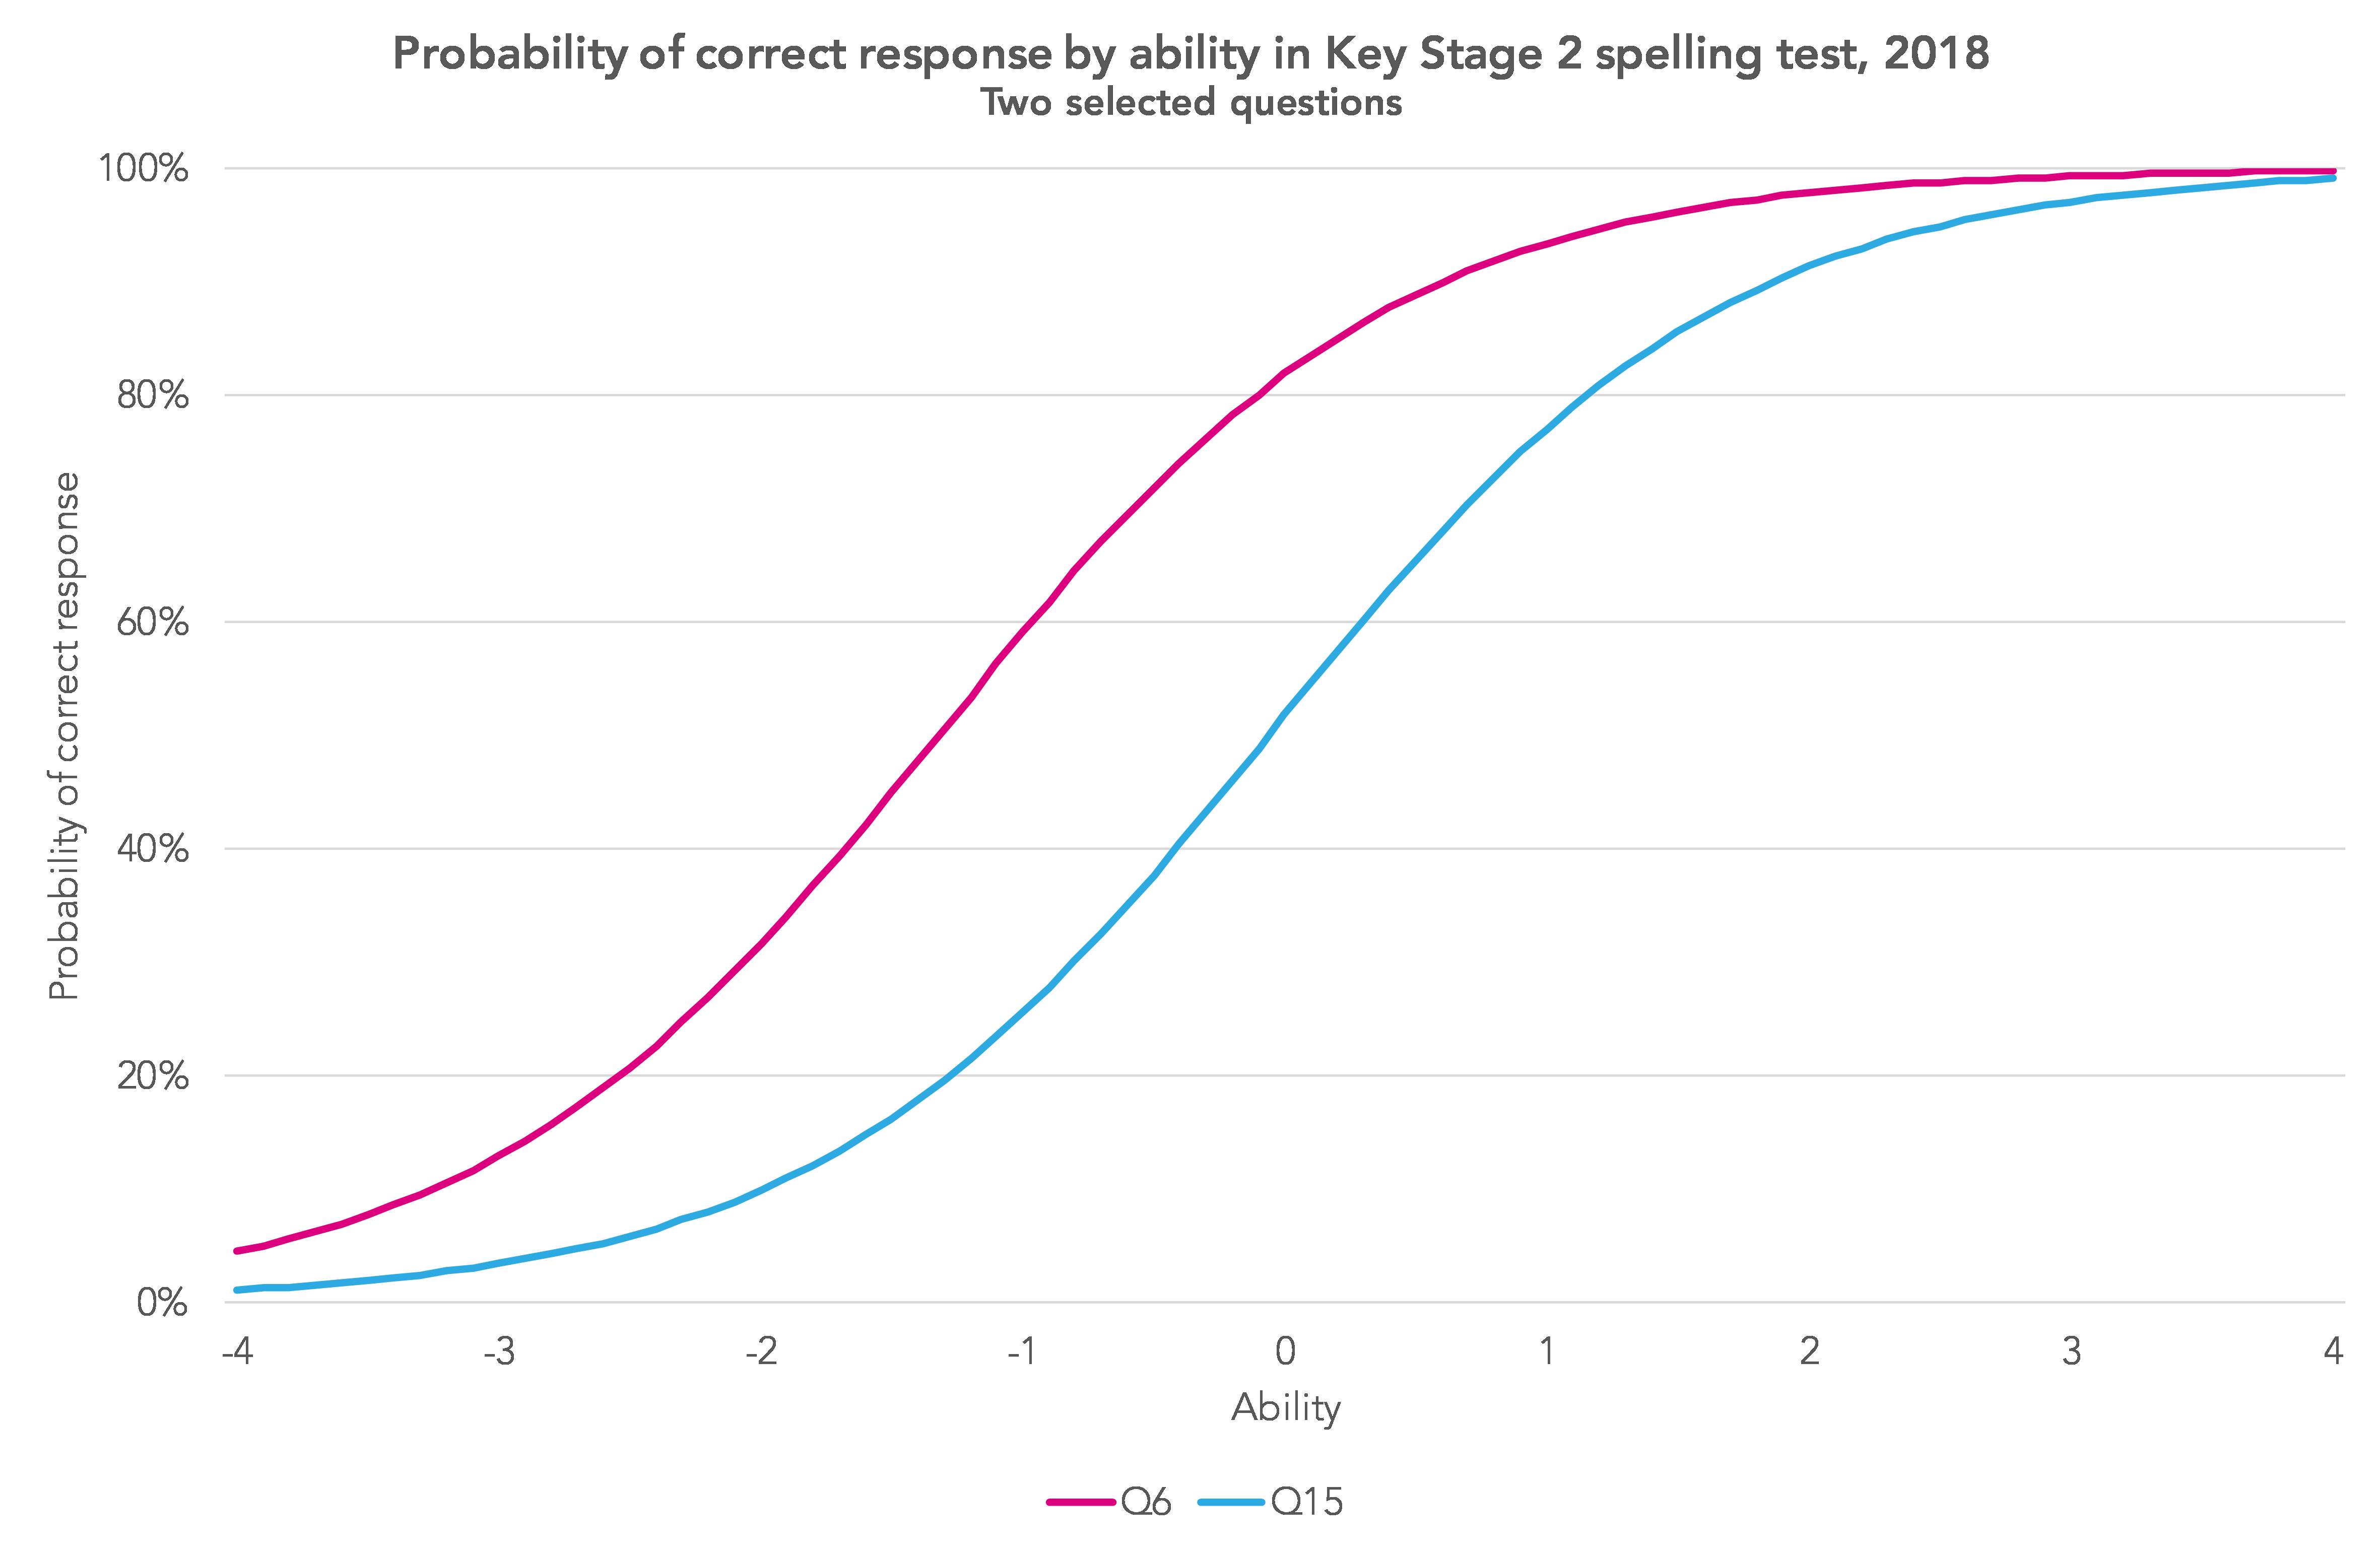
Difficulty is related to the percentage of correct responses. It is the value of the notional (-4 to +4) ability scale at which 50% of pupils answer the question correctly. The chart below shows this relationship for all 70 items in the 2018 GPS tests.
Discrimination is the extent to which an item can detect finely-grained distinctions between pupils who have similar levels of ability. The higher the value, the more discriminating it is.
The chart below shows two questions from the 2018 KS2 spelling test with identical discrimination (1.4). However, they vary in difficulty. Q15 (“essential”) discriminates well pupils of (nearly) average ability, whereas Q6 (“science”) discriminates well at a lower level of ability.
By contrast, questions 19 and 21b from maths paper 2 (reasoning) have the same level of difficulty (0.38) but Q21b offers far greater discrimination (1.19 compared to 0.41), shown by the steeper line.

In general, it’s best not to read too much into responses to questions with low discrimination. There were a few of these on the reading test, GPS paper 1 (questions) and maths paper 1 (arithmetic).
In summary
It’s great to see the STA making all of this information publicly available.
By design, most of the effort in the 2018 Key Stage 2 tests went into testing at or around the expected standard. Consequently, there is less measurement error at this part of the ability distribution and more at the extremes.
There were one or two items in the tests that did not function as well as others. This is perhaps to be expected.
That aside, and based on the measures reported, the 2018 Key Stage 2 tests appeared to be well-functioning. I’m slightly surprised that this hasn’t been publicised more widely.
Want to stay up-to-date with the latest research from FFT Education Datalab? Sign up to Datalab’s mailing list to get notifications about new blogposts, or to receive the team’s half-termly newsletter.

That was interesting – is any of this sort of thing available for GCSEs?