Updated 16th August to acknowledge other possible explanations for independent schools’ results increasing, and to add a footnote clarifying how pupil numbers have been worked out for the purposes of the moderation process.
In among the detail that Ofqual, the exams regulator, published this morning were figures that show how outcomes have changed at different centre types.
The charts below show changes in attainment from 2019 to 2020 broken down in this way, at grades A*-A, and A*-C, respectively.

The results of independent schools seem to have received a particular boost this year, specifically at grade A or above.
What explains this?
Moderation
We noted in our first post this morning that results have gone up much more in some subjects than in others.
KS5 Early Results Service
This year’s FFT Early Results Service will be more important than ever as the DfE and Ofsted will not be providing schools with any analysis of performance at KS4 and KS5.
Sign up for the Early Results Service here.
Not an FFT Aspire user?
We said that this was very likely due to some subjects typically being entered by small cohorts of students at each school or college.
With more than 15 entrants in a given subject[1], Ofqual applied a moderation process that awarded grades based on schools’ and colleges’ historical performance.
In cases where five or fewer students from a particular establishment entered a subject, the grades proposed by their teachers (centre assessment grades) were used to award results. These were typically higher than the grades that the moderation process generated.
And for between five and 15 students a combination of the two approaches was used.
The chart below compares estimates that we came up with of how frequently different subjects were entered by small cohorts, and the increases in results we saw this morning. As we thought, there is a strong relationship between the two things.

The benefit of being small
This is also what likely explains most of the boost that independent schools’ results received this morning.
Using 2019 data, for each establishment with KS5 entries we’ve worked out the number of entries that came from subjects entered by a small number of students. We’ve then aggregated these by centre type – see the charts below.[2]
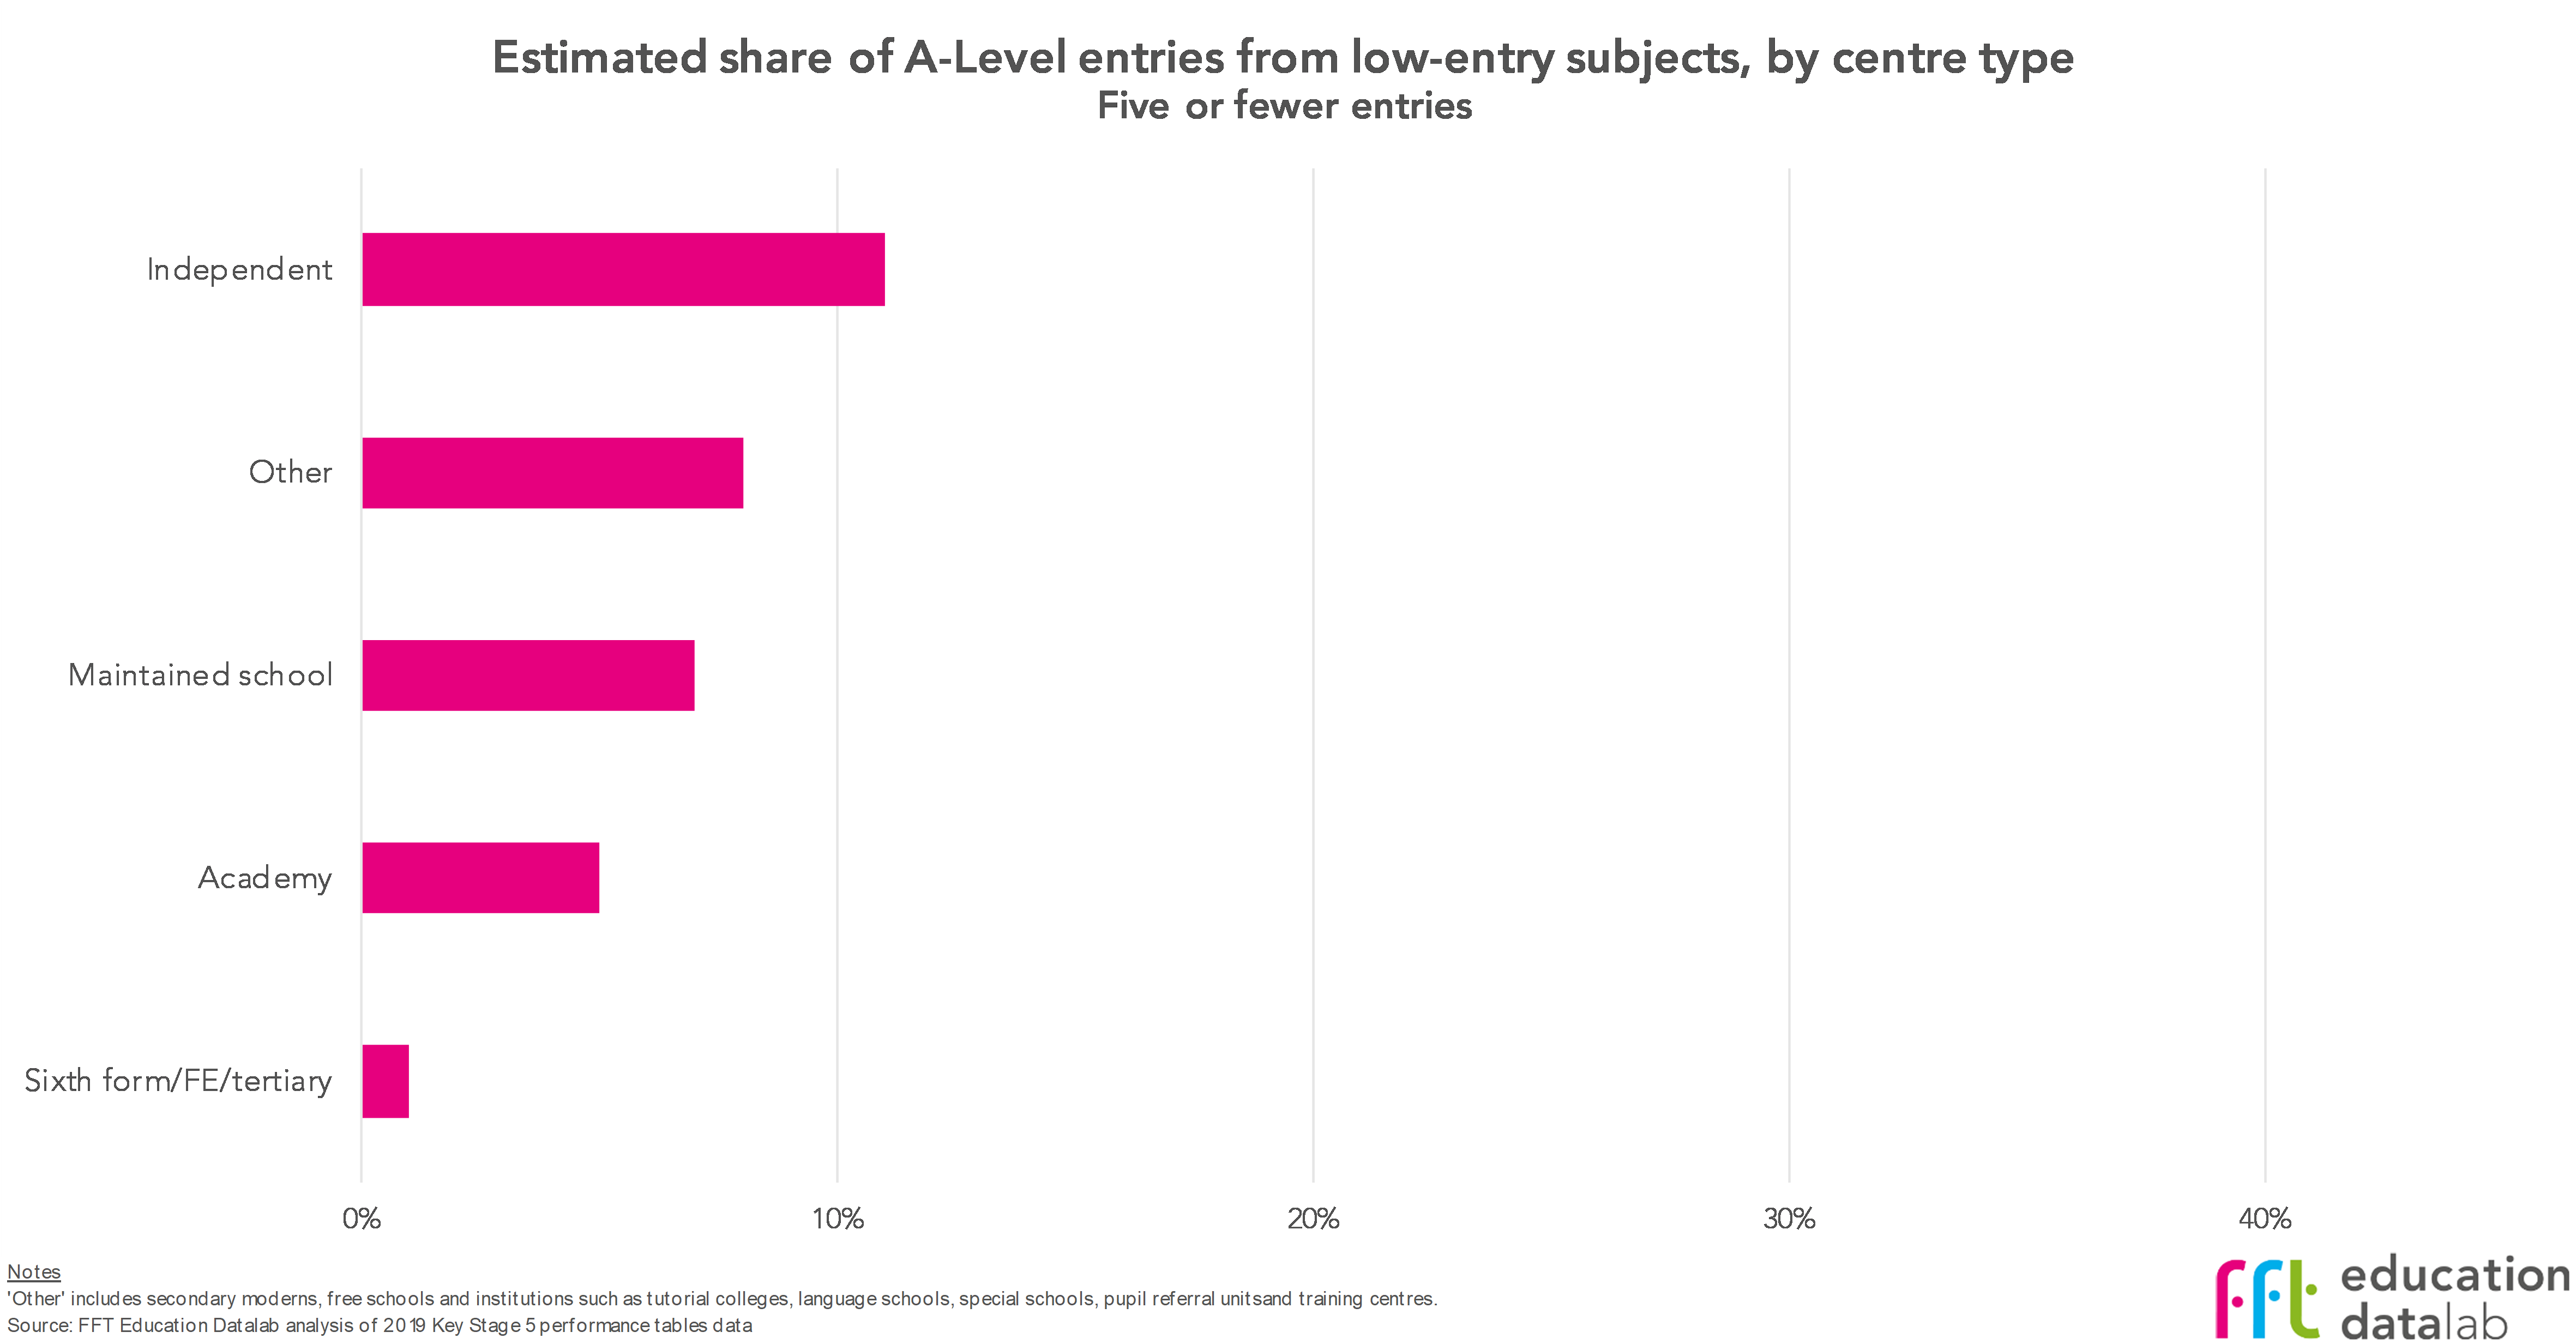

The top chart shows that approximately one-in-10 A-Level entries from independent schools was in a subject that the school entered five or fewer students in. That’s more than the comparable figure for other centre types.
And, we estimate, fully two-fifths of entries from independent schools (and maintained schools, it’s worth noting) were into subjects that the school entered 15 or fewer students in – the upper limit at which centre assessment grades ceased to be used in awarding results.[3]
Independent schools are, in general, smaller than lots of other post-16 provision. The table below shows our estimate of the average (mean) number of entries from each centre type overall, together with the average number of A-Level subjects into which they entered students in 2019.
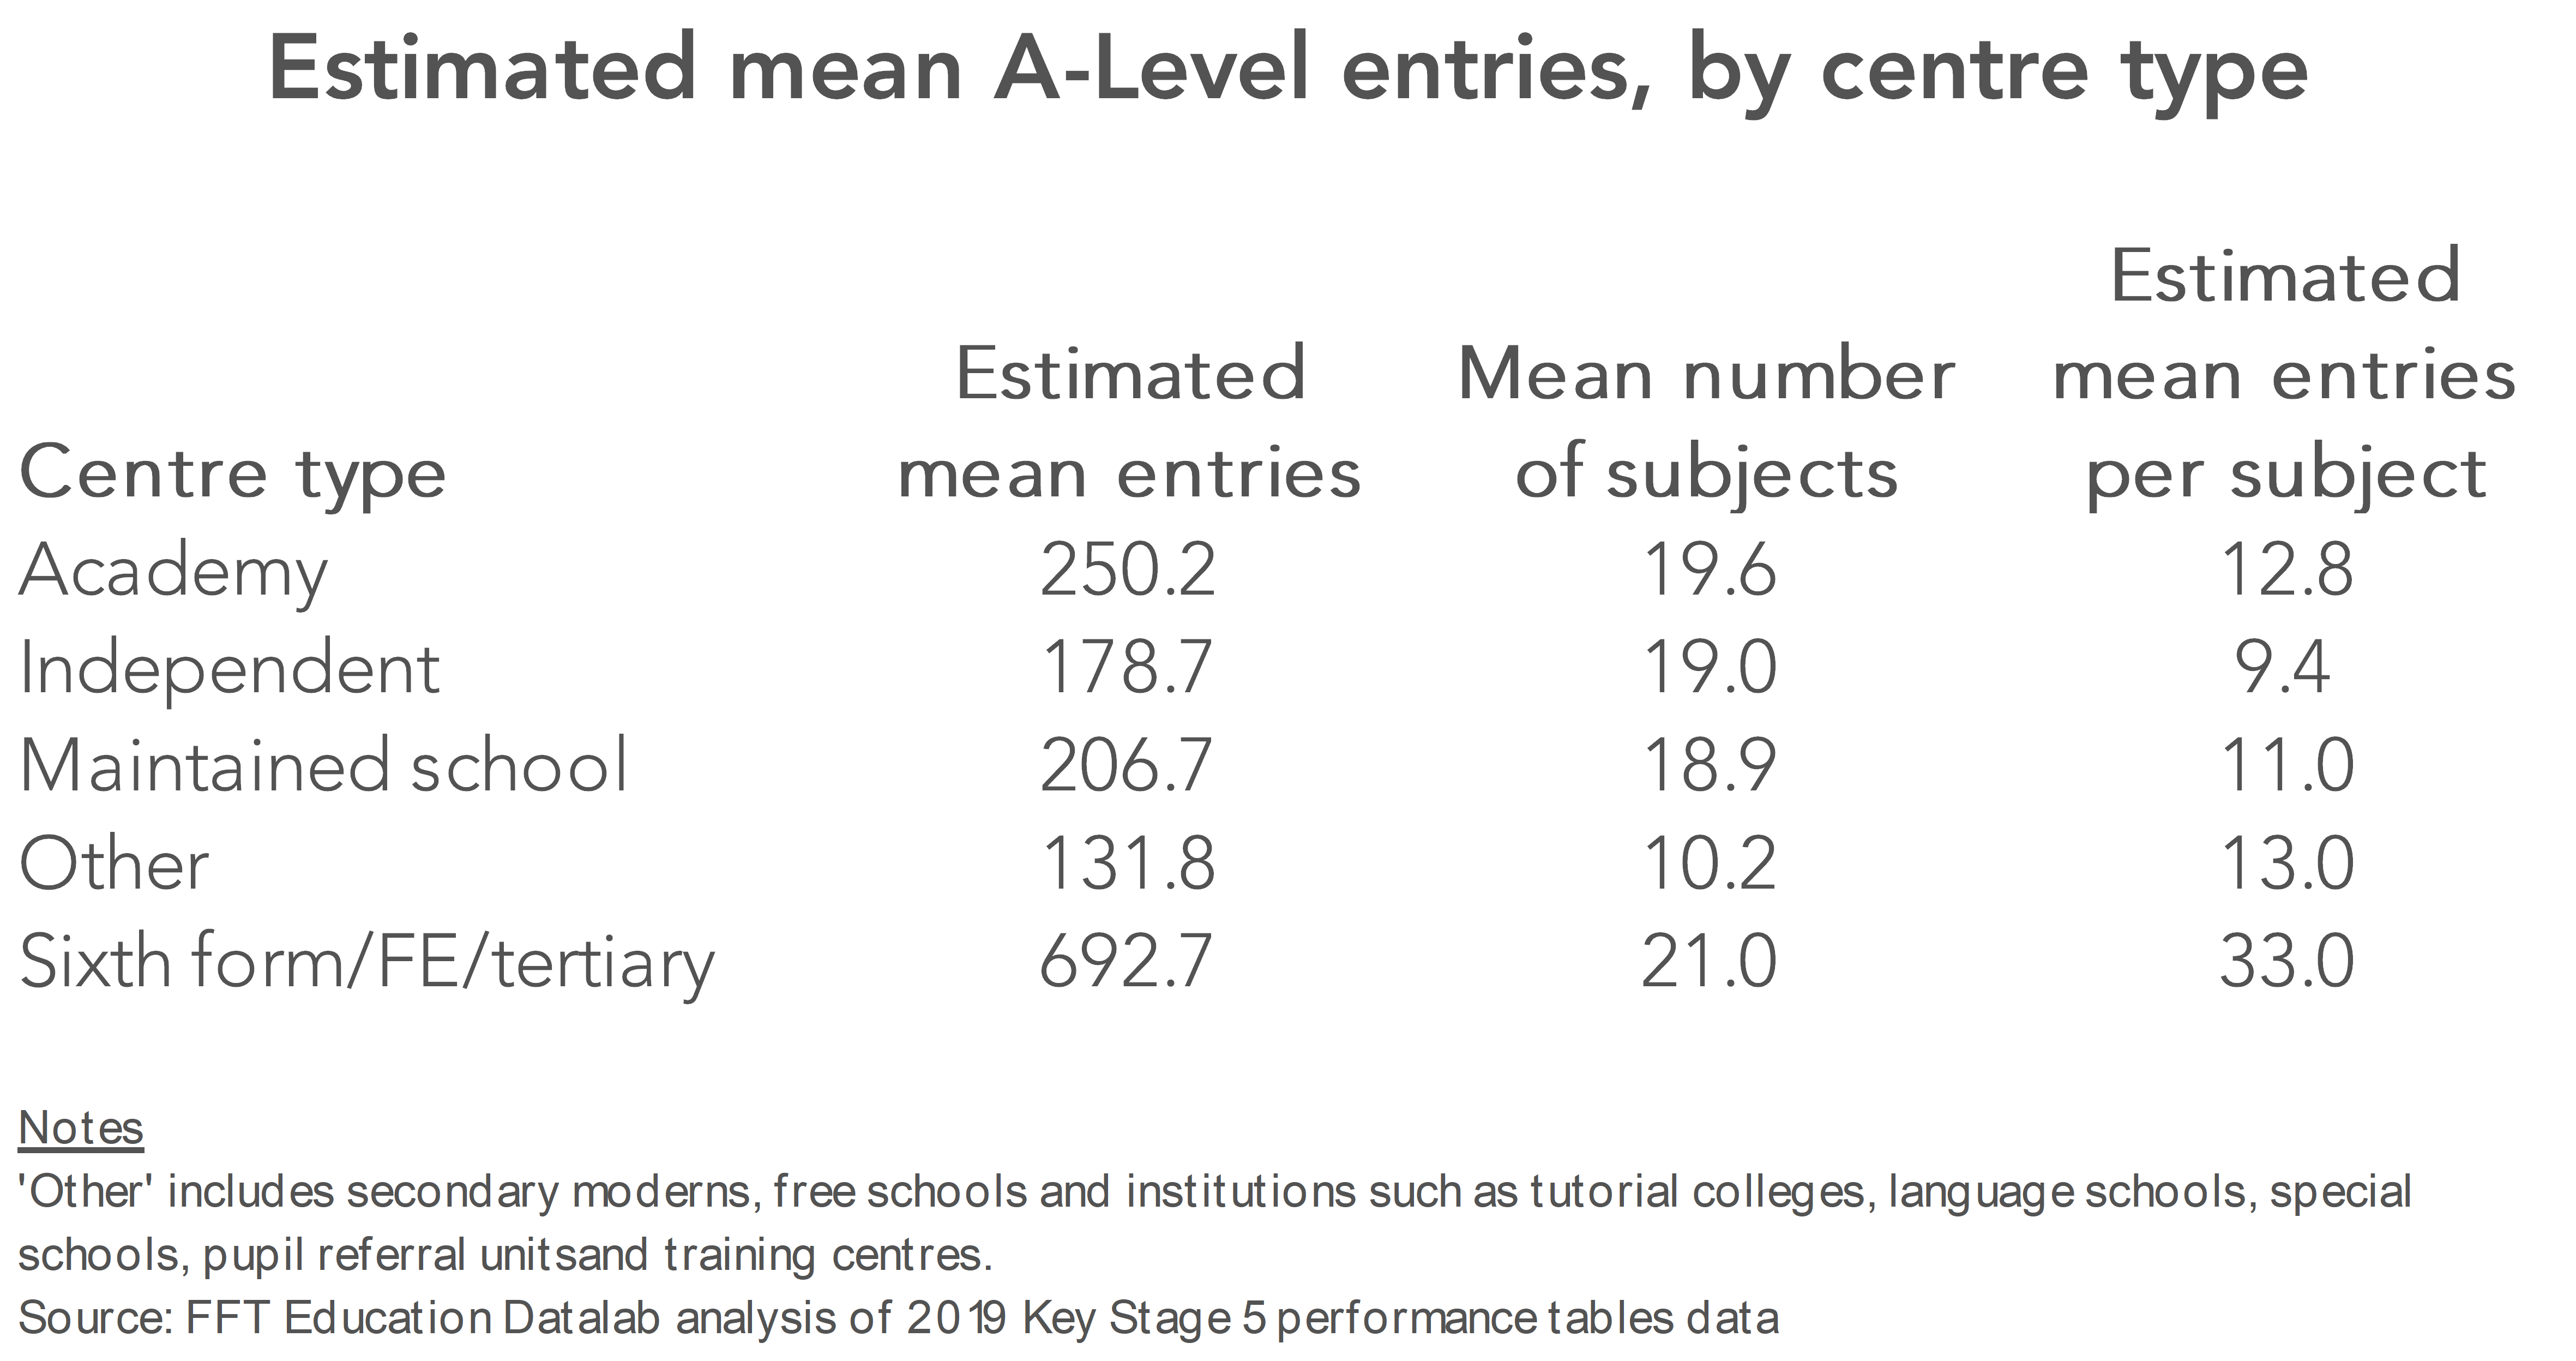
That makes the average number of entries per subject considerably lower for independent schools than for other centre types.
Some have suggested that the increase in A*-A grades at independent schools is in proportion to their share of A*-A grades in the past. In other words, if A*-A grades go up, independent schools would tend to get more of a share of them. While that is true, the A*-A grades have increased due to the inclusion of CAGs for small centres.
Results for independent schools could also have increased as a result of changes in cohort prior attainment or changes in subject entry patterns.
But our working hypothesis, at least until we see more detailed data, is that independent schools seem to have benefited from the way that grades have been awarded this year – we’ll leave it to others to argue whether it’s right that things have worked out this way.
Want to stay up-to-date with the latest research from FFT Education Datalab? Sign up to Datalab’s mailing list to get notifications about new blogposts, or to receive the team’s half-termly newsletter.
1. Ofqual uses an average of the number of pupils between 2017 to 2020 to determine whether a centre is small or very small. See this graphic for further detail.
2. Our centre type categories might not line up exactly with Ofqual’s, but they should be close enough for these purposes.
3. We would be interested to see by how much A*-A pass rates have increased in each subject in independent schools with more than 15 pupils. We perhaps wouldn’t expect to see such an increase if the moderation process has worked as intended.


Many thanks for this analysis.
Is there a potential additional issue, where the desire to prevent even more significant increases in the percentage of high grades awarded in a subject has led to the need to moderate down on larger cohorts even more harshly, as so many of the available top grades had already been assigned to the small cohorts where the CAGs were unchallenged?
There is also an issue of huge inequity within a school population. A student who happened to choose 3 A-levels with small cohorts within their school would have been awarded their CAGs, whilst an identical student who had chosen 3 more popular subjects would most likely face downward moderation in one or more of their subjects.
Hi Jon,
I’d agree with you on your second point.
On your first point, I don’t think we know definitively, but we don’t think this is how it will have worked (i.e. we don’t think that kind of additionally harsh moderation of larger cohorts will have occurred).
Do you know if iGCSEs were allowed to be considered in the prior attainment calculation? If not that will also have affected the core subjects at ALevel.
Hello. Pretty sure I read that they weren’t included.
Why are you choosing to present the change in percentage points, rather than the percentage change? This is almost identical for independent and state comprehensive (10.8% v 10.1%), and the difference in base rate of A*/A grades is surely the obvious explanation for the percentage point change discrepancy.
Hi David. I think percentage point is the more meaningful metric to use – and I’m afraid I don’t agree that the different base rate is the most obvious explanation for the percentage point change discrepancy.
I’m wondering if the massive discrepancy in Music could have had a detrimental effect on students in a large group? My daughter was in a class of 12 in a large comprehensive 6th form college, and received a B, having done a good performance at the higher level, receiving close to full marks for her composition, and an A in the written mock. If there are a significant number of students in groups of three or fewer, would that mean that the algorithm had an excessive effect on larger cohorts or it that not how it works?
Hi Deirdre. It doesn’t look like it has because results in music have gone up a larger amount than other subjects. I think this is the effect of allowing CAGs for small cohorts and applying moderation to larger cohorts. But I can’t be 100% certain.
OK, thank you very much for getting back to me. Just trying to understand the context of a disappointing result and by the sound of it, it’s comparatively even more devalued if the percentage of higher grades has actually increased.
The main unfairness in the system appears to be awarding the CAGs where the average number of candidates at a centre was 5 or fewer and then using a tapered approach for 5 – 15. Would you like to comment on the effect of awarding CAGs to the top 5 ranked candidates in each subject at each centre and then applying a taper to candidates 6 – 15? This would remove the bias which has worked in favour of independent schools. How would that affect the distribution of grades?
Hi Robert, interesting suggestion – I’ve not heard that from others. I don’t think there’s a way of easily knowing what it’s impact would have been. I suppose that while it might lessen concerns about the state/independent disparity, some might be unhappy with those at the top end of the attainment distribution being treated differently.
HI Philip/Dave,
I also would be interested what your comments would be to the previous post by Robert Simons.
Out of interest why do you think ‘other’ centres have also seen at rise at a >A and >C despite having the same mean entry per subject as academies?
That struck me as interesting, and I don’t have a great explanation. Results just generally more variable due to the centres in that category (free schools, tutorial colleges)?
Yes, I’m sure you’re right that the % of students awarded A level top grades for low-number entries from the different school categories are as you report.
But the respective total A level cohort sizes are vastly different – my estimate is around 100K independent schools, around 600K the rest.
So if about 10% of rich kids are ‘small cohort winners’, that’s around, say, 10K.
For the poor kids, the % is smaller – and taking a guess from the relevant chart, say, around 7%. So the number of ‘poor kids’ who have ‘won’ is around 42K.
So in absolute terms, maybe 4 x as many ‘poor kids’ have won as compared to ‘rich kids’.
Does that spin a different narrative?
Surely the underlying point is that “big schools have big cohorts” – perhaps influencing government policy to build smaller schools. And let’s not muddle ‘set size’ (the unit within which I am taught) and ‘cohort size’ (the number of students entered in that subject for the centre). So the Further Maths students at the posh school might all receive individual tuition from a winner of the Fields Medal, but the cohort is still 25; ‘Bogstandard Comp’ might have just 3 students out of their school’s 1500 young people doing Further Maths and taught by the cricket coach – but they are nonetheless a ‘small cohort’.
Also the win/lose narrative makes the huge assumption that “All CAGs for all small cohort entries are over-the-top”.
Is there any evidence for this?
So suppose – ludicrously of course, but simply to make my point – that every independent school submitted CAGs that were true, honest and fair. The students were originally, when the model was being used, awarded the grades they deserved, as confirmed now that the model has been binned.
In contrast, those lazy state school teachers just submitted A*s for everyone, thinking that the model would sort it all out. They must have been surprised when they discovered that the model no longer applied and that their over-the-top CAGs get through unchallenged; ever more so now when they find they have got away scot-free for their large cohorts too.
That story, as told, is of course nuts. But my point isn’t.
I think we need a really good forensic analysis of the whole data set, looking for patterns, identifying the plausible, nailing the fraudsters – albeit after the event.
Hi Dennis, thanks for your comment.
There is a strong need for a forensic analysis of things in the months to come, when we’ll be able to drill into things in a much more detailed way, seeing how they results differed by establishment size, and taking pupil characteristics into account. (One limitation I can foresee is that we might never see the moderated/algorithmically generated results for pupils in the data that is subsequently made available, only the final grades. Ideally we’d want to see both.)
As we say in the post, this is conjecture – we think a combination of small pupil numbers and high CAGs is the most likely explanation. But, as you say, we don’t know for sure what CAGs were like at independent schools with small cohorts. We are making the assumption that independent schools’ CAGs followed the general pattern of having been generous, and that that was true where there were small cohorts.
So plenty for us all to dig into over the coming months.
hi again – might you also be publishing the GCSE numbers, please?:
Hi Dennis. Do you mean estimates of how many pupils were in small classes in independent schools? (I.e. equivalents of the final two charts in this post.) Thanks
Hi Philip – thank you, yes – whatever 15 analyses (by school type, by subject…) that you might have.
Thank you
Dennis
By school type, I got the following figures for the share of entries from cohorts with 15 or fewer pupils (I didn’t break out state as in the above analysis):
Independent: 15%
State: 2%
As we’d probably have expected, effectively 0% of entries come from cohorts with five or fewer pupils, either in state or independent.
These were the 10 subjects that seemed to have the highest share of entries coming from cohorts made up of 15 or fewer pupils at GCSE:
Music: 42%
Art & Design (Textiles): 39%
Latin: 21%
D&T Food Technology: 16%
Drama & Theatre Studies: 15%
Computer Studies/Computing: 9%
Statistics: 9%
Art & Design (Photography): 8%
German: 8%
Design & Technology: 6%
Should the 5 and 15 sample sets be put in context to their impact on the subjects that most pupils study or does results in more niche subjects impact on the core subjects?
Ah! I’ve just seen your GCSE blog https://ffteducationdatalab.org.uk/2020/08/gcse-results-2020-what-will-this-years-results-show/. Thank you!
Just wondering if these grades include the results for Pre-U examinations which thousands of the privately educated take instead of A-levels. If not, where can Pre-U results be found (none on their website!)?
Hi Bernie. These figures don’t include the Pre-U. I take it you’re referring to this page, where 2020 results indeed don’t appear to have been published: https://www.cambridgeinternational.org/programmes-and-qualifications/cambridge-advanced/cambridge-pre-u/results-statistics/. I’m afraid it’s not something I know anything more about, though.