Last term we wrote about how February’s teacher strikes impacted pupil attendance. We found that secondary pupils were more affected than primary, and that secondary schools might have prioritised the attendance of Year 11 pupils.
We now turn our attention to last week’s teacher strikes.
A few things are different this time. Firstly, we’ve had two days of strike action rather than one. This might have impacted attendance on the “normal” school day in between. And secondly, February’s strikes took place on the same day as lots of other walk-outs, including from public transport workers. This might have impacted schools’ decisions to close.
As usual, the data we’ll use is from our 10,000 Attendance Tracker schools. We’ll show the number of pupils marked as “present” in registers which, aside from pupils who were physically in the building, includes those educated off-site (code “B”) as well as those on school trips or work experience[1].
Attendance on strike days vs the rest of the week
First, let’s look at percentage attendance in primary and secondary schools on each day last week.
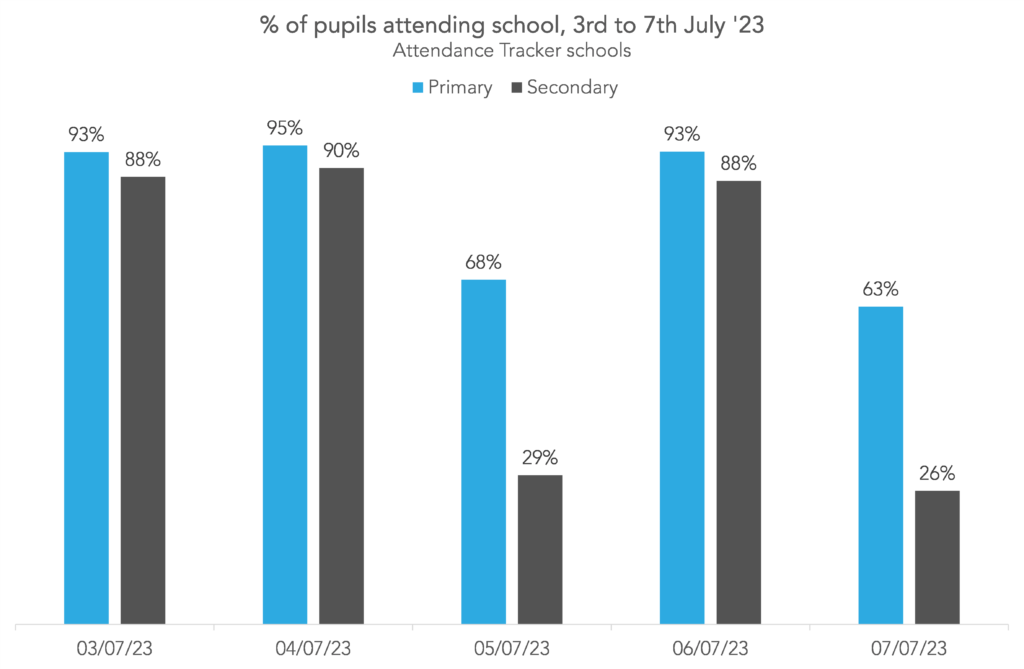
The impact of the two strike days is clear, particularly for secondary schools. On Monday, Tuesday and Thursday, around 94% of primary and 90% of secondary pupils attended school. On Wednesday and Friday, around 65% of primary and 27% of secondary pupils attended. Attendance was slightly lower on Friday than Wednesday.
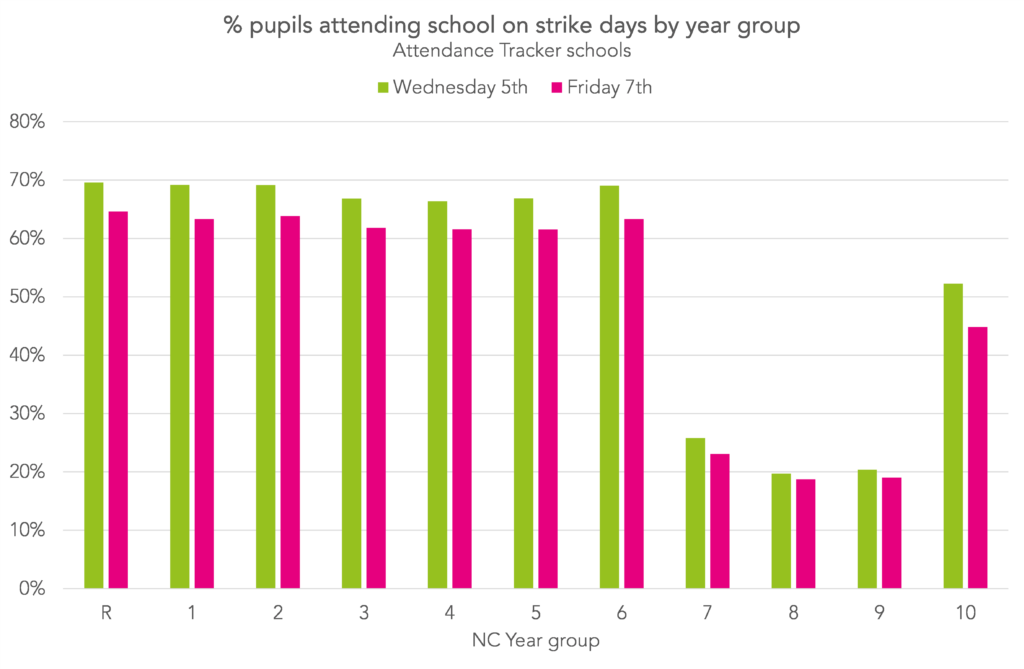
Looking at attendance on Wednesday and Friday by year group, we see little difference for primary-age pupils – all year groups had attendance of between 66% and 69% on Wednesday and 63% to 65% on Friday. At secondary, however, attendance among Year 10 pupils was around twice that of the next highest attending year group, Year 7, with Years 8 and 9 having the lowest attendance.
Attendance on Thursday vs other Thursdays
At first glance, Thursday’s attendance seems not to have been affected by the strike days either side. To check, let’s plot absence last Thursday alongside recent Thursdays.
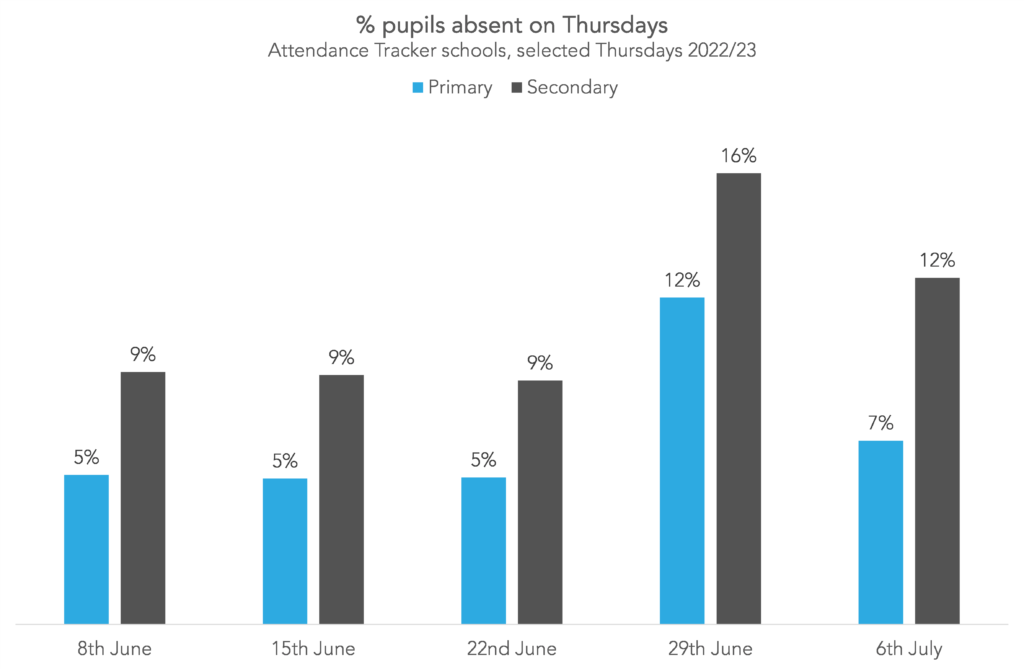
Comparing last Thursday with 8th June, 15th June and 22nd June, we see a small increase in absence – two percentage points at primary and three at secondary. Compared with Thursday 29th June, Eid, absence was around four or five percentage points lower.
So absence on Thursday was perhaps slightly higher than we might have expected, but not as high as we might have feared (and not as high as the day of a major religious festival).
Pupils off all week
One of the possible outcomes of staging strikes on two days in a week close to the summer holidays is a big increase in pupils off for the whole week. To investigate this, we plot the percentage of pupils who missed the full week, alongside the same figure in recent weeks. We break this down by disadvantage. First, primary:
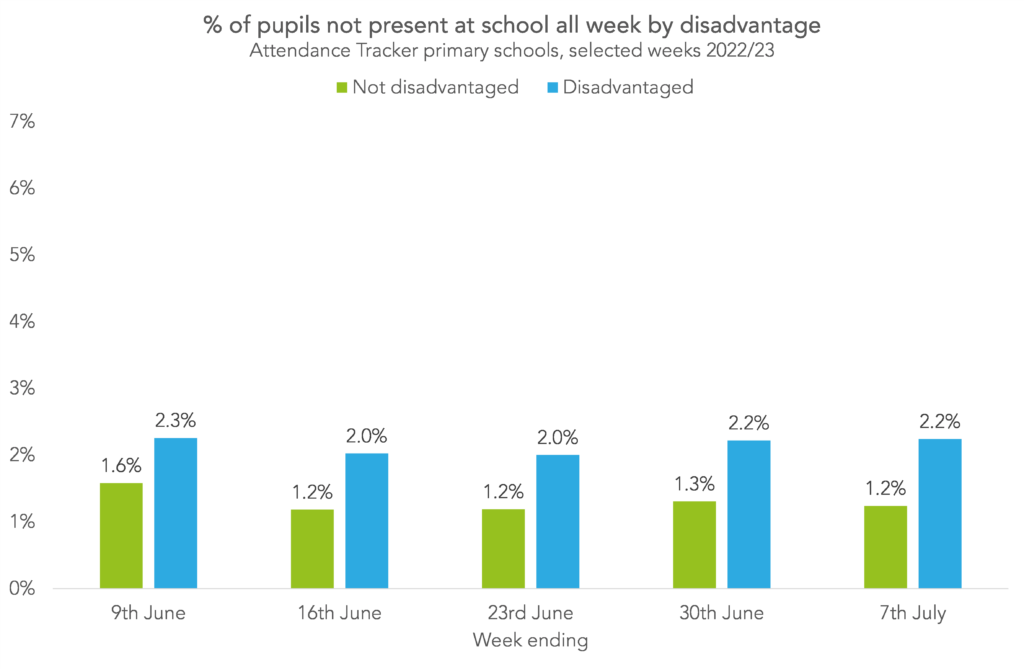
The proportion of pupils who missed every day last week is no higher than the proportion who missed a full week in any of the preceding four weeks. This is true both for disadvantaged and not disadvantaged pupils.
Now, secondary:
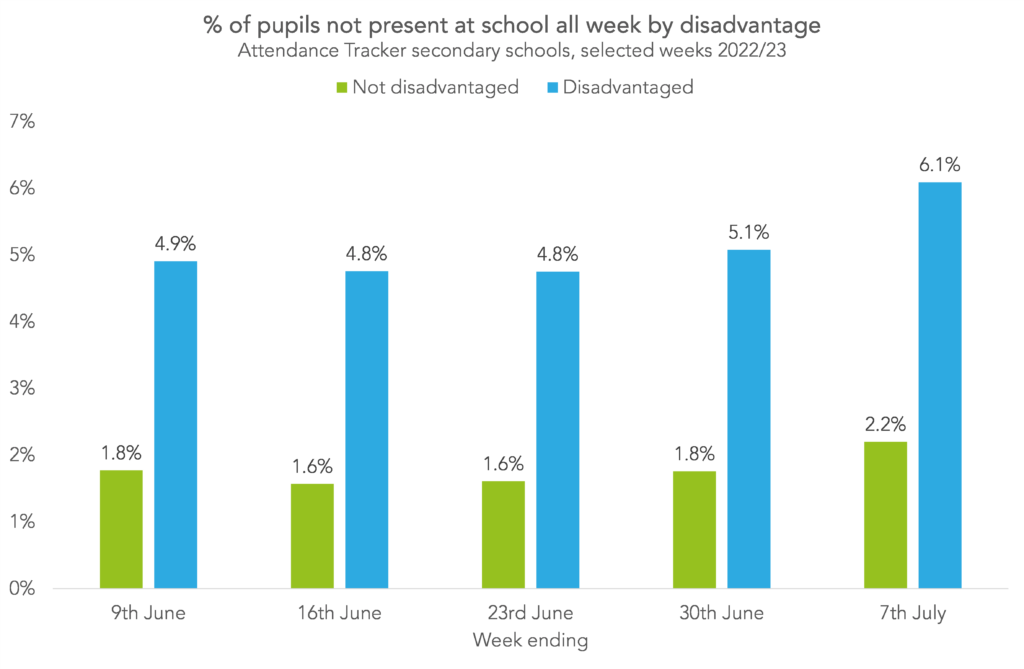
The picture here is different. The proportion of pupils missing the full week increased by around a fifth compared with recent weeks. For disadvantaged pupils, this was an increase of one percentage point, and for non-disadvantaged pupils an increase of 0.4 percentage points.
School closures by region
Finally, we look at what proportion of schools seemed to be closed on each of the strike days. To approximate this, we count schools as:
- Fully closed: no year group had 50% or more of pupils marked as “present”
- Partially closed: some year groups had 50% or more of pupils marked as “present”, but some did not
- Fully open: all year groups had 50% or more of pupils marked as “present”
We’ll show the data by region. First, primary:
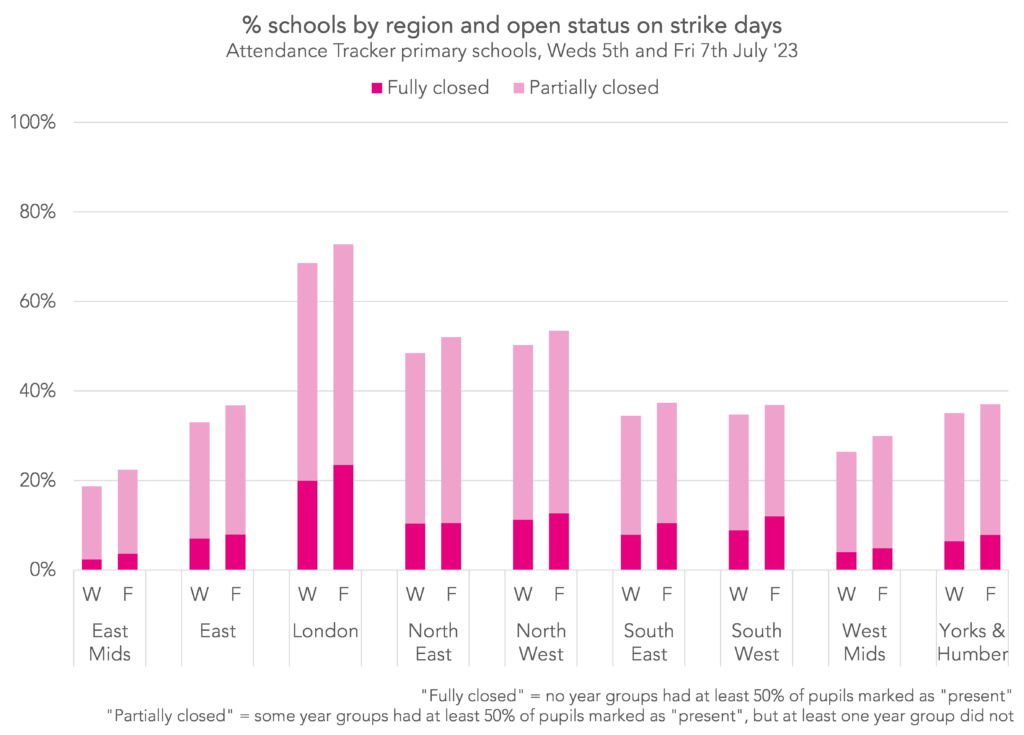
Overall, around 9% of primary schools seemed to be fully closed, with a further 30% partially closed. There were slightly more closures on Friday than Wednesday.
London had the highest rates of closure, with just over 20% of schools fully closed and 50% partially. The East Midlands had the lowest rates, with 2% of schools fully closed on Wednesday and 4% on Friday, and 16% partially closed on Wednesday and 19% on Friday.
Moving on to secondary:
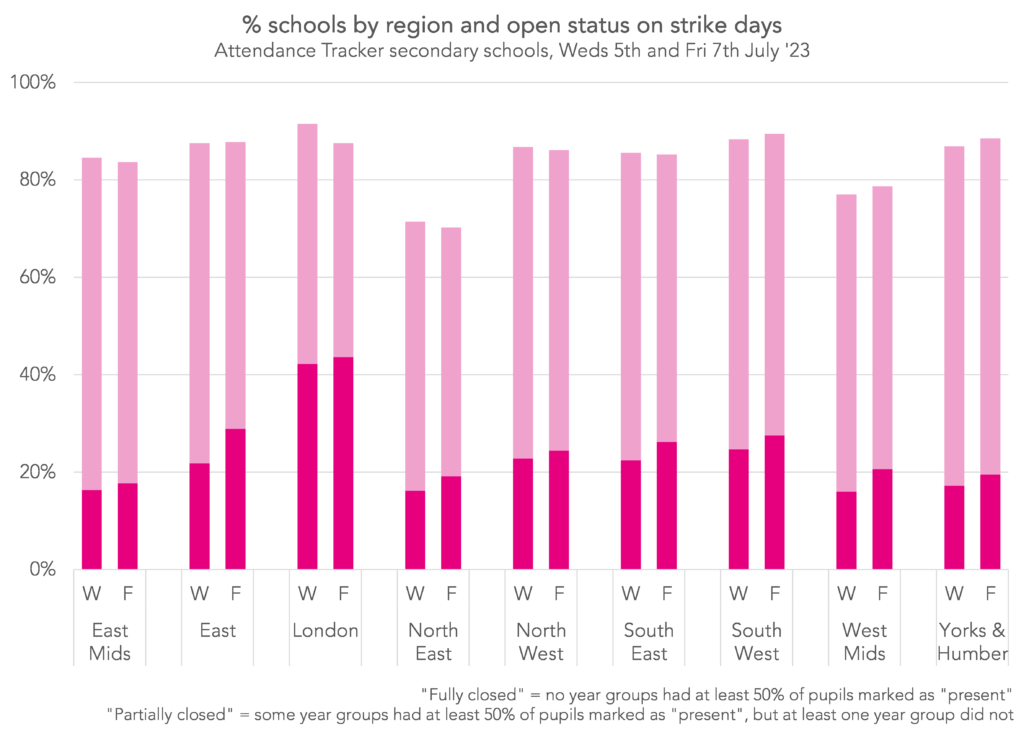
Rates of closure were much higher at secondary than primary. Overall, around 25% of secondary schools seemed to be fully closed and a further 60% partially closed. As with primary, London had the most school closures, with around 90% either fully or partially closed.
Aspire Attendance Tracker
Schools can track, analyse and compare their attendance data against 1,000s of other FFT schools using Aspire Attendance Tracker.
Log in to Aspire to access Attendance Tracker – log in here.
Not an FFT Aspire user? Learn more here.
- As there’s a bit of uncertainty over which register codes schools use to indicate closures due to strikes, we checked that there weren’t an unusual number of pupils marked with these codes on those days. We found that on the Tuesday of the strike week, pupils who were marked as “present” but not physically attending added around six percentage points to the attendance figure, and on the Wednesday and Thursday around five percentage points. So we’re happy to use “% present” as a proxy for % attendance in this post.
Want to stay up-to-date with the latest research from FFT Education Datalab? Sign up to Datalab’s mailing list to get notifications about new blogposts, or to receive the team’s half-termly newsletter.


Leave A Comment