Last Wednesday saw strikes across a number of areas of the public sector, among them: schools.
By the end of the week, the DfE had published (pdf) an initial analysis of the impact of the strikes in England, showing that around 44% of schools remained “fully open,” 9% “fully closed” and 43% “open but restricting attendance”.
Using data from Attendance Tracker[1], we can dig into these figures in a bit more detail to look at the impact on pupil attendance.
Pupil attendance by year group
Firstly, we look at the percentage of pupils who were marked as “present” on Wednesday last week compared with other Wednesdays so far this term. By “present” we mean those who physically attended school, i.e. register codes “/” “\” and “L”. This is different to the usual definition, which includes things like pupils out of school on trips. So the figures will be different to those in Attendance Tracker.
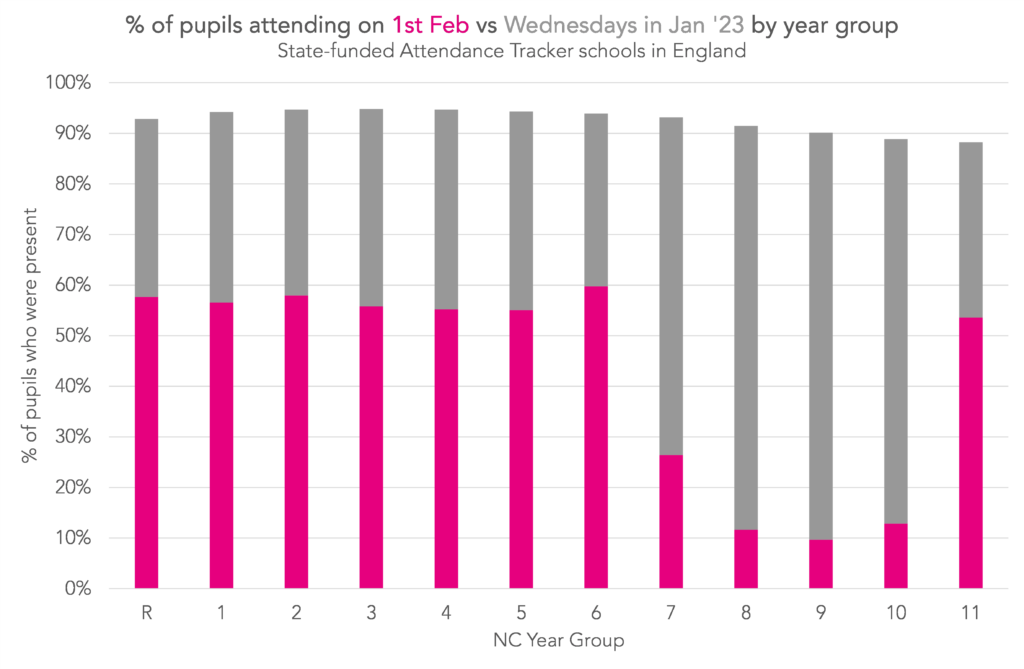
Overall, there were clear differences between primary and secondary. At primary, around 57% of pupils were present last Wednesday, and there was little variation between year groups. (For context, Wednesday tends to be the day with the highest attendance.) At secondary, the figure was much lower at 23% overall, but there were big differences between year groups. Attendance was highest in Year 11 (54% of pupils present) and second-highest in Year 7 (26%). It was lowest in Year 9, where only 10% of pupils were marked as present.
Pupil attendance by region
Next, we move on to region. The chart below shows the percentage of pupils who were marked as present last Wednesday split by region and primary/secondary.

We see a lot of regional variation. London had the lowest attendance at both primary (30% of pupils present) and secondary (13%).
Primary attendance was highest in the Midlands – 74% in the East Midlands and 67% in the East Midlands – while at secondary, it was highest in the North East (34%), followed by the West Midlands (32%) and East Midlands (29%).
Pupil attendance by disadvantage
Now we look at how attendance last Wednesday varied by disadvantage.
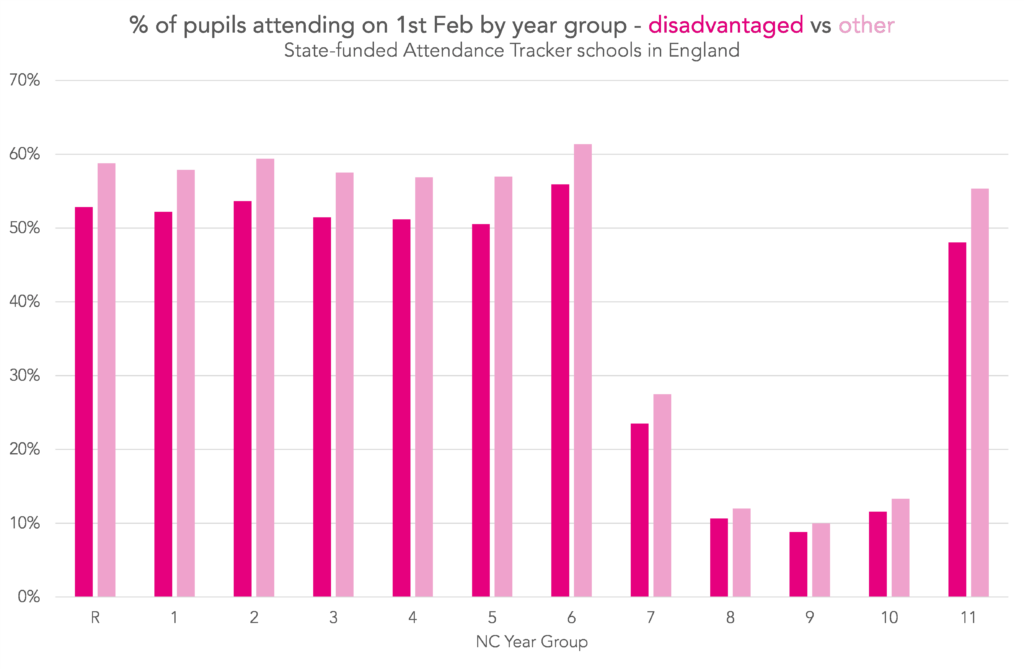
In all year groups, at both primary and secondary, disadvantaged pupils were less likely to be marked present than their peers. Across primary year groups, this difference was around five percentage points. In Year 11, it was around seven percentage points.
One possible explanation for this is that disadvantaged pupils were more likely than peers to be on roll at schools with low attendance overall on strike day (e.g. due to closure).
When we test for this at secondary, we find that it isn’t really the case. For Years 7 and 11[2] almost all of the difference (90%) in attendance between disadvantaged pupils on strike day and their peers is explained by differences between pupils at the same school. This is similar to the proportion on non-strike days.
When we look at primary though, we see something different. Around 60% of the difference in attendance between disadvantaged primary pupils on strike day and their peers can be explained by disadvantaged pupils being more likely to be on roll at schools with low attendance overall. This is a much higher proportion than non-strike days (around 15%).
Closure status by school type
To finish, we look at school-level attendance on strike day. We label schools as “fully closed” if no year groups had at least 50% of pupils marked as present, “fully open” if all year groups had at least 50% of pupils marked as present, and “partially open” for those somewhere in between[3].
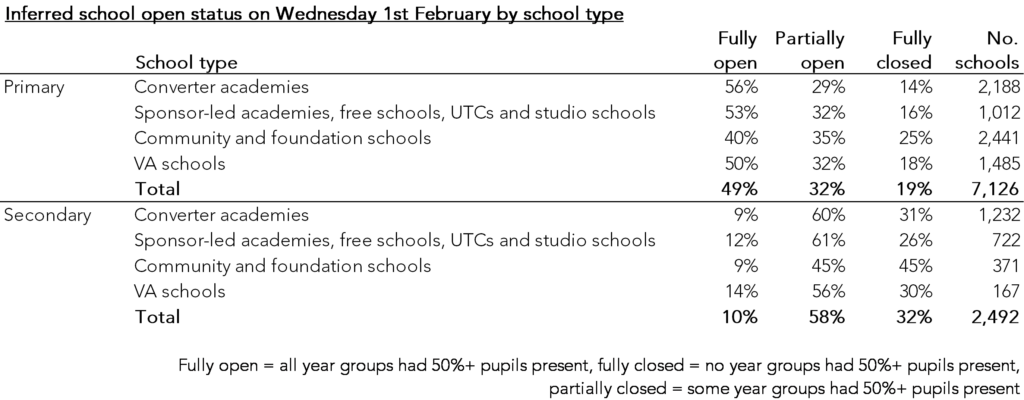
Overall, almost half of primary schools appeared to be fully open, compared with 10% of secondary schools. And 81% of primaries were either fully or partially open compared with 68% of secondaries.
Community and foundation schools were the most likely to be fully closed at both primary and secondary (25% of primaries and 45% of secondaries). At primary, converter academies were most likely to be fully open (56%) and Voluntary Aided (VA) schools most likely at secondary (14%).
Aspire Attendance Tracker
Schools can track, analyse and compare their attendance data against 1,000s of other FFT schools using Aspire Attendance Tracker.
Log in to Aspire to access Attendance Tracker – log in here.
Not an FFT Aspire user? Learn more here.
[1] Attendance Tracker data covers around 7,700 primary and 2,700 secondary schools in England
[2] I’ve removed Years 8, 9 and 10 from this analysis because their attendance rates were so low
[3] This is a different method to the one DfE used in last week’s publication so the results will be quite different too.


Clarification request: your site talks often about ‘the North West’, which I understand covers an area as far south as Manchester. On a map, Manchester is more ‘in the middle’ than in the top left of England. The population of Manchester alone exceeds that of Cumbria. So what about those in the land just south of the Border? Is that also NW? Because:
a) If it is, that is a HUGE area and surely not really a fair comparison – what is the reason for covering such a substantial geographical area and comparing it with the centre of a conurb like London?
b) If it is not – how is the overlook justified?
I think that the reason may involve looking at density of population as well as Geographical spread. This may cast a different complexion on fairness