This week marks the launch of a new weekday attendance analysis report for schools in our main Aspire Attendance Tracker system. Put together by us here at Datalab, it shows how pupil absence varies in your school by day of the week and how it compares with the national picture.
Access your report
To see the picture in your school, head over to Aspire Attendance Tracker homepage and click on “2021/22 weekday attendance analysis” in the reports menu at the top of the screen.
Not an FFT Aspire user? Learn more here.
Please note that the report is only available to schools that had attendance reports in 2021/22.
To mark the occasion, we’re bringing you some of the highlights. As in the report, the data we use covers the whole of the 2021/22 academic year[1], and all of our Attendance Tracker schools – around 7,500 primaries and 2,700 secondaries.
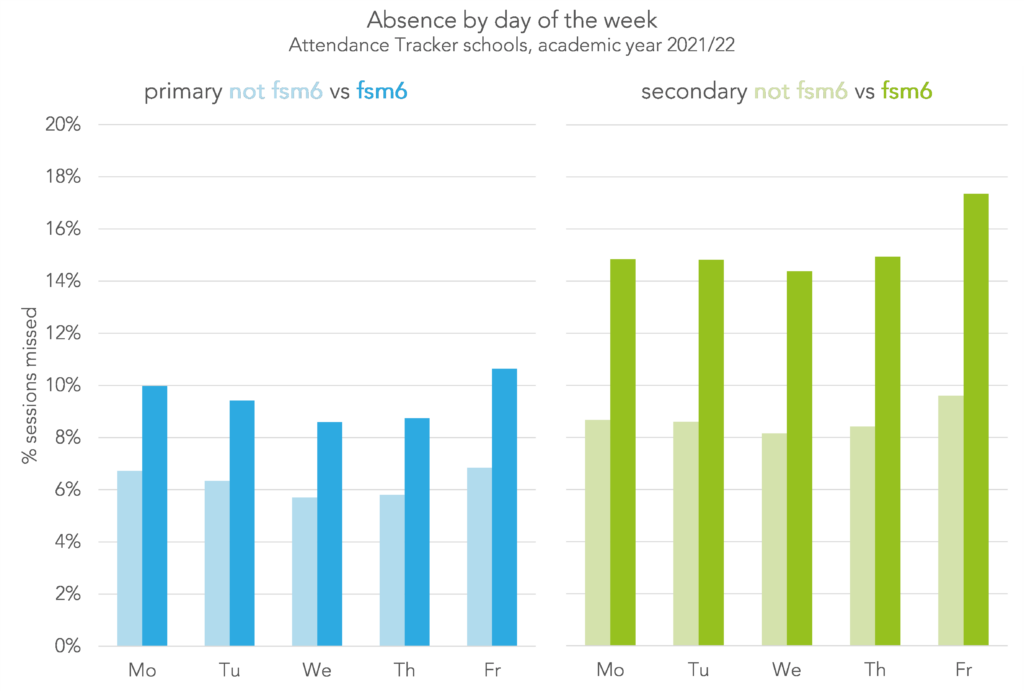
Absence tended to be highest on Fridays and lowest on Wednesdays
Let’s start by calculating the percentage of sessions missed by day of the week for all pupils, averaged across the academic year.
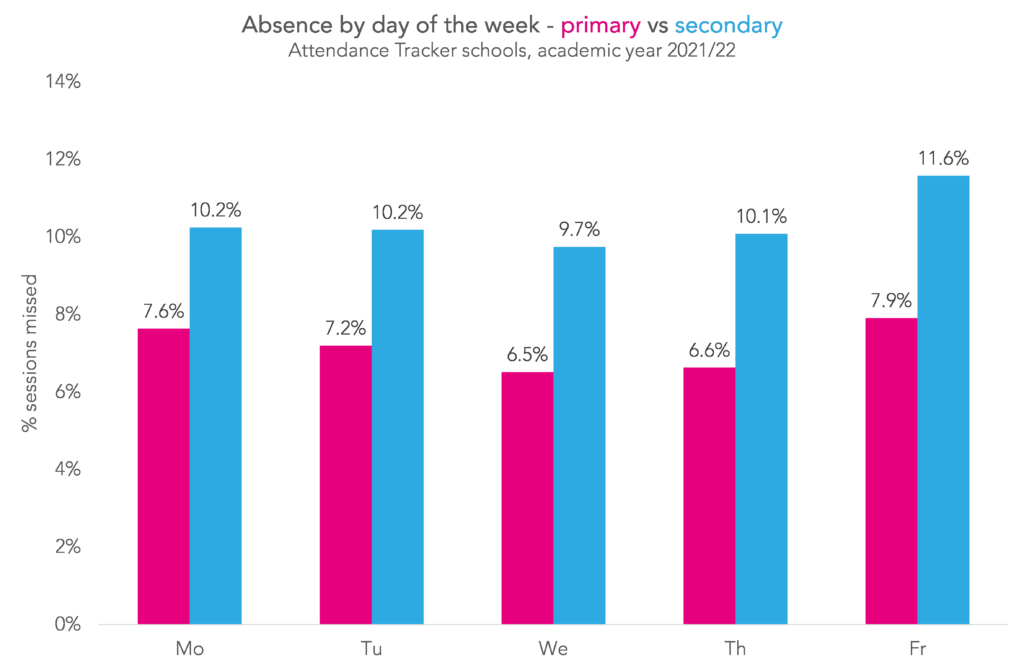
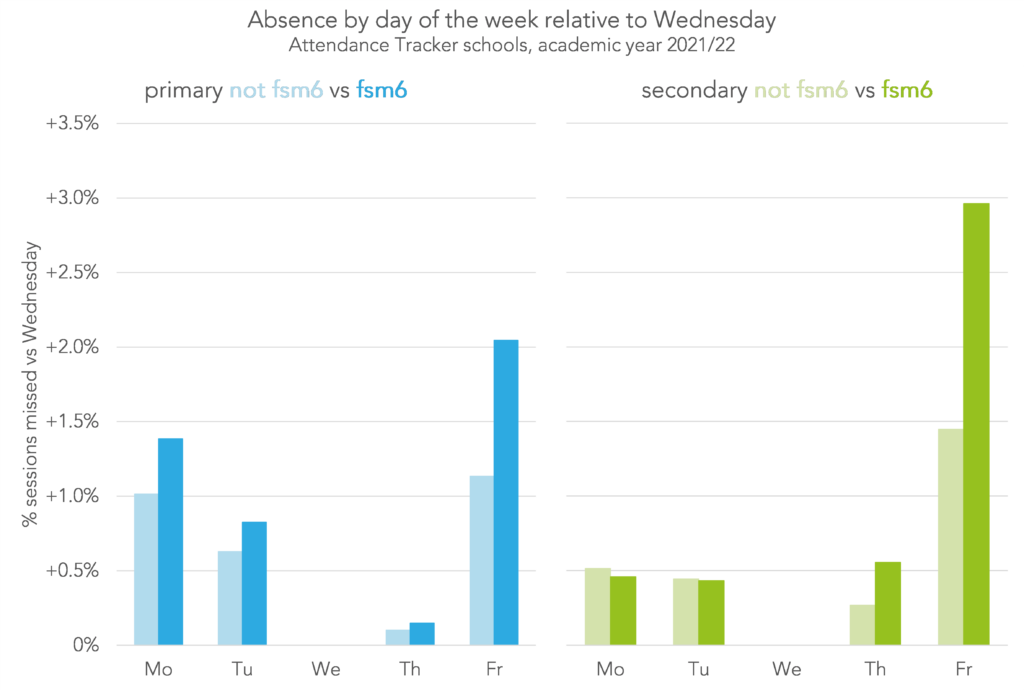
We see that at both primary and secondary, absence tended to be lowest on Wednesdays and highest on Fridays. There does seem to be a slightly different pattern across the week though. We can see this more clearly by plotting absence by day of the week relative to absence on Wednesdays.
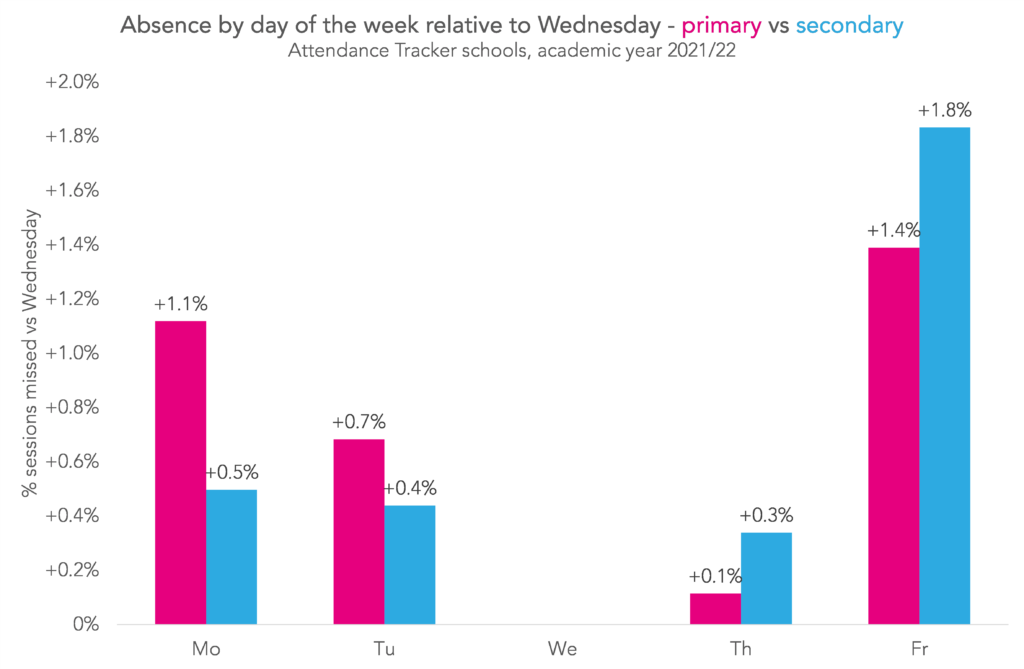
At primary, absence on Mondays was around one percentage point higher than on Wednesdays, whereas at secondary it was around half a percentage point higher. Similarly, on Fridays, absence at secondary was around 1.8pp higher than on Wednesdays, while at primary it was around 1.4pp higher.
In the report, we show this analysis separately for each of your year groups.
Boys and girls had similar patterns of absence across the week
The report also allows you to look at how absence varied across the week for different groups of pupils – by gender, disadvantage and SEN status.
So let’s look at national patterns by gender.
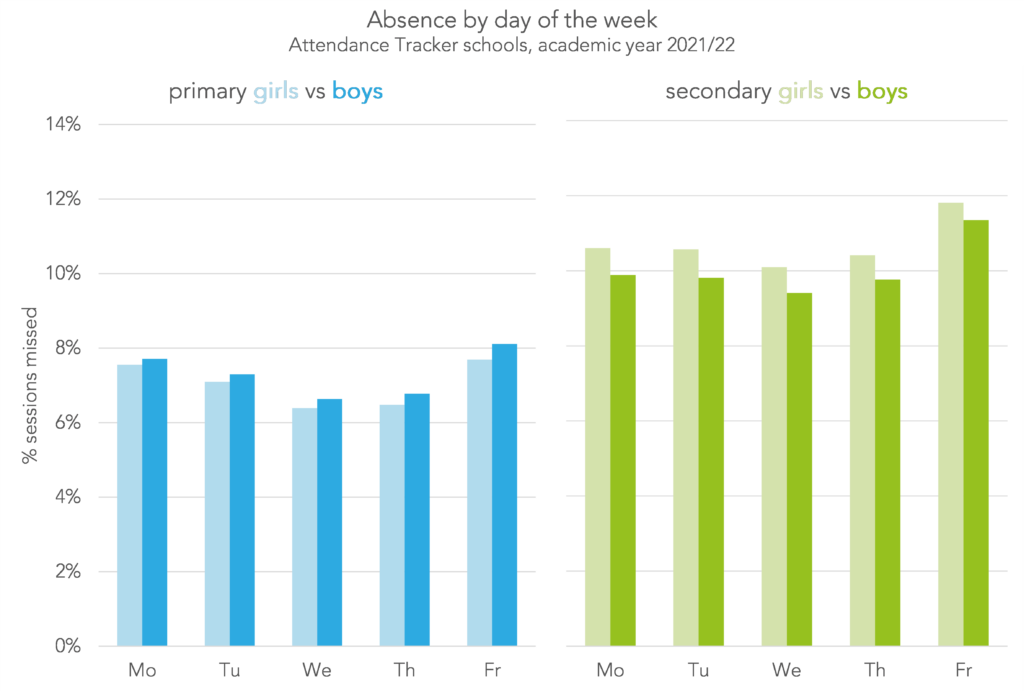
At primary, absence among boys is slightly higher than among girls, while at secondary it’s the other way round. But in terms of the pattern by day of the week, they look very similar. This similarity is highlighted if we plot the same data but with absence relative to Wednesdays.
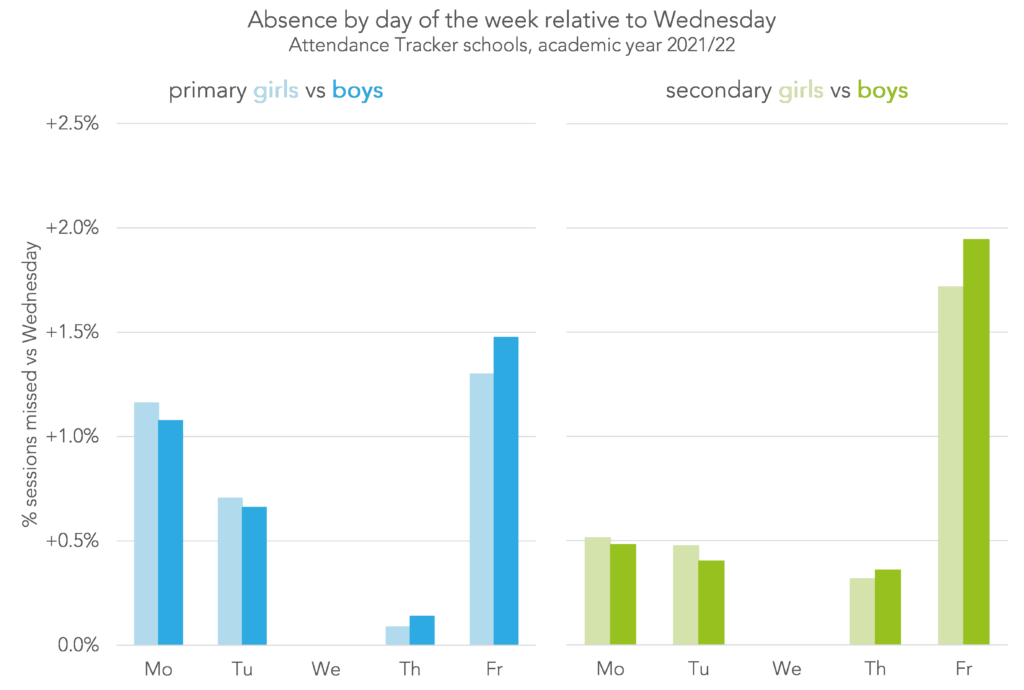
Boys are perhaps slightly more likely than girls to miss Fridays, but the difference is small – only around 0.2pp.
But absence among disadvantaged pupils tended to increase more towards the end of the week
When looking at patterns among disadvantaged pupils and their peers we see more of a difference.
The pattern for both groups of pupils is familiar – absence lowest on Wednesdays and highest on Fridays. But for disadvantaged pupils, there is a greater increase from Wednesdays to Fridays than there is for non-disadvantaged pupils, particularly at secondary. Absence on Wednesdays was around 6pp higher for secondary disadvantaged pupils compared with their peers. On Fridays, it was around 8pp higher. We see this clearly when we plot absence by day of the week relative to Wednesdays.
Not all schools see the same patterns of absence across the week
So the story of the national picture in general is one of similarity – absence decreasing from Monday to Wednesday, then increasing on Thursday before peaking on Friday.
But how much does this picture vary by school?
To answer that question, we calculate absence by day of the week averaged across the year for each of our Attendance Tracker schools, then we find which day of the week had the highest absence. We do this separately for each year group. Here are the results for our primary schools:
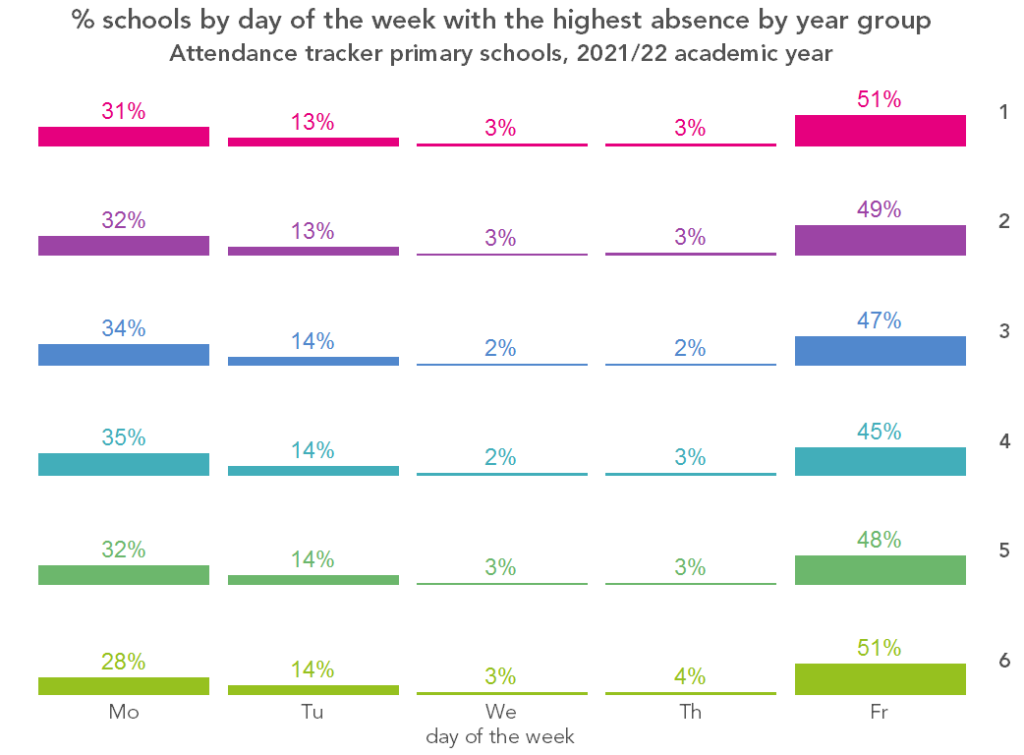
As we would expect, for most schools Friday is the day with the most absence. However, in around a third of schools, it’s Monday. And even though nationally Wednesday has the lowest absence rates, there are some schools where Wednesday is actually the worst day for absence.
Moving on to secondary schools:
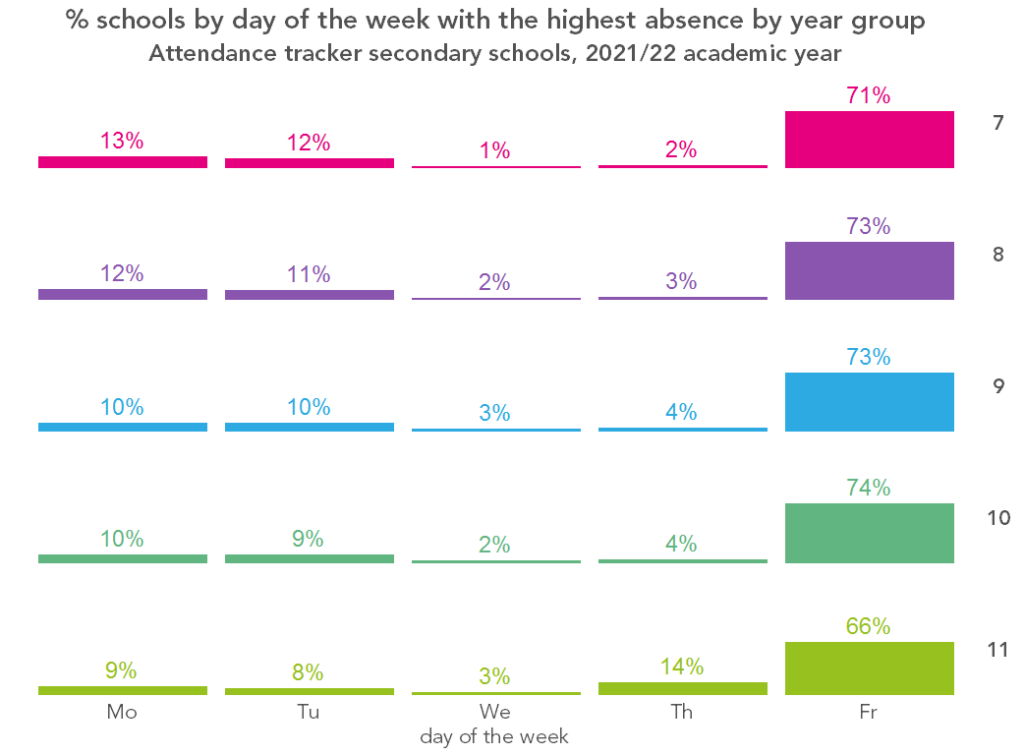
Here, almost three-quarters of schools saw the most absence on Fridays. But around a quarter saw the most absence on a Monday or Tuesday. And, again, in a small proportion of schools it was on a Wednesday.
And it’s not just between schools where there’s variation here – it’s also between different year groups in the same school. In 78% of our Attendance Tracker schools, there was at least one year group whose highest absence day was different from the others. There were even some schools (around 90) where every year group saw the highest absence on different days of the week.
Access your report
To see the picture in your school, head over to your Attendance Tracker homepage and click on “2021/22 weekday attendance analysis” in the reports menu.


Is there an updated version of this analysis? Just wondering if it has worsened or improved since covid.
Hi John. We hadn’t planned to update that one, but it might be something we’d do if there were any major changes. Displaying daily attendance patterns in Attendance Tracker reports is an area the team are currently developing though, so hopefully it’ll be something you can access there in future.