Today marks ten years since Datalab’s launch event in March 2015. And, as happens when you have a big birthday, we’ve been looking back and reflecting.
A lot has changed since 2015, but a lot has stayed the same, too. We’re proud to have been a part of some positive changes. And, even in cases where nothing much has changed, we always try to bring useful evidence and context to the table.
We hope that we’ll be able to keep this up for the foreseeable future. This isn’t the Oscars, but we’re grateful for the contributions and support of the many colleagues and friends, and of course all of our readers, who’ve made all of this possible.
Now to the content. For this birthday post, we thought it would be appropriate to look back at our very first report, back in 2015. It set out seven things you might not know about our schools. We’re going to look back at some of the things we predicted back then and see if we got them right, and talk about some big issues in education right now that weren’t even on our radar in 2015.
What happened to all of those empty buckets?
One of the things we spoke a lot about in 2015 was the potential for schools to improve their Attainment 8 scores by changing the subjects their pupils took rather than necessarily improving the grades they achieved.
We thought this would lead to regions where rates of entry to EBacc subjects tended to be low (broadly, the North) making big gains simply by ensuring that more pupils filled all of their Attainment 8 “slots”. We thought there would be lower Attainment 8 gains in regions where EBacc subject entries were already high (broadly, London).
To see whether this happened, we’ll plot average Attainment 8 scores by region in 2014, 2019, and 2024. We’ll use the 2014 values we calculated prior to Attainment 8’s inclusion in performance tables, and the 2019 and 2024 values from published data [1].
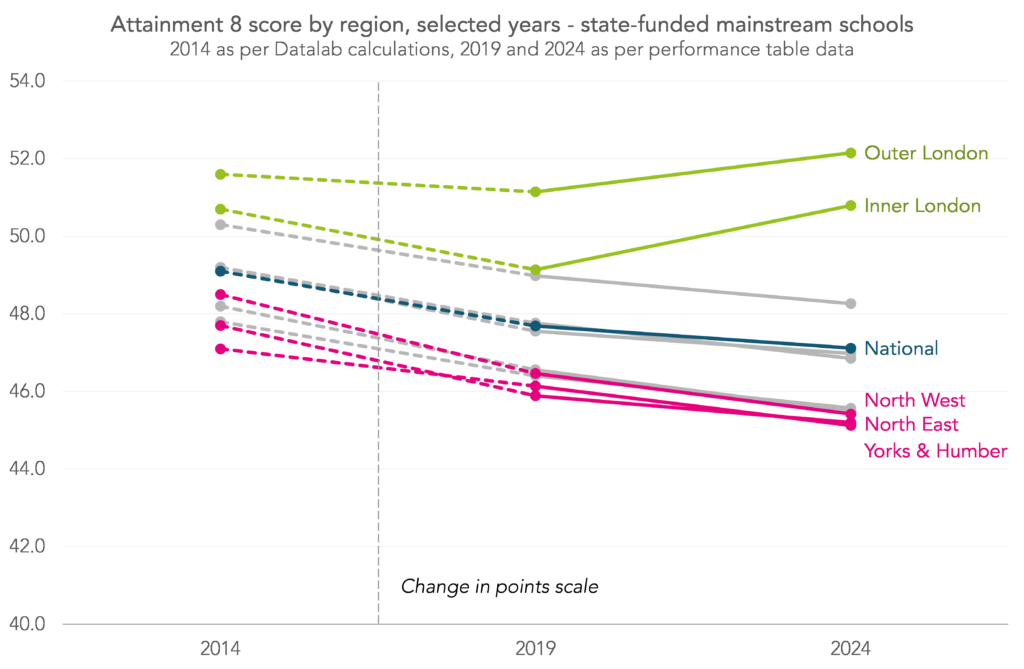
Now, because the 2014 calculations used different points scores for the underlying grades (A*-G) than the 2019 and 2024 calculations (9-1), Attainment 8 decreased by 1.4 points nationally between 2014 and 2019. Outer London and Yorkshire and the Humber saw smaller than average decreases, while decreases in the North West and North East were larger than average.
In the period between 2019 and 2024, encompassing the pandemic, Attainment 8 fell by 0.6 points nationally. But scores in London actually increased, while Northern regions were among those seeing the biggest falls.
We can see these changes more clearly by plotting the percentage change in Attainment 8 scores between the different time points directly.
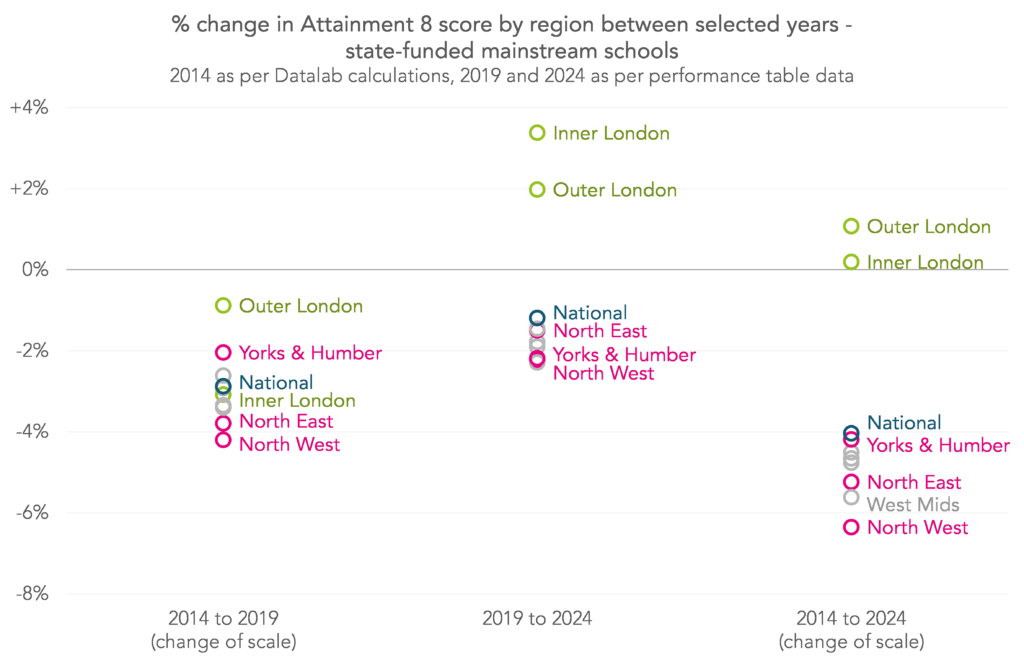
Whereas we thought that the Attainment 8 gap between London and the North would shrink, it has in fact grown. Though in our defence we couldn’t have foreseen the pandemic.
How much of this is down to changes in entry patterns and how much to changes in grades, will require further investigation.
Why hasn’t the disadvantage gap closed?
Back in 2015, we calculated our own version of the then soon to be introduced Attainment 8 measure, and showed that the disadvantage gap in Attainment 8 scores appeared to be closing. We said that, if current trends continued, the gap in Attainment 8 scores would close by 2032.
Let’s take a look at average Attainment 8 scores over the last ten years to see what has actually happened to the disadvantage gap since the measure was introduced.
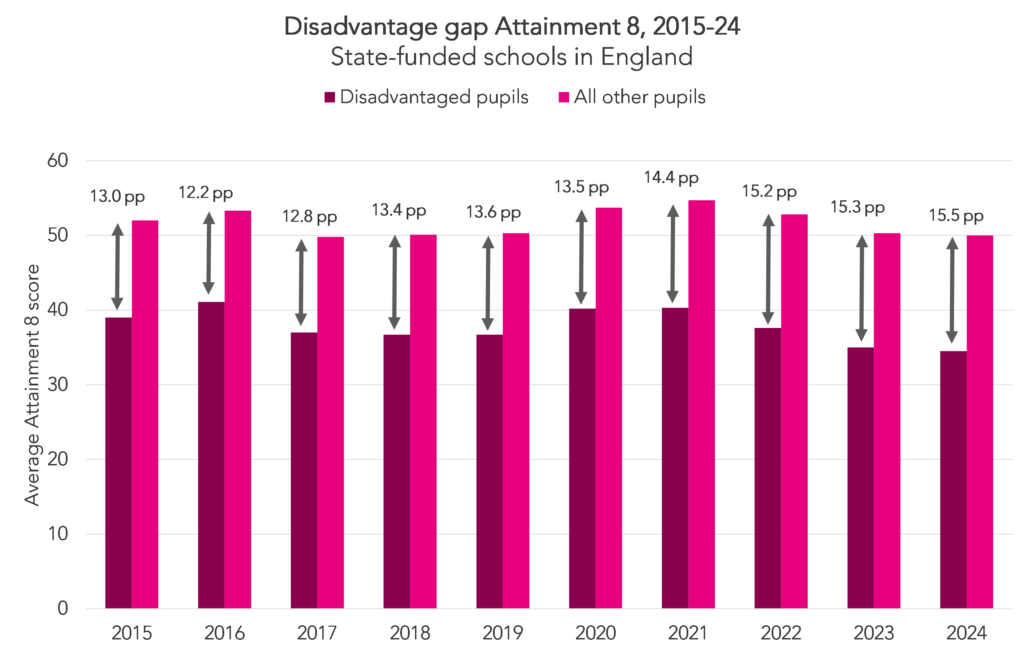
The attainment gap did fall between 2015 and 2016, but it then increased every year until 2019. We then hit the pandemic years, and the gap increased to unprecedented levels in 2021 and continued to increase year-on-year.
Obviously, the pandemic is a big part of the reason that the gap isn’t where we might have expected it to be based on our predictions in 2015, but what happened in the period from 2016-19?
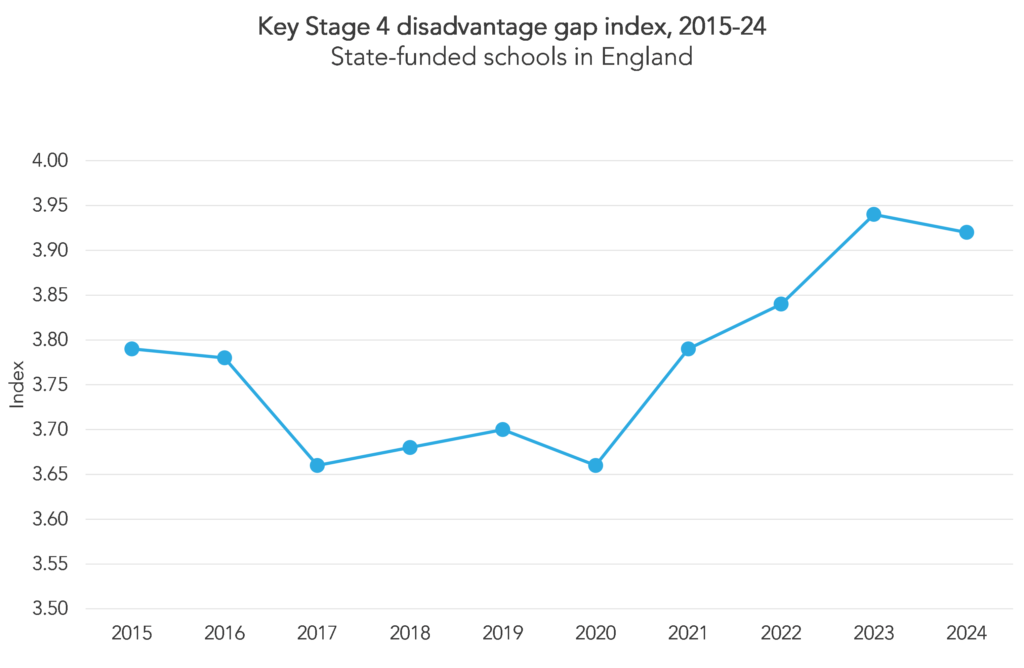
Some might argue that education policy during those years had something to do with it, with changes including the introduction of Attainment 8 and Progress 8 as well as reforms to GCSEs. But we do have to point out that when we use an alternative, supposedly more robust, measure of the disadvantage gap, we don’t see consistent increases during those years. This measure is known as the disadvantage gap index and is published annually by the DfE.[2]
Another complication is that patterns of free school meal eligibility have changed due to both changes to eligibility criteria and the pandemic. Changes to the criteria mean that some pupils who would have been eligible before the changes were introduced in 2018 would not be in subsequent years, but in the years since the pandemic a higher proportion of pupils have become eligible, notwithstanding the eligibility changes. This is at least partially because of transitional protections brought in to ease the transition from legacy benefits to universal credit.
This means that the definition of ‘disadvantaged pupils’ isn’t really consistent year-on-year, and makes comparisons over time difficult.
All that being said, we think it’s safe to say that the disadvantage gap at Key Stage 4 is far higher right now than we might have expected it to be back in 2015.
Now let’s turn to some things that we didn’t pick up on at our launch, but that have turned out to be important issues in schools today.
Rates of absence, exclusions and suspensions from school remain far above pre-pandemic levels
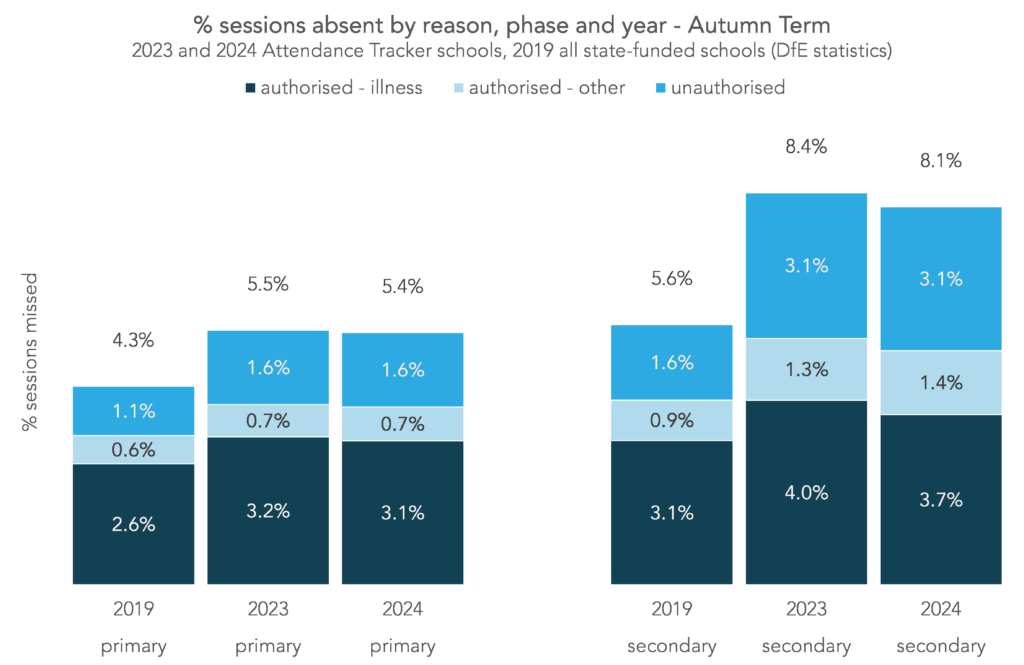
One major thing that we didn’t know about back in 2015 was, of course, the pandemic. And the increase in the rate of absence, exclusions and suspensions since the start of the pandemic has been unprecedented. We’ve been able to use data from our FFT Attendance Tracker schools – around 6,000 primary and 2,500 secondary schools across England – to get ahead of the official figures.
While unauthorised absence and fines for parents have been in the news and on the government’s agenda, the figures show that increases in unauthorised absence do not explain everything. Increases in authorised absence, which includes illness and absence for other reasons agreed with the school, account for around half of the increase in absence in primary schools last term, compared to pre-pandemic, and around a third of the increase in secondary schools.
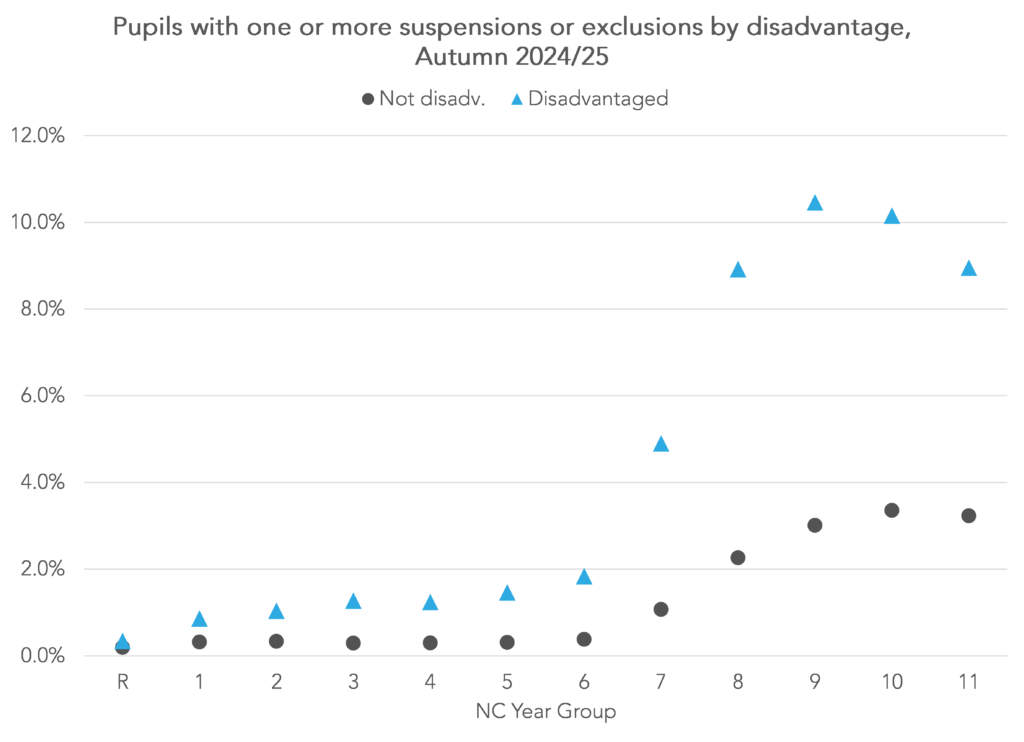
The differences in absence rates when broken down by disadvantage and identified SEN are stark, with the most vulnerable pupils missing the most school.

Rates of exclusions and suspensions also remain well above pre-pandemic levels. Official figures only take us up to the end of the 2022/23 academic year. They showed that suspensions reached record levels that year, and our analysis for 2023/24 suggests that they were higher still.
Early data for the 2024/25 academic year suggests that the rate of increase is at least beginning to slow. But rates are still extremely high, particularly for disadvantaged pupils: 10% of Year 9 and 10 disadvantaged pupils were suspended or excluded at least once last term.
Alternative provision and SEND
Perhaps the biggest policy challenge in education at the moment is fixing the SEND system, which is usually preceded by the word “broken”.
Back in 2018, we tracked a cohort of pupils from Reception in 2005/06 to end of Year 11 in 2016/17 and found that 44% of pupils were classified as having special educational needs at least once during that time.
Up until the end of Year 9, the previous SEN code of practice would have applied. This was the era of Statements of SEN, School Action and School Action Plus. The new (current) code of practice was introduced in 2014/15.
When we tracked a later cohort, those in Reception in 2014/15, we found that the incidence rate of SEN had fallen. 29% of pupils had been identified as ever having SEN by the end of Year 7, compared to 41% in the 2005/06 Reception cohort.
However, among more recent cohorts, the rate of pupils to ever have had an Education, Health and Care Plan (EHCP) is far higher than the percentage to have ever had a Statement of SEN among older cohorts.
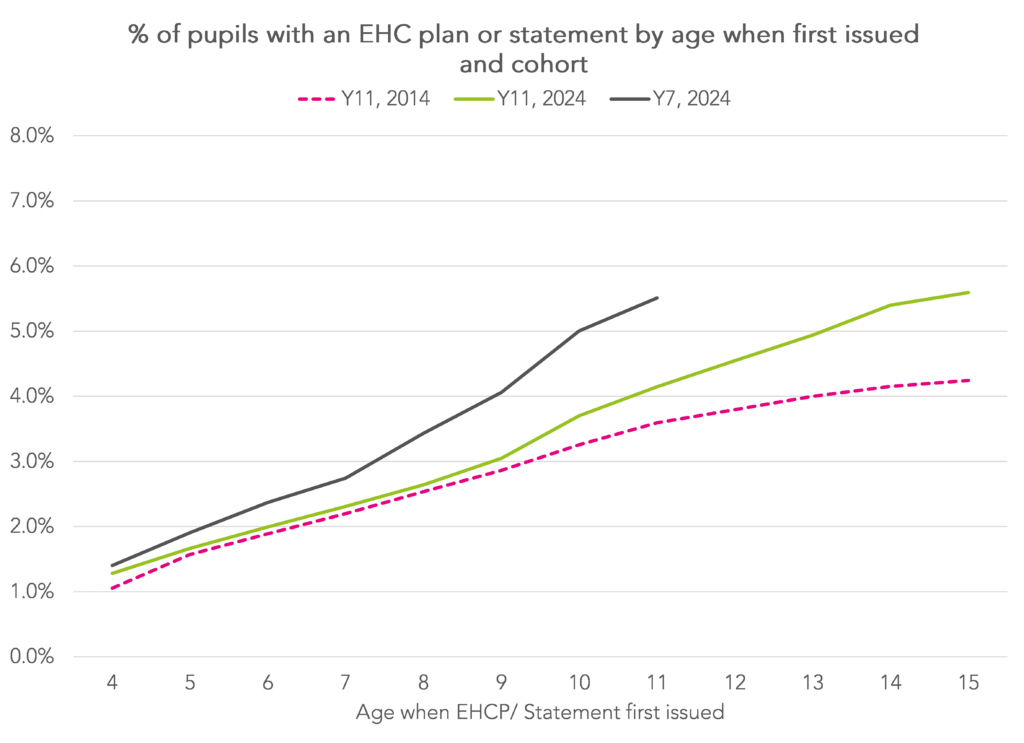
Even by 2019, it was clear that the percentage of pupils with statements or EHC plans educated in mainstream schools was falling. With special schools full, independent providers have stepped in. As a consequence, numbers of young people with EHC plans educated outside the state-funded sector have increased.
We have also shone a light on Alternative Provision (AP) schools. These are often thought of as schools for excluded children yet the majority of pupils who go to them have never been (formally) excluded. This includes a number of pupils who appear to have undergone a managed move.
The majority of pupils in AP schools are identified as having SEN, often social, emotional and mental health (SEMH) difficulties. The previous government published a green paper which saw AP as part of the SEND system. It proposed five key outcomes for the sector: effective outreach, improved attendance, reintegration, academic attainment and post-16 transition. While some of these measures already exist, some do not. We have developed measures of attainment, including Progress 5, that we think are more suitable than those currently available in Performance Tables, and also examined attendance, reintegration and post-16 destinations in the sector.
Of course since then we have had a change of administration. We are not yet clear what the current government’s intentions are with regard to AP.
Unintended consequences of Progress 8 and performance tables
We didn’t really get into these in our first report in 2015, but we’ve written a lot since about the unintended consequences of Progress 8 and school performance tables.
Our Who’s Left series provided evidence on the practice of off-rolling. Off-rolling is a way of gaming performance tables by removing low attaining pupils from the school roll before census data is collected, so that these pupils aren’t included in the statistics that make up the tables. It has since been investigated by public bodies including Ofsted and the former Children’s Commissioner.
Practices like off-rolling might happen regardless of the performance measures used. But one issue that is particular to Progress 8 is the question of creative subjects. One of the aims of Progress 8 was to drive up entry in the English Baccalaureate subjects, but as this doesn’t include creative subjects there was speculation as to whether this would lead to a fall in entries to creative subjects.
And we have seen a fall: the percentage of pupils doing any qualification in art and design fell from 31% in 2015 to 27% in 2023, in music from 9% to 7%, and in performing arts from 20% to 12%.
This is perhaps smaller than we might have expected, and may or may not be because of Progress 8.
What next?
We don’t want to tie ourselves to a lot of predictions that we’ll have to come back and debunk in ten years’ time – but here are a few thoughts on some of the issues that we’ll probably be writing about over the next ten years.
The fall in pupil numbers that will hit schools over the next few years is set to have a huge impact. We’ll be trying to quantify that and explore which schools and pupils are most affected.
If Labour’s proposed reforms to Progress 8 come into being, we may have a chance to find out just how much impact the original version had on entries to creative subjects. We’ll also be keeping an eye on the continued phased introduction of T-Levels and the phasing out of BTECs.
We’ve written a lot about Ofsted judgements in the past, but with the introduction of new single word judgements we’ll be taking a whole new angle.
And we don’t really expect any of the other issues that we’ve touched on in the post to go away.
Final thoughts
Here at Datalab, we don’t like to blow our own trumpet, but we are quite proud of what we’ve achieved over the last ten years. We hope that you’ve enjoyed both this post and all that we’ve done since 2015 – and here’s to the next ten years.
[1]: available here: https://www.compare-school-performance.service.gov.uk/download-data
[2]: The disadvantage gap index ranks all pupils in the country by attainment in English and maths, then compares the mean rank of disadvantaged pupils with the mean rank of non-disadvantaged pupils. Because it uses ranks it tends to provide better comparability of the disadvantage gap over time compared to raw differences in attainment. Further details can be found in the methodology document.


Happy birthday! I remember my excitement at the bouncing baby bundle of data analysis as if it were yesterday. Many thanks for the joy you’ve given us all over the last 10 years.
Thanks very much Chris- I hope there’s much more to come.
Enjoy the birthday and the years to come! Despite being retired I still enjoy looking at your analyses.
This look back has been as thought provoking as many of the posts have been over the years. The stark figures for the disadvantaged and the SEND pupils over the ten years once again show how the education system is not meeting the needs of these vulnerable groups. Thanks for all you do to highlight what the data may and may not show.
Thanks very much Sue. I think if we were starting out now then outcomes for disadvantaged pupils and for those with SEND would be at the top of the issues we’d write about.
Happy birthday. I read everything you write and always learn something interesting or useful. Here’s to 10 more years!