The Department for Education Statistical First Release on Schools, Pupils and their Characteristics for 2021 included some interesting numbers on pupils in alternative provision (AP).
Between 2020 and 2021, it reported that the number of pupils attending AP schools[1] fell from over 15,000 to under 13,000.
Meanwhile, the numbers in local authority commissioned alternative provision increased by more than 3,000 to over 32,000. Numbers have increased by similar amounts each year since 2017.
So what is local authority commissioned alternative provision and why has it been increasing?
The rise in alternative provision
When places in state-funded mainstream, special or AP schools are unavailable and/ or unsuitable, local authorities fund alternative provision. This includes places in independent special schools and AP, FE colleges and tuition.
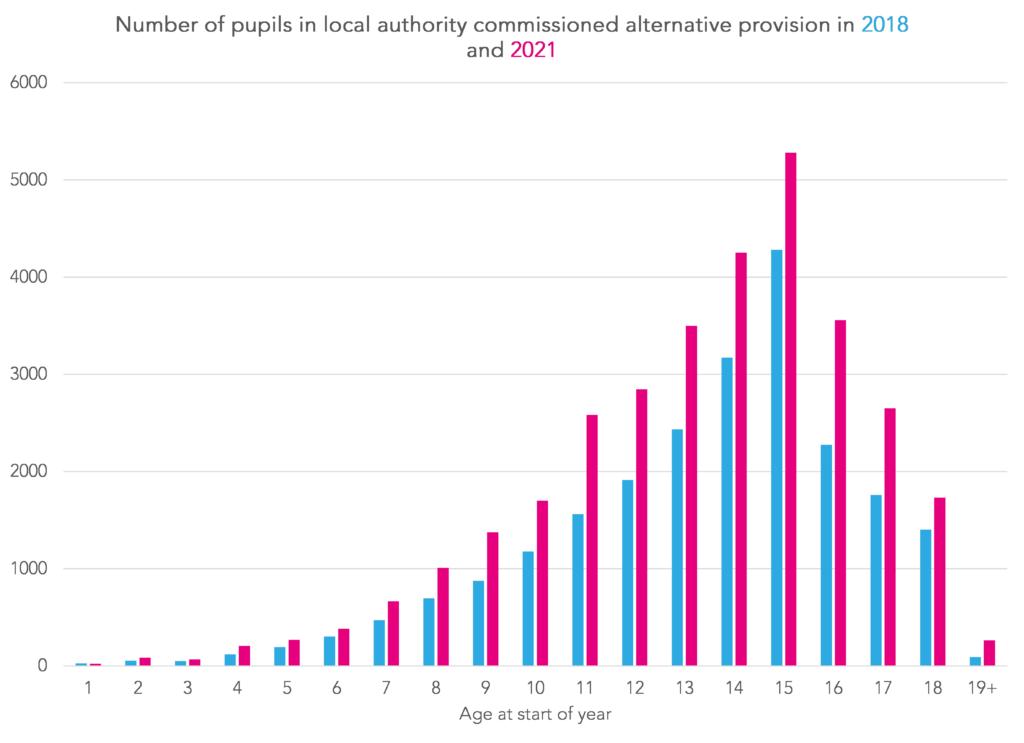
DfE statistics show that this is more common among secondary age pupils, particularly those aged 15 (the final year of compulsory schooling). However, numbers have increased since 2018 across the age distribution.
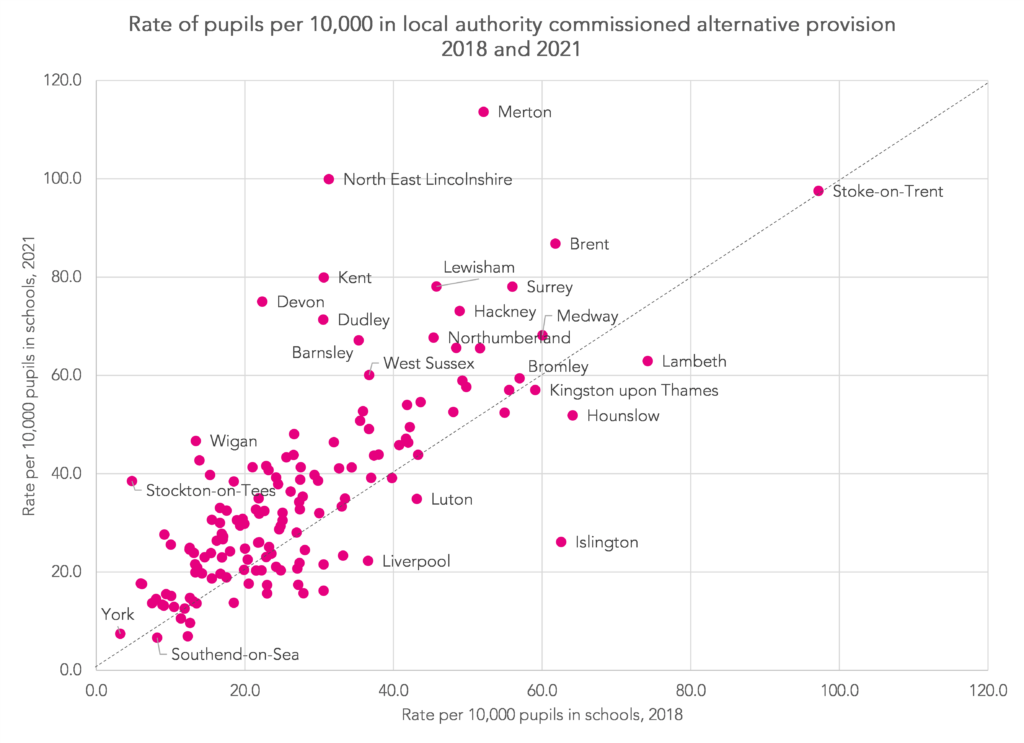
There is also substantial variation between local authorities in the number of pupils in local authority commissioned alternative provision. In the chart below, we express this number as a ratio per 10,000 pupils attending schools and show the change between 2018 and 2021.
What type of provision are local authorities paying for?
The most recent pupil-level data we have available for analysis is from January 2020.
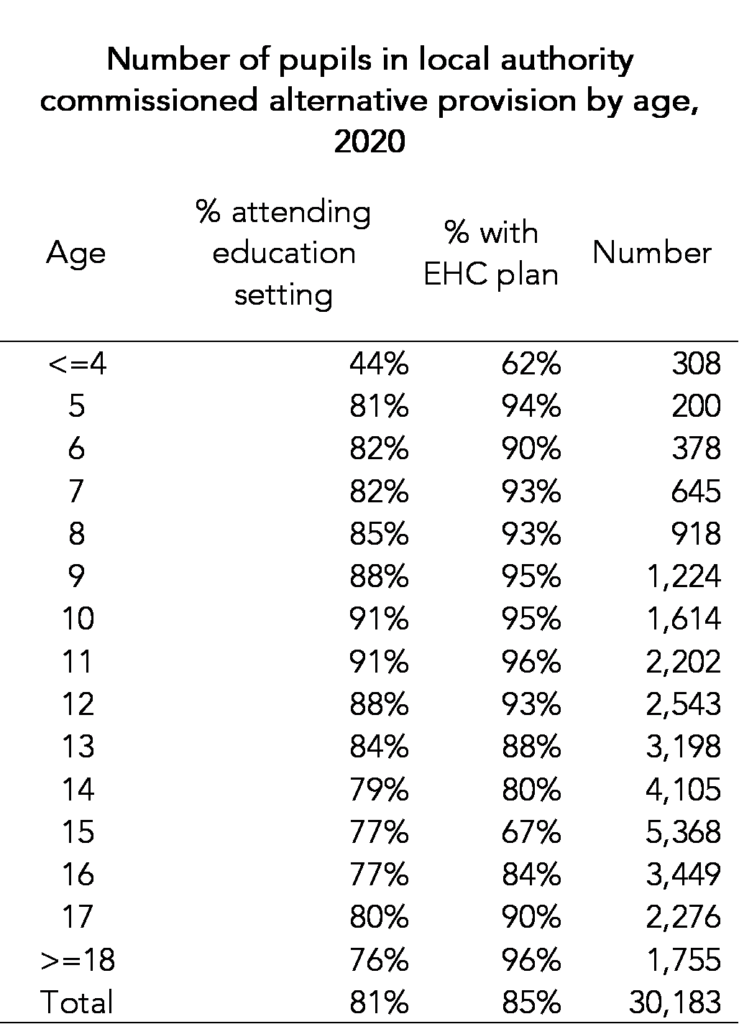
In the table below, we show the percentage of pupils in local authority alternative provision who are educated in educational settings (schools, colleges, early years settings) and the percentage who have an education, health and care (EHC) plan. Some pupils do not attend schools, colleges or other educational settings. These include pupils who might receive tuition at home but paid for by their local authority.
The vast majority of these pupils (85%) have EHC plans. However, this figure among 15 year olds is somewhat lower at 67%.
81% of these pupils were an educational setting. Details of settings attended have been collected since 2018. In the table below we summarise the type of setting attended for pupils of compulsory school age.
73% of pupils with EHC plans in local authority commissioned alternative provision and 32% of other pupils were attending schools in the independent sector. For the former group, these are primarily schools registered as independent special schools. However, some of these schools, and some of those listed as independent schools are alternative provision schools. However, there is no designation for alternative AP. We have previously tried to work out which independent schools are alternative AP schools.
Why numbers have been increasing
The main reason the number of pupils in local authority commissioned alternative provision has been increasing is that the number of pupils with EHC plans has been increasing and there does not appear to be enough capacity in the state-funded sector to accommodate them.
In the chart below we scan both January School Census and the AP census from 2010 onwards to identify the first year pupils are observed with either a EHC plan or a statement of SEN[2]. The chart summarises the number of pupils with either a new statement or a new EHC plan from 2013 onwards. We see a sharp increase in new cases from 2016 onwards. Data for 2021 is an under-estimate as AP census data was not available.
According to one set of DfE published statistics based on data collected from schools, the number of pupils with EHC plans (or statements) in schools increased by 38% between 2016 and 2021. However, the number in independent schools increased by 62%.
DfE undertakes a separate collection of data from local authorities about pupils with EHC plans called the SEN2 survey. This also tells us about young people with EHC plans or statements who are not educated in schools.
According to these statistics, there were 430,000 young people aged 0 to 25 with EHC plans or statements in 2019. Most of those not in schools are at the upper end of the age range and are in further education or the NEET (not in education, employment or training) group.
But of most interest (to me at least) are the 14,000 pupils whose placement is “educated elsewhere”. Further data tables show that this includes over 3,000 in elective home education and almost 1,500 compulsory age pupils who are awaiting provision.
How many pupils in local authority alternative provision have previously attended state-funded mainstream schools?
The vast majority (90%) of pupils of compulsory school age who were in local authority commissioned alternative provision were observed to have attended state-funded schools at some point in their educational history. 86% had attended a mainstream school.
In some rare cases, pupils were observed to be in both alternative provision and attending state schools in Spring 2021. However, it was rarer still that they were attending mainstream schools.
Why are so many pupils with EHC plans outside the state-funded school system?
In 2020, almost 20,000 pupils of compulsory school age pupils with EHC plans or statements or SEN (around 7%) were in local authority commissioned alternative provision. Another 1,500 were awaiting provision.
These figures varied by local authority. In some areas, such as Merton, the rate was over 20%. A full breakdown by local authority is presented in the appendix.
Most of these pupils have attended mainstream schools in the past.
So why are so many pupils, particularly those with EHC plans, in education outside of the state-funded sector?
Is it that there are not enough suitable places? If so, what do we need to do to create more? What can the schools in the independent sector offer that the state system cannot?
And to what extent is it the case that pupils are dropping out of the state-funded system, particularly state-funded mainstream schools, during their secondary education? We have shown previously how pupils who had SEN at primary schools and who transfer to mainstream secondary schools drop out of the system as compulsory schooling comes to an end. This gives rise (to some extent) to the age profile of pupils in local authority AP (shown in the first chart above).
We think finding answers to these questions should be an objective of the recently convened SEND review steering group. This will involve working with parents, schools and young people themselves to understand their journeys from the state-funded system into their current provision.
- Pupil referral units and alternative provision free schools and academies
- The current SEN code of practice, which led to a change from statements to EHC plans, was introduced in 2014
Want to stay up-to-date with the latest research from FFT Education Datalab? Sign up to Datalab’s mailing list to get notifications about new blogposts, or to receive the team’s half-termly newsletter.


My son attended a mainstream primary which bent over backwards to accomodate him and his needs. Due to a trauma background he could quickly become dysregulated and they stuck with him throughout and supported him and us and he improved so much over the time he was with them.
He then went to a mainstream secondary, who would not provide a TA in lessons to support him and the first time he had a problem, which was a lot more low key than what his primary had dealt with they unlawfully permantly excluded him. Our LA has a weird system of “recinded” permanent exclusions which means he’s still on the secondary’s role but attending the local alternative provision and he’s been there for months. No other mainstream were willing to say they could meet need (they all seemed to be over-burdened with lots of other kids with EHC plans) so we’re now searching for a specialist placement. The LA’s specialist schools don’t cater for kids who can access a mainstream curriculum so we’re having to look at the independent special schools instead.
Thank you very much for sharing your experience (although I’m sorry you’ve all had to go through it). The point at the end about how places in state-funded special schools are controlled is important.
Please review the following paragraphs:
“Between 2020 and 2021, it reported that the number of pupils attending AP schools[1] fell from over 15,000 to under 13,000.
Meanwhile, the numbers in local authority commissioned alternative provision increased by more than 3,000 to over 32,000. Numbers have increased by similar amounts each year since 2017.”
The first figure refers to PRUs specifically but is labeled as “AP schools” in the article.
The second figure correctly refers to APs but the link directs to PRU data.
Thanks Arjay. Good spot. I’ve corrected the link. The reference to AP schools is correct – it covers pupil referral units and alternative provision free schools and academies.