How will qualification entry patterns change as a result of changes to Attainment 8?
Expect an increase in entries in creative subjects and fewer entries in geography, history and triple science
Expect an increase in entries in creative subjects and fewer entries in geography, history and triple science
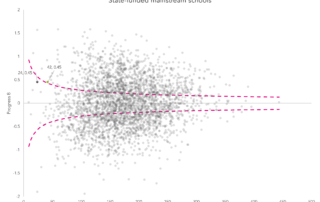
The Department for Education are consulting on a new "best-fit progress" measure for pupils with low prior attainment at the end of Key Stage 2. But does it offer any more beyond the existing Progress 8 measure?
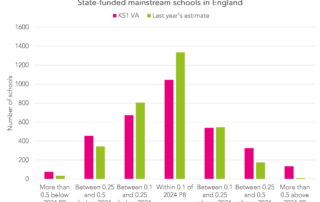
DfE are proposing a change to the way they calculate bandings that summarise schools' progress scores. We look at the pros and cons of doing so.
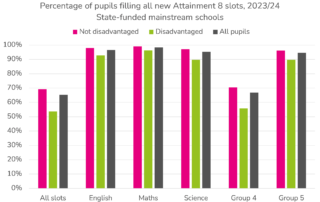
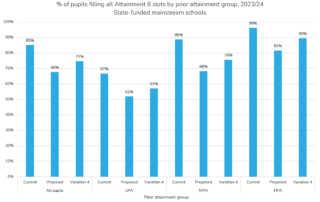
The proposed new method of calculating Attainment 8 will not affect schools' Progress 8 scores greatly but will shift the incentives to enter particular subjects
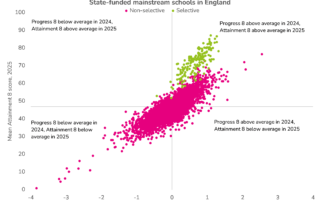
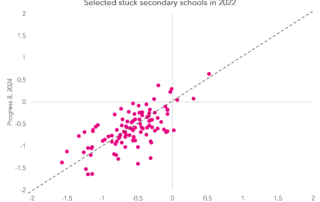
This year's published secondary school performance data shows why Progress 8 (or something like it) is needed, despite its flaws
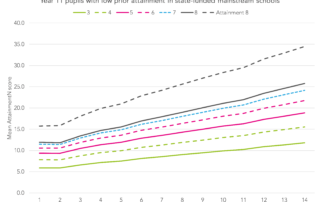
There will be no official Progress 8 measures this year due to the cancellation of Key Stage 2 tests in 2020. However, we have produced an alternative measure using CAT4 scores as a baseline.
As there will be no Progress 8 measures this summer, we look at a few options for calculating proxy scores instead
RISE teams are the government's new school improvement taskforce. We look at how their work in targeted intervention schools might be evaluated.
In this second part we calculate some alternative performance indicators that reflect pupil mobility