It’s been nearly five years since we first published Who’s Left.
At the time, there was very little quantitative research into the extent to which pupils left or changed schools. Since then, several other organisations have published research and the practice of off-rolling has been investigated by public bodies including Ofsted and the (former) Children’s Commissioner.
The last time we updated Who’s Left was in 2019 when we analysed the final destinations at the end of compulsory schooling for the 2018 cohort.
In this blogpost we update our work for the 2019 and 2020 cohorts.
However, although the 2020 cohort missed the last few months of school due to the pandemic, these are essentially pre-pandemic cohorts.
So we also include some new analysis of pupil moves from state-funded mainstream secondary schools up to January this year.
Data
In this blogpost, we use the January School Census from 2014 to 2021 to look at the extent to which pupils leave schools and where they go.
This contains details of all pupils enrolled in state-funded schools with a ‘current’ or ‘main’ registration.
We track pupils in Years 7 to 11 each year from 2014 to 2021, identifying pupils who change school. Reasons for changes will include:
- Moving to/ from the independent sector
- Moving to/ from schools in other countries, including other parts of the UK
- Moving to/ from home education
- Managed moves and permanent exclusions
- Moving to/ from other state schools, including alternative provision and transfers to schools which admit in Year 8 or later, including studio schools and university technical colleges (UTCs)
Moves to other state schools may coincide with house moves.
How many pupils change school?
The chart below shows the percentage of pupils in National Curriculum (NC) years 9, 10 and 11 who had left a school in the previous year.
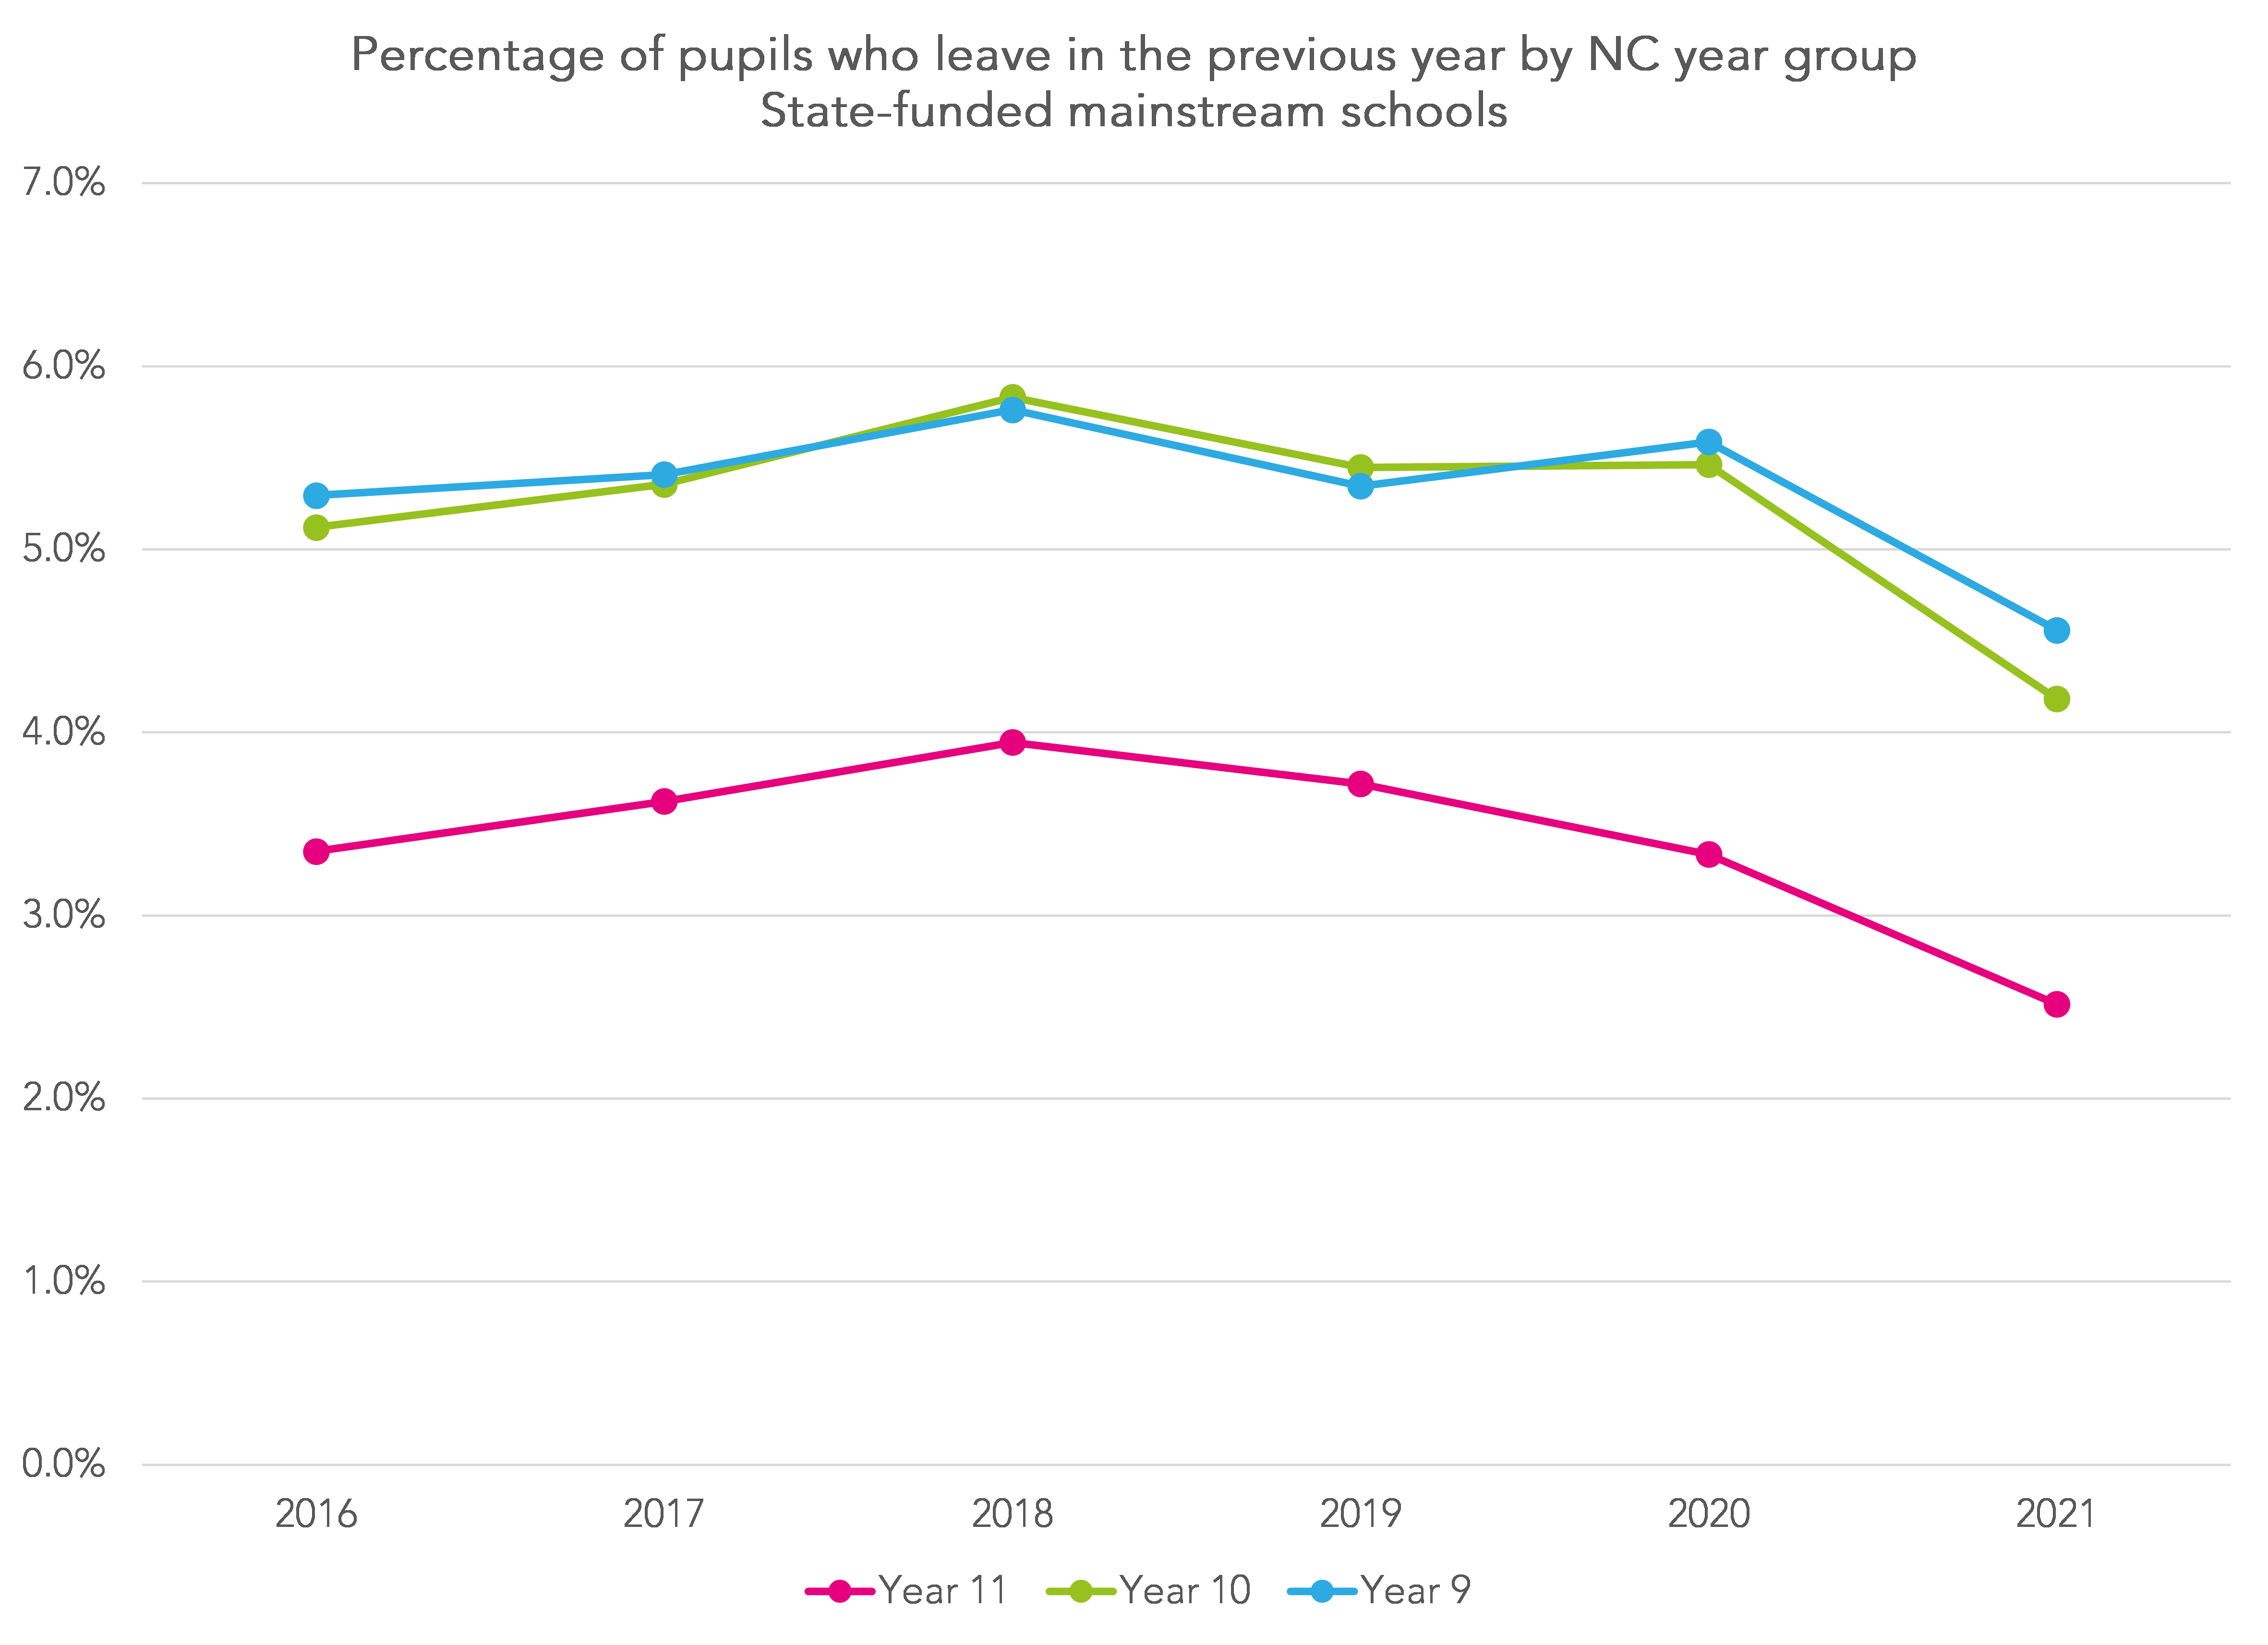
The rate of school moves is lower among pupils in Year 11. In recent years, this rate was at its highest in January 2018 and has since been declining. Up to 2020, the lines for Years 9 and 10 were more variable but fell markedly in 2021.
What type of moves do pupils make?
For each pupil who we observe changing school, we classify their destination as follows:
- Move to a UTC or studio school
- Move to a special school
- Move to an alternative provision (AP) school (pupil referral units and AP free schools and academies)
- Structural change (e.g. as a result of an outright closure of a school)
- Move to another mainstream school
- With a change in residence[1]
- Without a change in residence
- Leaving the state-funded system
The chart below summarises destinations for Year 10 pupils (i.e. moves between Year 9 and Year 10).
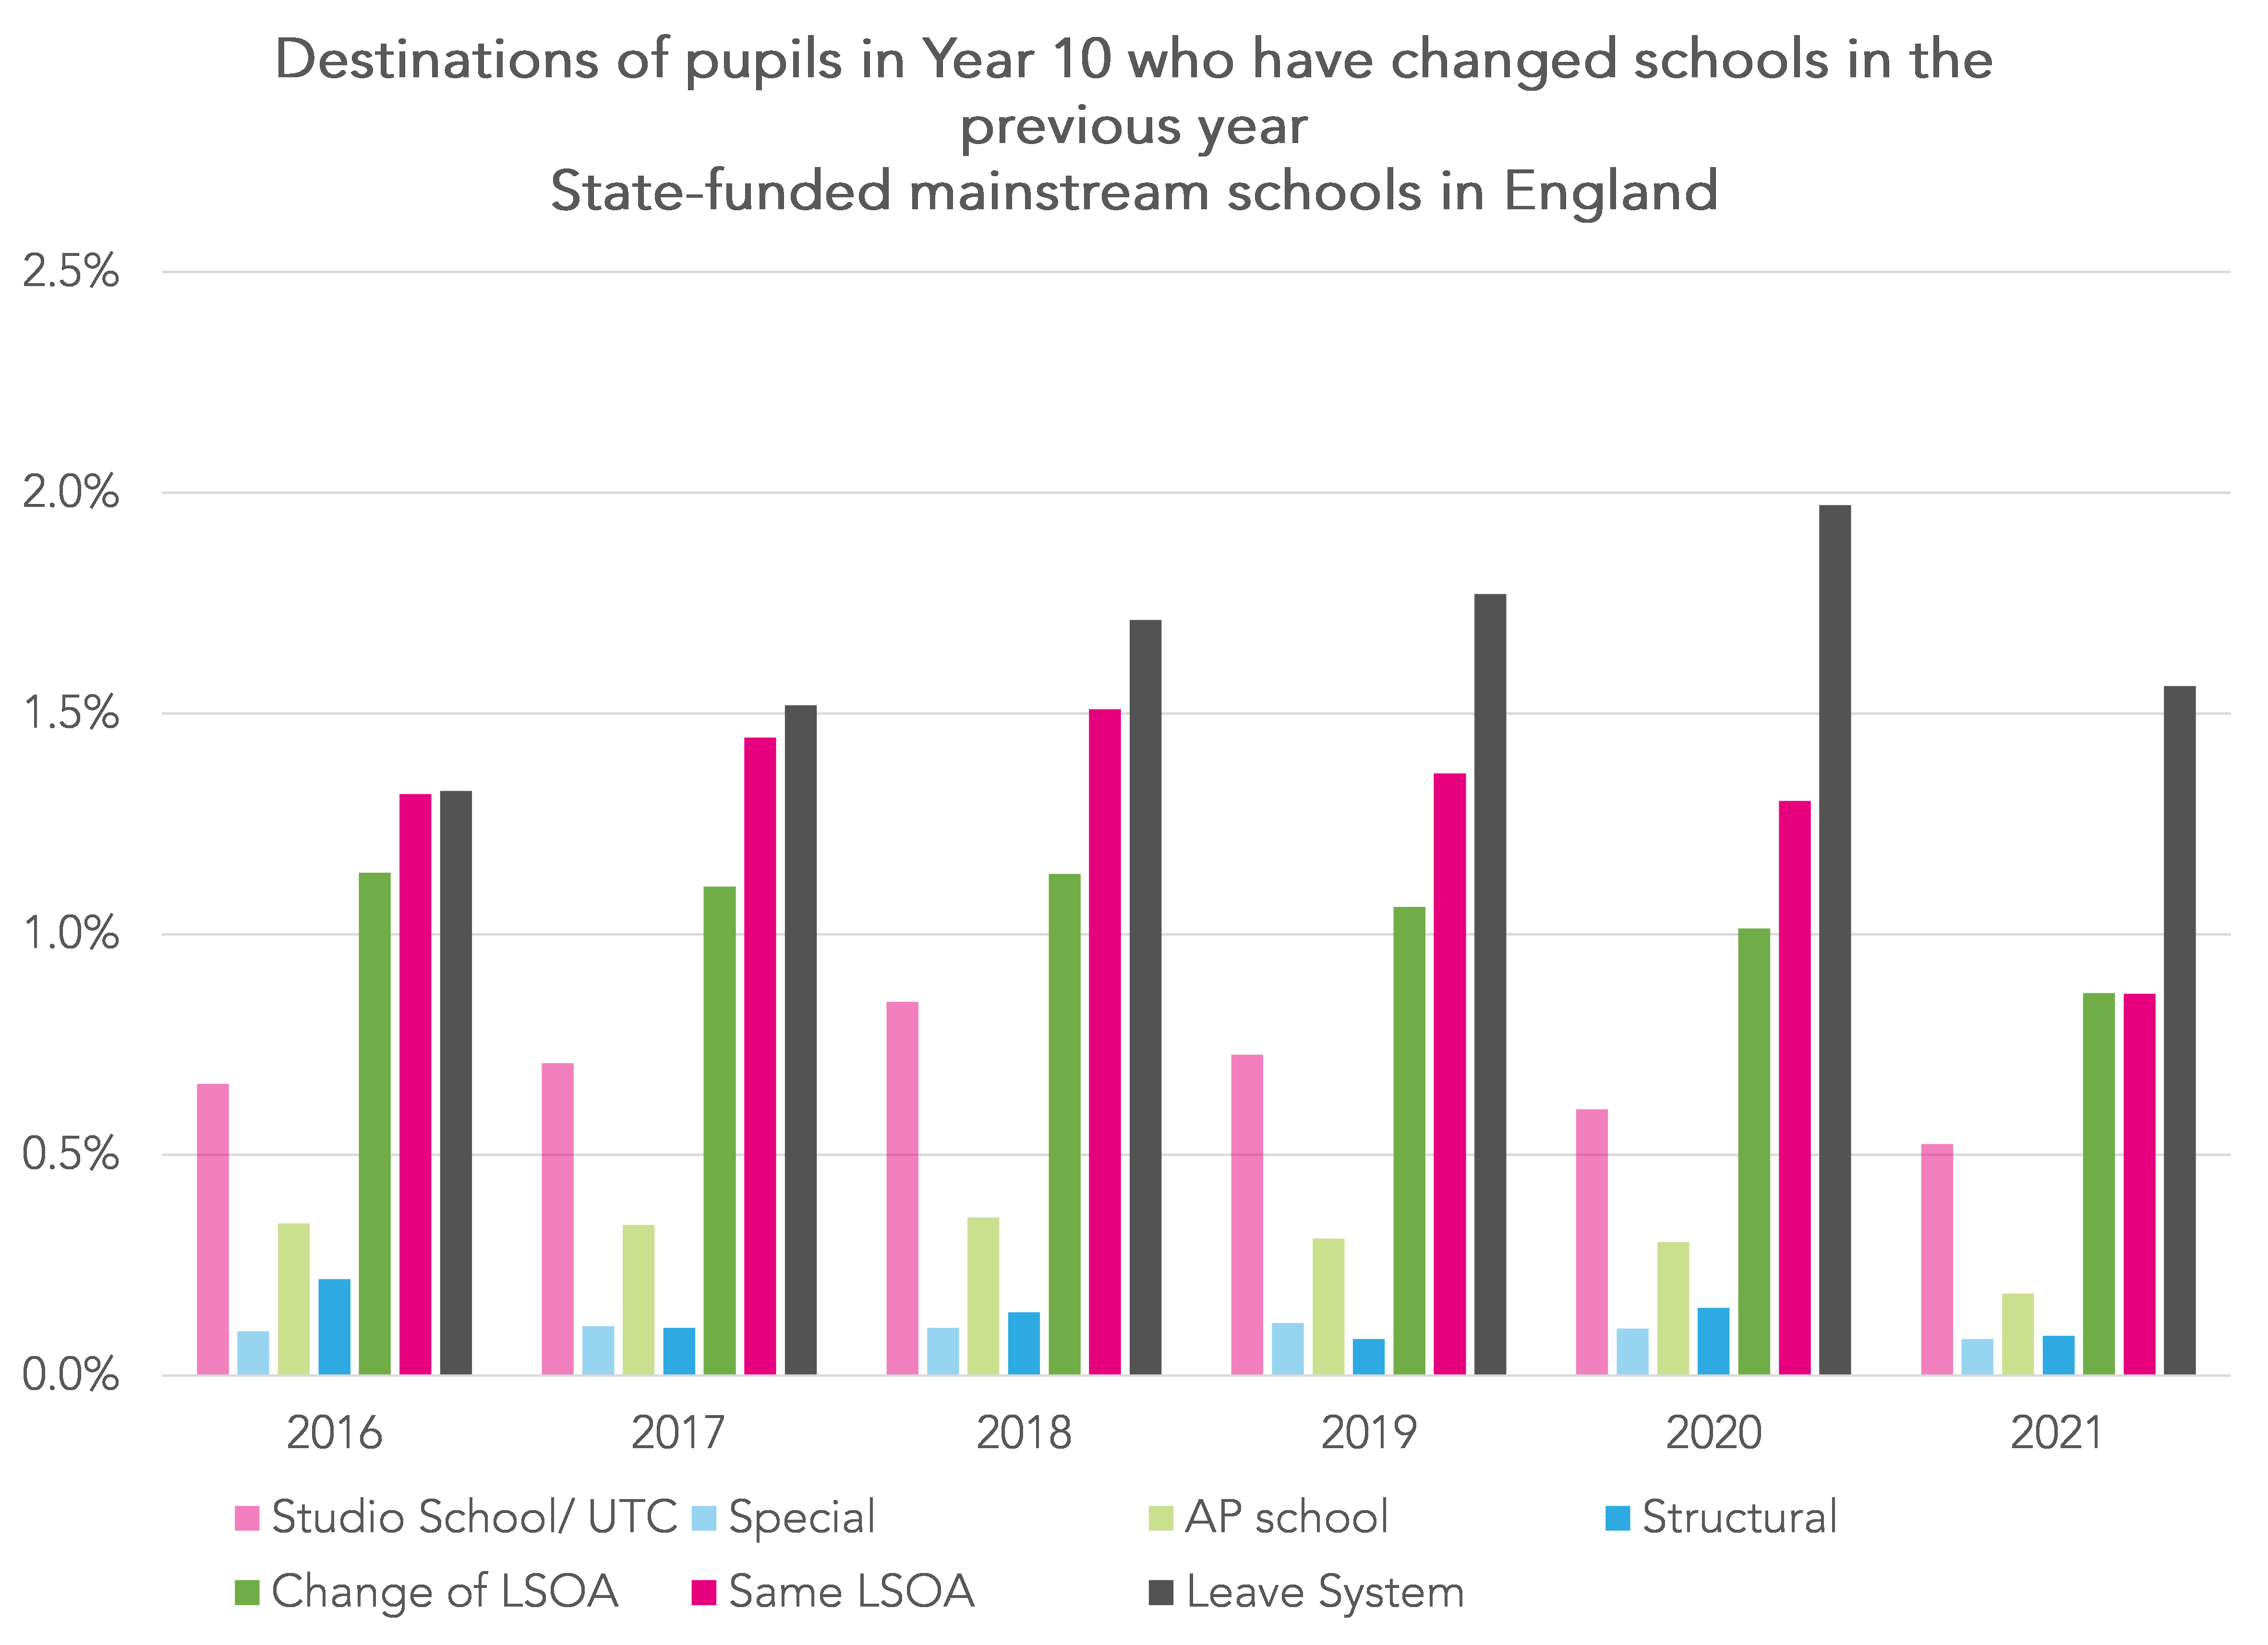
The percentage of pupils who left the state-funded school system fell between 2020 and 2021. These are pupils moving to other countries, home education, further education colleges or the independent sector, including independent AP [2]. Moves to other destinations have generally been declining.
Where do pupils go who leave the system?
In our analysis, we observe pupils leaving the state school system but we do not observe where they go to.
However, we can use another source to examine moves into some destinations, including independent schools and FE colleges.
For this, we repeat the work we last did for our Who’s Left? series back in 2019.
We again use School Census but this time include the October and May [4] collections as well as January. We identify all pupils in an age cohort who enroll for at least one term at a state-funded mainstream secondary school between age 11 and 15 (Year 7 to Year 11).
For this analysis, we use the cohort aged 15 in 2019/20 as this is the most recent Key Stage 4 data we have available. This was the cohort assessed by centre assessment grades in summer 2020.
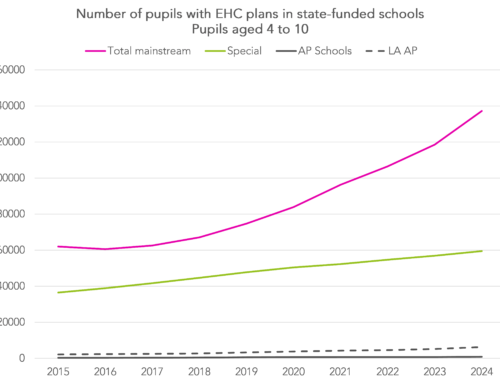
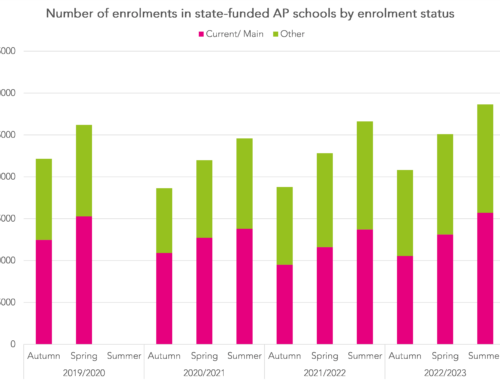
We observe 553,000 pupils aged 11 in Autumn 2016. The chart below shows the number in the cohort each term until Spring 2020. By that time, there were almost 20,000 fewer pupils in the cohort.

In fact, once we include pupils who join after Autumn 2016, we find that almost 594,000 pupils have been in the cohort at some point.
Next, we use Key Stage 4 data to identify the final destinations of the 594,000 pupils. These are summarised in the table below. We also show numbers for the two previous age cohorts as well for comparison purposes [5].

Around 92% of pupils are observed completing Key Stage 4 in mainstream schools and being included in school performance tables (SPT) indicators for their schools. A small proportion included in national results are not included in SPT, for instance recent arrivals for overseas. As SPT were not published in 2020, recent arrivals were not removed from schools’ SPT indicators.
Compared to previous years, a smaller percentage of pupils completed Key Stage 4 in AP schools although there were larger percentages in further education, local authority alternative provision and with no destination.
The 20,000 with no destination will include young people who have emigrated or were in elective home education (EHE). However, some of those in EHE may have been attributed to one of the institution types listed in the table above if they entered qualifications as an external candidate. That said, such candidates were not well served by arrangements to award centre assessment grades in 2020.
The Association of Directors of Children’s Services (ADCS) survey of local authorities suggests that around 8,000 to 10,000 of this cohort were in elective home education (EHE). In October 2019, they reported an estimate of 55,000 pupils in EHE, of which 14,000 were in Key Stage 4. By the following October, this had increased to 18,000.
Characteristics of pupils who leave the mainstream state-school system
Finally, it is worth re-iterating that pupils with additional needs are more likely to find themselves outside the state-funded mainstream system by the end of Key Stage 4.
For the 2020 cohort, we use School Census to create the following indicators:
- Ever eligible for free school meals from Reception to Year 11
- Eligible for free school meals for 80% or more terms from Reception to Year 11 (long-term disadvantaged)
- Ever on the SEN register
- Ever in receipt of a statement of SEN or an Education, Health and Care plan (EHCP)
- Ever permanently excluded up to the end of 2018/19
- Number of fixed-term exclusions up to the end of 2018/19
- Ever a persistent absentee [6] up to the end of 2018/19.

Disadvantaged pupils and those with a history of special educational needs, persistent absence and exclusions are far more likely than other pupils to complete Key Stage 4 outside the state-funded mainstream school system.
In summary
Overall then, it seems that fewer secondary-age pupils changed schools during the pandemic. We might suppose it disrupted plans for families to move, either overseas or within the UK. Less in-person learning may have also reduced disruptive behaviour and permanent exclusions and managed moves as a result.
Yet although overall moves fell, other sources (e.g. ADCS) have reported a rise in the number of pupils in elective home education.
How do we reconcile these two apparently contradictory findings?
It could well be true that more pupils moved into home education despite a reduction in the overall number of pupils leaving the state school system. This could happen if there was a much lower rate of migration to other countries (both overseas and to other parts of the UK).
It will be interesting to see by how much the numbers in EHE this October have changed when ADCS publish their next survey next month.
And we’ll update all of this again next year.
- The lower super output area (LSOA) of residence is recorded in School Census. We do not observe moves within the same LSOA.
- Death will also be a reason in rare but tragic circumstances
- This includes some pupils of sixth form age not included in our analysis
- The May (Summer) School Census was cancelled in 2020
- We have recalculated destinations for the 2018 cohort using different data sources supplied by DfE. This has led to slight differences in results compared to our previous version (LINK).
- Defined as missing 10% or more of sessions in an academic year
Want to stay up-to-date with the latest research from FFT Education Datalab? Sign up to Datalab’s mailing list to get notifications about new blogposts, or to receive the team’s half-termly newsletter.

Leave A Comment