
The gap in attainment between disadvantaged pupils and their peers is rightly given considerable attention by those at all levels of the education system.
In recent years, this gap has narrowed.
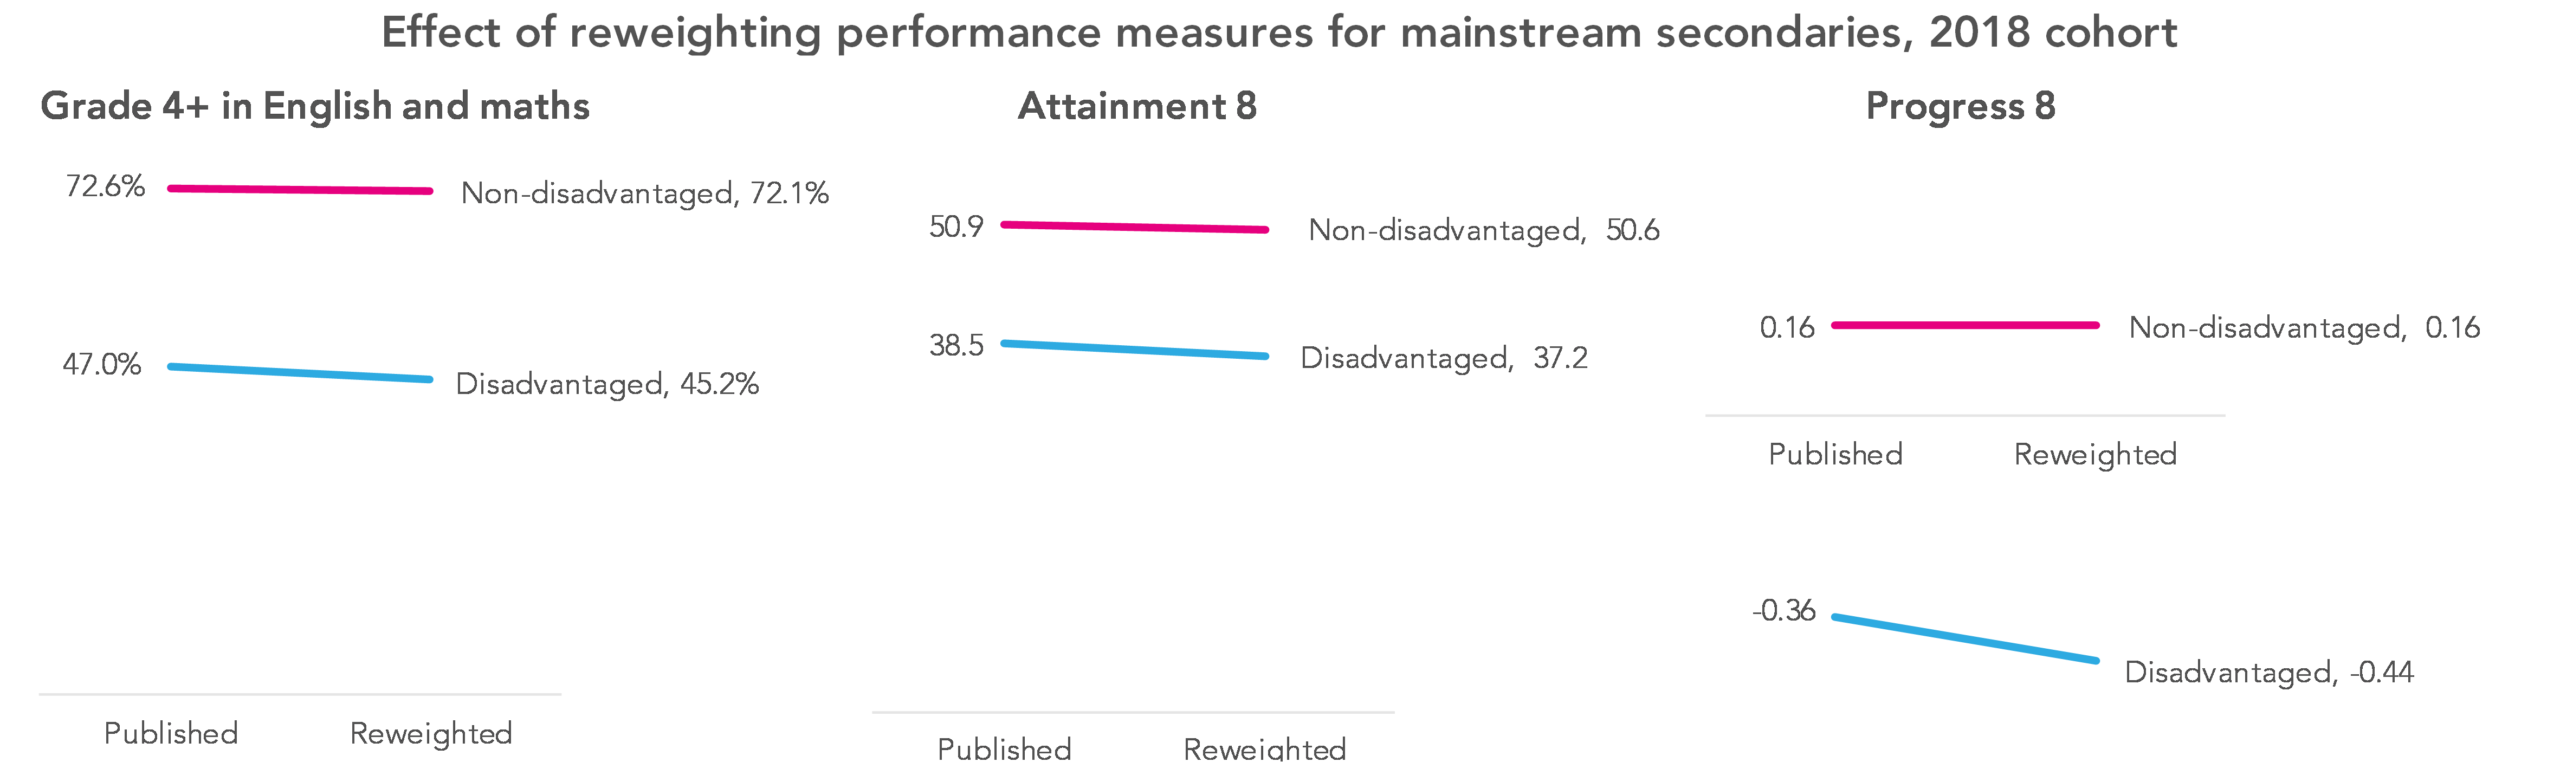
Despite this, for the cohort who sat their GCSEs in the summer of 2018, fewer than half – 47.0% – of disadvantaged pupils in mainstream schools achieved a grade 4 or above in English and maths, compared to 72.6% of non-disadvantaged pupils. (Grade 4 or above is equivalent to the old grade C or above.)[1]
But we think the real disadvantage gap is bigger than this.
School league tables and gaming
With a few exceptions, the pupils who count in a school’s GCSE results, and who get counted in national statistics, are those who remain on-roll when the school census is carried out in January of Year 11.
By and large, if you’re not on the roll of a school at this point, you don’t count in these statistics.
But only counting pupils who remain on the roll of a school towards the end of Year 11 makes for an unfair comparison between schools. Schools with highly inclusive practices are compared to schools that will have lost more of their pupils along the way. Those who leave school rolls are more likely to have low attainment. In a minority of cases, these pupils will have been lost intentionally, as a form of league table gaming, to boost apparent performance. Ofsted’s work on off-rolling bears this out.
Our proposal – and one that received the backing of the Education Select Committee last year – is that school league tables should instead take into account all pupils who have spent time on-roll at a school, in proportion to the amount of time spent on-roll.
We think that would make for a fairer system all round, and one with reduced scope for gaming.
But, what we’re going to call the real disadvantage gap is larger when you do.
Measuring the disadvantage gap
The gap in the percentage of disadvantaged and non-disadvantaged pupils achieving a grade 4 or above in English and maths currently stands at 25.6 percentage points, as mentioned above – 72.6% minus 47.0%.
But reweighting school performance measures so that all pupils are taken into account, in proportion to the amount of time they spend on a school’s roll[2], only 45.2% of mainstream schools’ disadvantaged pupils achieved a grade 4 or above in English and maths, with a smaller drop, to 72.1%, for non-disadvantaged pupils. The gap therefore goes up to 26.9 percentage points – an increase of 1.3 percentage points.
(Figures for both disadvantaged and non-disadvantaged pupils drop as we are including pupils who have left mainstream education to other destinations where attainment is lower on average.)
While that might see a small difference, improvements that we see in the disadvantage gap are often measured in fractions of a percentage point.
At individual school-level, the effect ranges from the disadvantage gap decreasing by 13.9 percentage points, to increasing by 24.4 percentage points – adding weight to the argument that in-school disadvantage gaps are not particularly meaningful. For the majority of schools the effect would be somewhere between a decrease in the disadvantage gap of 2.5 percentage points and an increase of 5 percentage points.
We see something similar – and, if anything, starker – if we look at other headline school performance measures. As the chart below shows, disadvantage gaps in Attainment 8 and Progress 8 scores grow by even more once all pupils are taken into account, in proportion to the amount of time they have spent at a mainstream school.
As we write in an accompanying blogpost, nearly 24,600 pupils from the cohort who finished secondary education in 2018 left mainstream state education and weren’t seen again, around a third of whom were disadvantaged pupils. Some of these pupils will have left England or, in a small number of sad cases, died, but we estimate that 6,700-9,200 of these pupils remained in England and yet either did not count in school league tables or else took no qualifications.
To arrive at the above figures on the disadvantage gap we’ve taken the very conservative approach of not taking into account pupils who did not take any qualifications, or, if they did, whose results are not attributed to an establishment currently, whether a state school, alternative provision or independent establishment. (Because we can’t know which of this group of pupils has left the country, the alternative would be to ascribe them all GCSE results of zero.) Our calculations show that including these pupils would only increase the size of the disadvantage gap further.
What next?
What can be done about this?
For starters, until school performance measures are reweighted to take into account all pupils, in proportion to the amount of time they have spent on-roll, there will be incentives to carry out league table gaming, which a minority will be inclined to take advantage of. While the increase in the disadvantage gap that would result makes for uncomfortable reading, that alone isn’t a reason not to do it.
We have a number of other proposals, but first read more on the increase in pupil moves off the roll of mainstream schools. (Those short on time can skip ahead to our recommendations here.)
Want to stay up-to-date with the latest research from FFT Education Datalab? Sign up to Datalab’s mailing list to get notifications about new blogposts, or to receive the team’s half-termly newsletter.

1. These figures are our own calculations and differ slightly from those in published Department for Education statistics. The DfE’s data includes further education colleges, special schools, university technical colleges and studio schools, but our figures relate strictly to mainstream schools.
2. This post is from our previous iteration of Who’s Left – but the reweighting approach described there is the same one that we applied this time.


“school league tables should instead take into account all pupils who have spent time on-roll at a school, in proportion to the amount of time spent on-roll.”
How do we make this become statutory policy?
The disadvantage gap although real is accounted for by the lower cognitive ability of disadvantaged pupils as recorded in Cognitive Ability Test (CATs) data. See P 10 of this GL Assessment Report. (GL Assessment produce and market CATs)
https://lesacreduprintemps19.files.wordpress.com/2012/02/glassessment.pdf
This in no way invalidates the important points about off-rolling made in the article.
I discuss the ‘attainment gap’ fallacy of blaming schools and/or class prejudice in many articles on my website of which this is a good place to start.
https://rogertitcombelearningmatters.wordpress.com/2018/05/03/like-any-country-talent-is-spread-evenly-its-education-and-opportunity-that-isnt-or-not/
The truth is that ‘good and outstanding schools’, as defined by DfE performance measures echoed by OfSTED inspectors who really should know better, are overwhelmingly those that can attract sub-groups of pupils with higher cognitive abilities. Every secondary head knows this, but the scope for LA community schools to do anything about it is now very limited. Local Education Authorities (LEAs) knew this and the best of them manipulated catchment areas to provide cognitively ‘balanced’ intakes, which had the additional benefit of at the same time producing cultural diversity. Academy and religious schools can design their own admissions policies that can free them from any competitive disadvantages of being primarily neighbourhood schools.
Off-rolling is just the latest tactic in the marketised education system for ensuring that the GCSE exam cohort that will generate data for OfSTED and school league tables is as cognitively able as possible.
The best way of improving school outcomes for pupils of all abilities is to prioritise the development of cognitive and other abilities over the many ways of ‘gaming’ exam results that have been developed in the Academy sector and until recently ignored by the DfE and OfSTED. See
https://rogertitcombelearningmatters.wordpress.com/2019/09/16/quality-education-needs-thinking-schools-not-behaviour-tzars-or-hero-innovators/
Hi Roger. Yes, I think I would agree.
What calculation have you used to reweight performance?
Hi Nigel, thanks for the comment. This blogpost is from our previous iteration of Who’s Left, but we used the same reweighting approach this time around as the one described in that post.
Phillip, I understand the methodology for progress 8, i.e. take a percentage of the time on your roll of the p8 scores and average across the schools. However I don’t quite understand how you would do that for Basics 4. Either a student achieves it or doesn’t, so how can you quantify a percentage of that, unless I am missing something? I’m also not sure how this affects the national percentage, is it that those that have been off rolled and don’t apper anywhere else are counted as being a fail?
Hi Nigel, thanks for your query – we’ve allocated attainment of Basics/English and maths at grade 4 or above in the same way that we have for P8. As a simplified example with three pupils:
– one of whom is on-roll for the entirety of Y7-Y11, and who achieves Basics
– one of whom is on-roll from Y7 to Y10 (80% of termly censuses), and who achieves Basics
– one of whom is on-roll from Y7 to Y10 (80% of termly censuses), and doesn’t achieve Basics
Under performance tables as they currently stand, in most cases only the first pupil would count, so the school would have a 100% Basics attainment rate.
But reweighting results we’d have (1×1+0.8×1+0.8×0)/(1+0.8+0.8)=0.692, or 69.2%. That is, attainment of basics as either a 1 or a 0, weighted by terms on-roll, then divided by the sum of the number number of terms on-roll.
In working out these reweighted results we took the conservative approach of excluding those pupils who appeared not to have taken any qualifications, or at least who didn’t count in any establishment’s results – though we also ran the numbers including these pupils and setting their attainment to zero, and the gap increased further.
Hope that’s of use.
I’d be interested in what proportion of disadvantaged students are on roll at selective schools. My impression is that the figure is well below the national average. Perhaps these schools should be expected to take a fair proportion, and possibly not linked to the student’s level of ability as determined by testing at age ten/KS2 scores, because this may well be affected by their ‘disadvantaged’ status.
I recommend that FFT looks into this issue, because it could be a real vehicle for social change if more disadvantaged students are on roll at ‘outstanding’ grammar schools.
Hi David. Your impression is correct. Using the standard FSM6 measure, 7% of pupils in the 2018 KS4 cohort in selective schools were disadvantaged (cf. 27% in non-selective state-funded mainstream schools). <1% were long-term disadvantaged (nearly 8% in other schools).
Thanks for all the insights you bring to the data. It is always illuminating. I’d like to point out that I think your graphic is misleading though, as each of the 3 graphs seems to be on a different scale. In particular the progress 8 graph is on a very different scale to the others it is alongside.
Hi Catherine, I’m glad you find our analysis helpful – that’s always good to hear. The scales on the chart are different, but the intention wasn’t to mislead – it was done on the thinking that readers would by and large expect to see those performance measures on different scales.
What are the downsides to this proposal? Could these be clearly stated? Then assessed in terms of how they are ameliorated? I’ve seen so much tail chasing over the years as a new problem is invented to solve an old one…