In July last year we looked at how many pupils had taken qualifications in creative subjects between 2015 and 2022. We saw that entries had declined somewhat in performing arts and music, but remained fairly stable in art and design.
Today we’re going to extend this in two ways:
- See how patterns in entries to these subjects varied by school-level disadvantage
- Calculate the proportion of schools where no pupils took a qualification in each creative subject, and see how this varied by school-level disadvantage.
In the previous post and throughout this one, when we talk about a creative “subject”, we’re actually talking about a group of subjects. For example, “performing arts” includes qualifications in dance and drama, as well as others. The full list of subjects included in each group can be found here (pdf).
Trend in entries – overall
We’ll start by looking at the percentage of pupils[1] entered for qualifications in each subject over time. As we did in our previous blog on the topic, we’ll divide qualifications into three groups:
- GCSEs
- Other qualifications which are eligible for Performance Tables
- Other qualifications which are approved for use with pupils aged 16 but are not eligible for Performance Tables[2]
Here are the results:

Overall, the percentage of pupils doing any qualification in art and design fell from 31% in 2015 to 27% in 2023, in music from 9% to 7%, and in performing arts from 20% to 12%.
GCSEs have consistently been the dominant qualification in art and design subjects, while alternative qualifications in music and performing arts have become increasingly popular over time.
In 2023, the percentage of pupils entered for a GCSE qualification in art and design was 26%, in music 4%, and in performing arts 8%.
Trend in entries by school-level disadvantage
Let’s now see how entries varied by school-level disadvantage. To do this, we’ll divide schools into five groups (quintiles) according to the percentage of their pupils who were eligible for free school meals in the six years leading up to the end of Key Stage 4 (labelled FSM6 in the charts).
Below we plot the percentage of pupils entered for a qualification in each creative subject by school FSM6 quintile, with one plot per year.
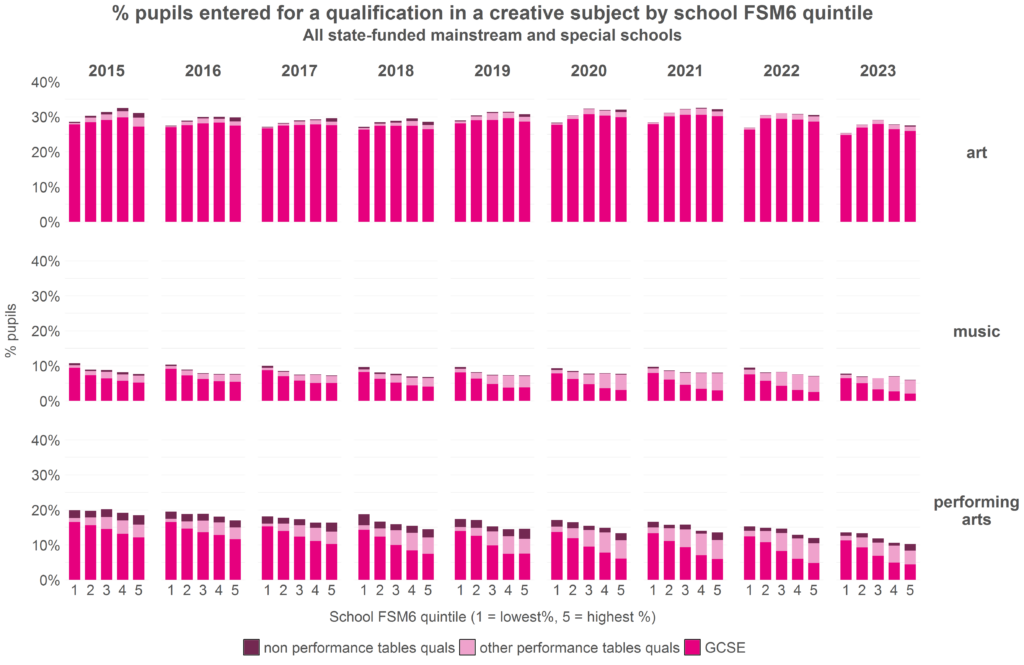
There are a few interesting things here. First, the pattern in entries by school FSM6 quintile isn’t the same across all subjects – in art and design, pupils in schools with the lowest percentage of disadvantaged pupils had the lowest entry rates, whereas in music and performing arts, pupils in schools with the highest percentage of disadvantaged pupils had the lowest rates.
Secondly, in performing arts and particularly music, non-GCSE qualifications were more commonly taken by pupils in schools with more disadvantaged pupils than fewer, and this pattern has become increasingly pronounced over time. It’s likely that much of this is due to disadvantaged pupils tending to have lower prior attainment, on average, than other pupils.
Finally, the difference in entry rates to performing arts between pupils in schools with the most and least disadvantaged pupil populations grew from 1.4 percentage points in 2015 to 3.2 percentage points in 2023.
Trend in entries by region
Now let’s look at how entries have changed over time in each region. In this chart, each plot will show the percentage of pupils entered by year, and there’ll be one plot per region.
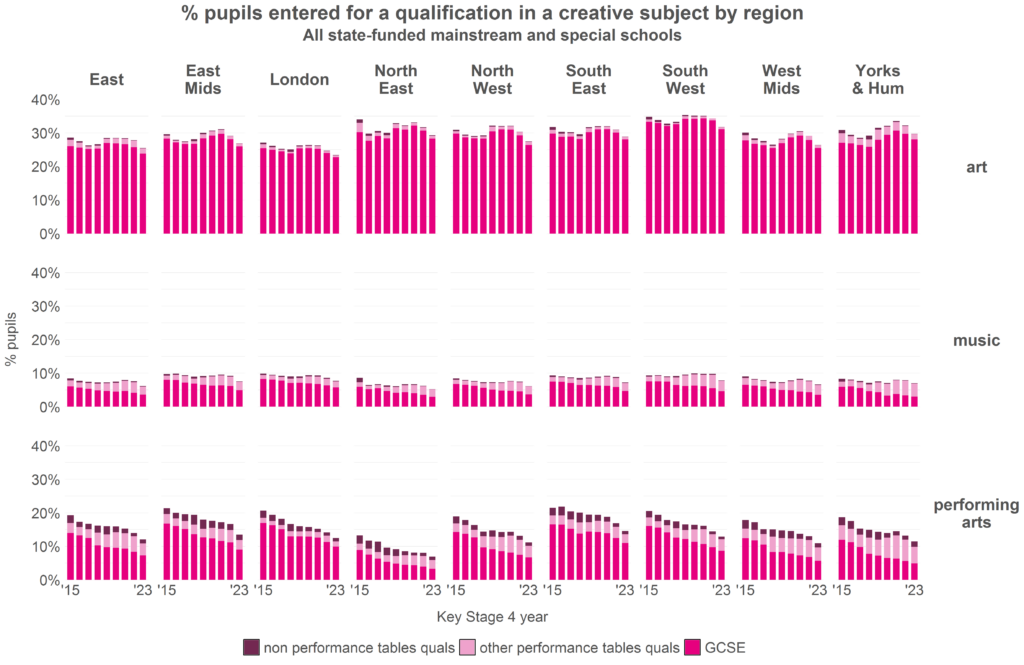
Broadly, most regions followed a similar pattern to the national picture – a small overall decline in entries to art and music with a few increases along the way, and a sustained decline in entries to performing arts.
To see the differences between regions more clearly, let’s look at 2023’s entries:
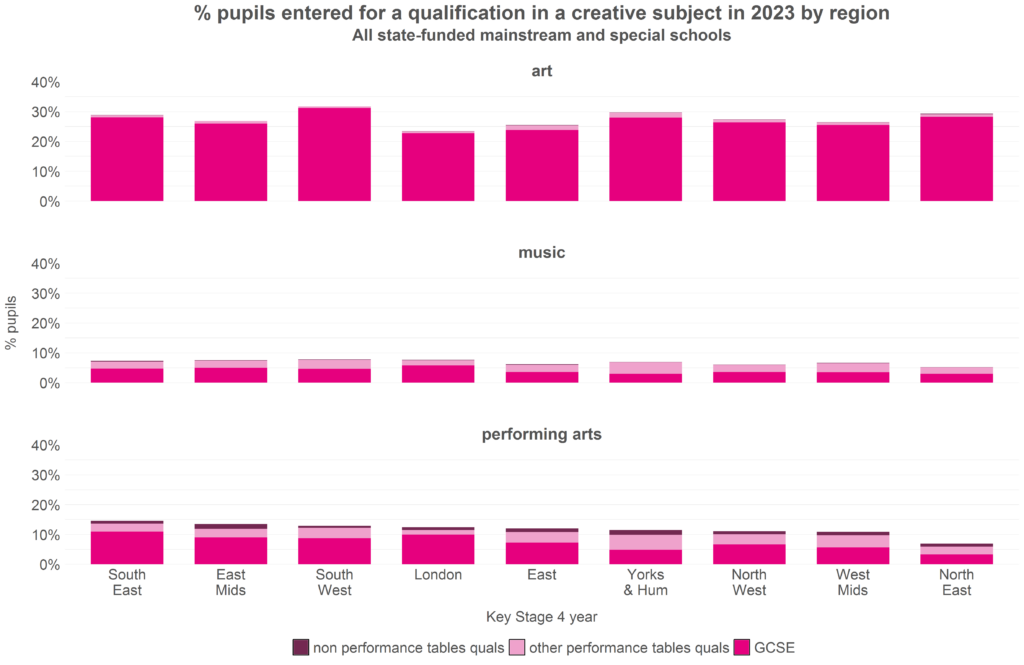
Entry rates for performing arts subjects were lowest in the North East, with only 7% of pupils entered. This is around 4 percentage points lower than the region with the next lowest rates, the West Midlands (11% of pupils) and 8 percentage points lower than the region with the highest rates, the South East (15% of pupils).
The North East also had the lowest entry rates for music (5% of pupils), while the South West had the highest (8% of pupils).
The South West also had the highest entry rates for art (32% of pupils), while London had the lowest (23% of pupils).
There is also regional variation in the types of qualifications entered. For example, while performing arts entries were similar overall in London and Yorkshire and the Humber (12.4% of pupils in London, 11.4% in Yorkshire and the Humber), around 80% of entries in London were to GCSE qualifications, compared to around 40% in Yorkshire and the Humber.
Schools where no pupils were entered for creative subjects
We now move on to look at the proportion of schools where no pupils were entered for a qualification in each creative subject. In principle, these are schools where pupils couldn’t have taken that subject even if they’d wanted to.
We’ll show this in two ways: the proportion of schools where no pupils took a GCSE qualification in a given subject, and the proportion of schools where no pupils took any type of qualification[3]. And we’ll exclude any schools which we would expect to have a non-standard curriculum, specifically special schools, studio schools, UTCs and FE colleges.
Below, we plot this by Key Stage 4 year.

There were very few schools where no pupils took GCSE art, and even fewer where no pupils took any qualification in art. This stayed constant over time.
There was an increase in the percentage of schools where no pupils did music or performing arts, however – from 7% in 2015 to 14% in 2023 for music, and from 4% to 9% in performing arts.
There was an increase in the percentage of schools where no pupils did a GCSE in music or performing arts every year from 2015 to 2023, with the biggest year on year increase between 2017 and 2018.
We now look at the how this varies by school FSM6 quintile, with one plot per KS4 year. We’ll limit it to just performing arts and music, as there were so few schools nationally with no entries in art.
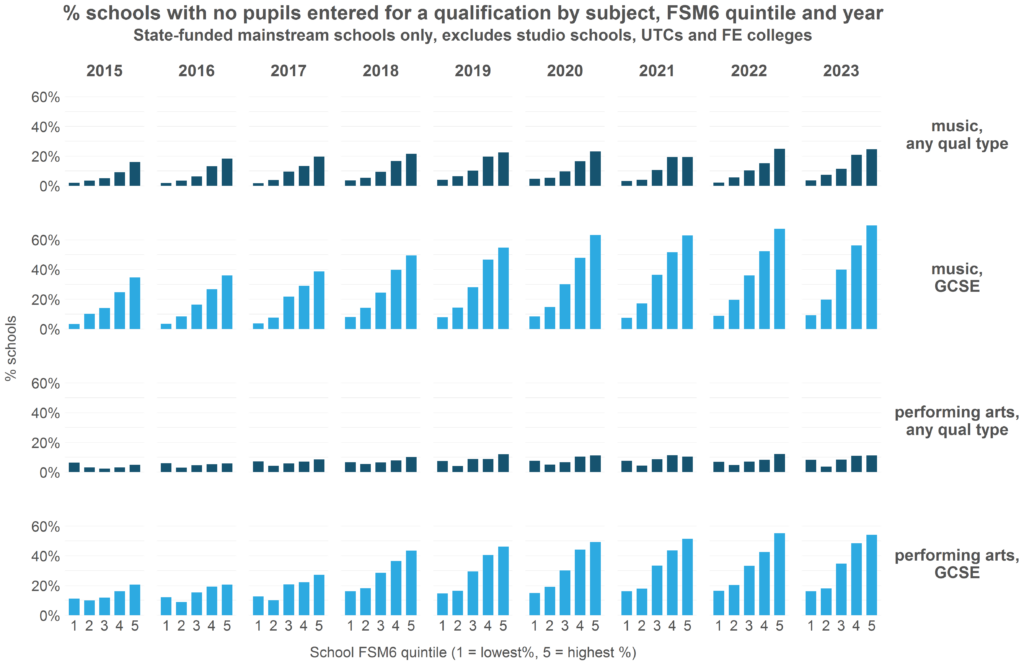
Access to creative subjects tended to decrease with increasing school-level disadvantage, particularly in music, and this pattern has persisted over time.
In 2023, only 4% of schools with the least disadvantaged populations had no music entries, compared to 25% of schools with the most disadvantaged populations. The equivalent figures for performing arts were 8% and 11%.
The pattern is more acute for GCSEs, though some of this is likely explained by schools with higher levels of disadvantage tending to also have lower levels of prior attainment. In 2023, 9% of schools with the lowest levels of deprivation had no entries for GCSE music, compared with 70% of schools with the highest levels of deprivation. For performing arts, the equivalent figures were 16% and 54%.
To finish, we’ll look at the how the proportion of schools with no pupils entered for music or performing arts varied by region in 2023.
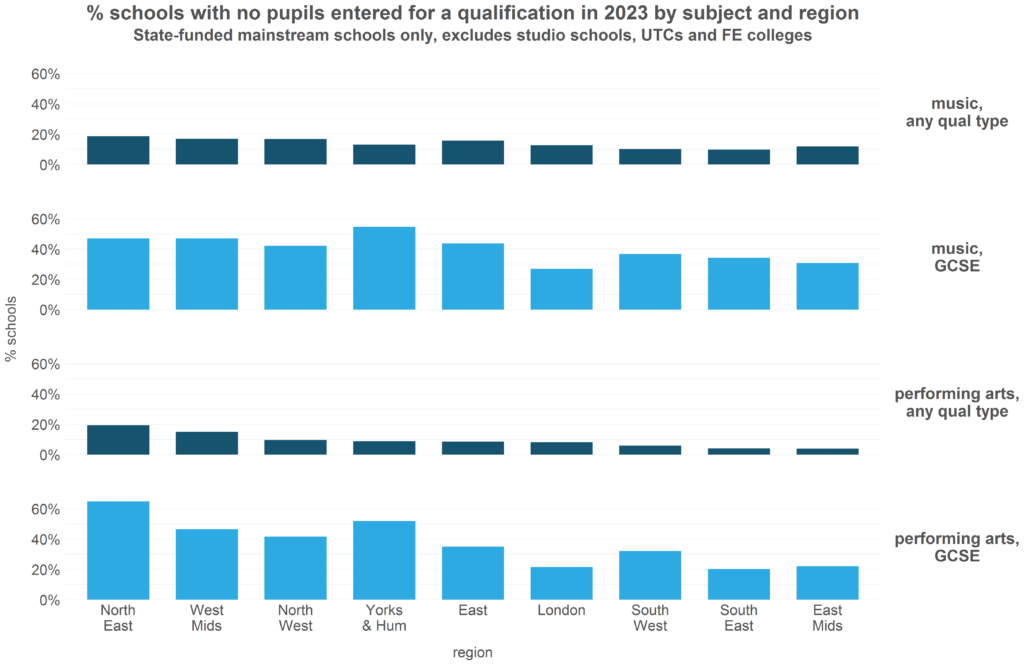
In most regions, fewer than 10% of schools had no pupils entered for performing arts. The exceptions were the North East (19% of schools with no pupils entered), and the West Midlands (15% of schools). In the South East and the East Midlands, 4% of schools had no pupils entered for performing arts.
There was less variation between regions when looking at the same metric for music. The North East again had the highest proportion of schools with no pupils entered (19%), and the West Midlands the second highest (17%). The South East had the lowest proportion (10%).
Summing up
Between 2015 and 2023 there has been a small drop in the percentage of pupils achieving a qualification in art, music, or performing arts.
There has also been a drop in the percentage of schools appearing to offer qualifications in music or performing arts.
Pupils in schools with the most disadvantaged populations were least likely to take music or performing arts (and where they did, they were least likely to be taking GCSEs in these subjects). And they were also most likely to be in a school where these qualifications weren’t available to them.
Want to stay up-to-date with the latest research from FFT Education Datalab? Sign up to Datalab’s mailing list to get notifications about new blogposts, or to receive the team’s half-termly newsletter.

[1] We include all pupils who reached the end of Key Stage 4 in state-funded mainstream and special schools.
[2] The specific qualifications counted in Performance Tables have changed over time. This includes what counts as a GCSE. In earlier years of the series, for example, some international GCSEs were included.
[3] By including all types of qualification, we’re likely overestimating how many schools offered a given subject, because not all qualifications are run by the school – e.g. a school with no music classes but with a few pupils who took a grade in an instrument they learned off-site would appear to be offering music


The drop off in performing arts subjects has taken place since the EBacc introduction and the emphasis on securing basket 1 and 2 of subjects. Placing Arts subjects in basket 3 has done nothing for their status as they are seen as less important by leaders and increasingly by students and parents. Lack of interest means that there is less likelihood that a dance or drama or music teacher to be appointed.
I am a dance teacher but moved up to senior leadership in 2004, following a period as a head of performing Arts. I continued to teach dance until becoming dep head then moved to a school where dance wasn’t taught. We did however hang on to drama and music. Since then and working at two other schools (all in deprived communities, performing arts has become less and less popular by students parents and seen as ‘an easy option’ by headteachers. At one school the HT even said “well if they can’t get a 5 in drama then he clearly can’t teach it’ Dance and music were viewed the same.
To get a decent grade in GCSE music really requires the student to play an instrument privately which is exclusive for disadvantaged students if schools do not provide private music tuition or fund the purchase of instruments. In heavily competitive environments and with diminishing budgets music tuition is often the first thing to get cut.
Thankyou for your interesting blog.
Completely agree about the increasing exclusivity of GCSE Music given the expense of music instrumental lessons (and instruments) and understandable lack of support from schools (secondary and primary) and Local Authority music services due to financial constraints. Combine fewer children playing instruments with higher pressure on school funding and therefore numbers needed to make a class financially viable and you see how some schools can no longer afford to offer GCSE Music even if they would ideally like to.
Yes, agreed that Ebacc has had an impact. Also, since Gove’s rigorous curriculum came in, many schools allow students one fewer option subject at GCSE – for example, my students can now only pick 3 options rather than 4. Given languages uptake is also falling, could it be the case that most options subjects have fewer candidates? Geog and History may be largely spared this effect as students think they ought to do a humanity and/or schools often mandate one.