Alternative Provision (AP) schools and special schools are poorly served by the current published measures of pupil attainment at the end of Key Stage 4.
Prior to the pandemic, we began work on calculating a range of performance measures for AP schools. This was informed by the AP Quality Toolkit produced by colleagues at the Centre for Social Justice. Some of these measures were subsequently included in the performance framework proposed by the Department of Education in the SEND green paper.
We have now updated this work based on data for the 2021/22 school year and expanded the measures of Key Stage 4 attainment to include special schools. We plan to update this in the new year using data for 2022/23.
Our report on Key Stage 4 attainment measures can be found here. There is also a second report on calculating other quality measures for the AP sector: attendance, re-integration and post-16 destinations.
The problem
School-level statistics are published for special schools but using the same metrics as those published for mainstream schools. Since 2014, a raft of qualifications have ceased to be counted in Performance Tables, including those at level 1 (equivalent to GCSE grades 1-3) and entry level that may well be appropriate for many pupils in special schools.
AP schools are even more poorly served. In addition to the issue above, no school-level statistics are published. The Department for Education (DfE) currently produces Key Stage 4 statistics for pupils in alternative provision aggregated at local authority level. However, this data includes not only pupils who attend AP schools but also pupils who are in local authority funded alternative provision. This latter group are pupils for whom local authorities are paying fees to be educated outside the state-funded school sector, including pupils placed in independent special educational needs (SEN) schools.
Our proposal
We propose that a more appropriate set of measures relating to Key Stage 4 attainment and qualifications entered are produced for AP and special schools.
The first stage of this is to count all regulated qualifications in performance measures. In the report we show how we have counted qualifications that are not currently included in published measures, such as Functional Skills.
We then create the following set of measures:
- Percentage of pupils achieving the basics (passes in English/literacy and maths/numeracy)
- At Level 2 or above (equivalent to GCSE grades 9-4)
- At Level 1 or above (equivalent to GCSE grades 3-1 or above)
- At Entry level or above
- Attainment 5 (A5)
- Score in English/ literacy
- Score in Maths/ numeracy
- Total score in any other 3 subjects
- Total A5 score (sum of the 3 “buckets” above)
- Entries
- % of pupils entering 1 or more qualifications
- % of pupils entering 1 or more qualifications in each of the 3 A5 “buckets”
- % of pupils entered for 5 qualifications in A5s
The report sets out how we have defined these measures in more detail.
Progress 5
Progress 5 is a value-added measure similar to the currently published Progress 8 measure.
However, there are two key differences.
Firstly, Attainment 5 (as defined above) is used as the outcome.
Secondly, the Attainment 5 scores of pupils in special schools are compared to those of other pupils in special schools with similar prior attainment. At present, under Progress 8, the results of pupils in special schools are compared to those in mainstream schools.
Progress 5 is then calculated separately for pupils in AP schools. In other words, it is a sector-specific measure.
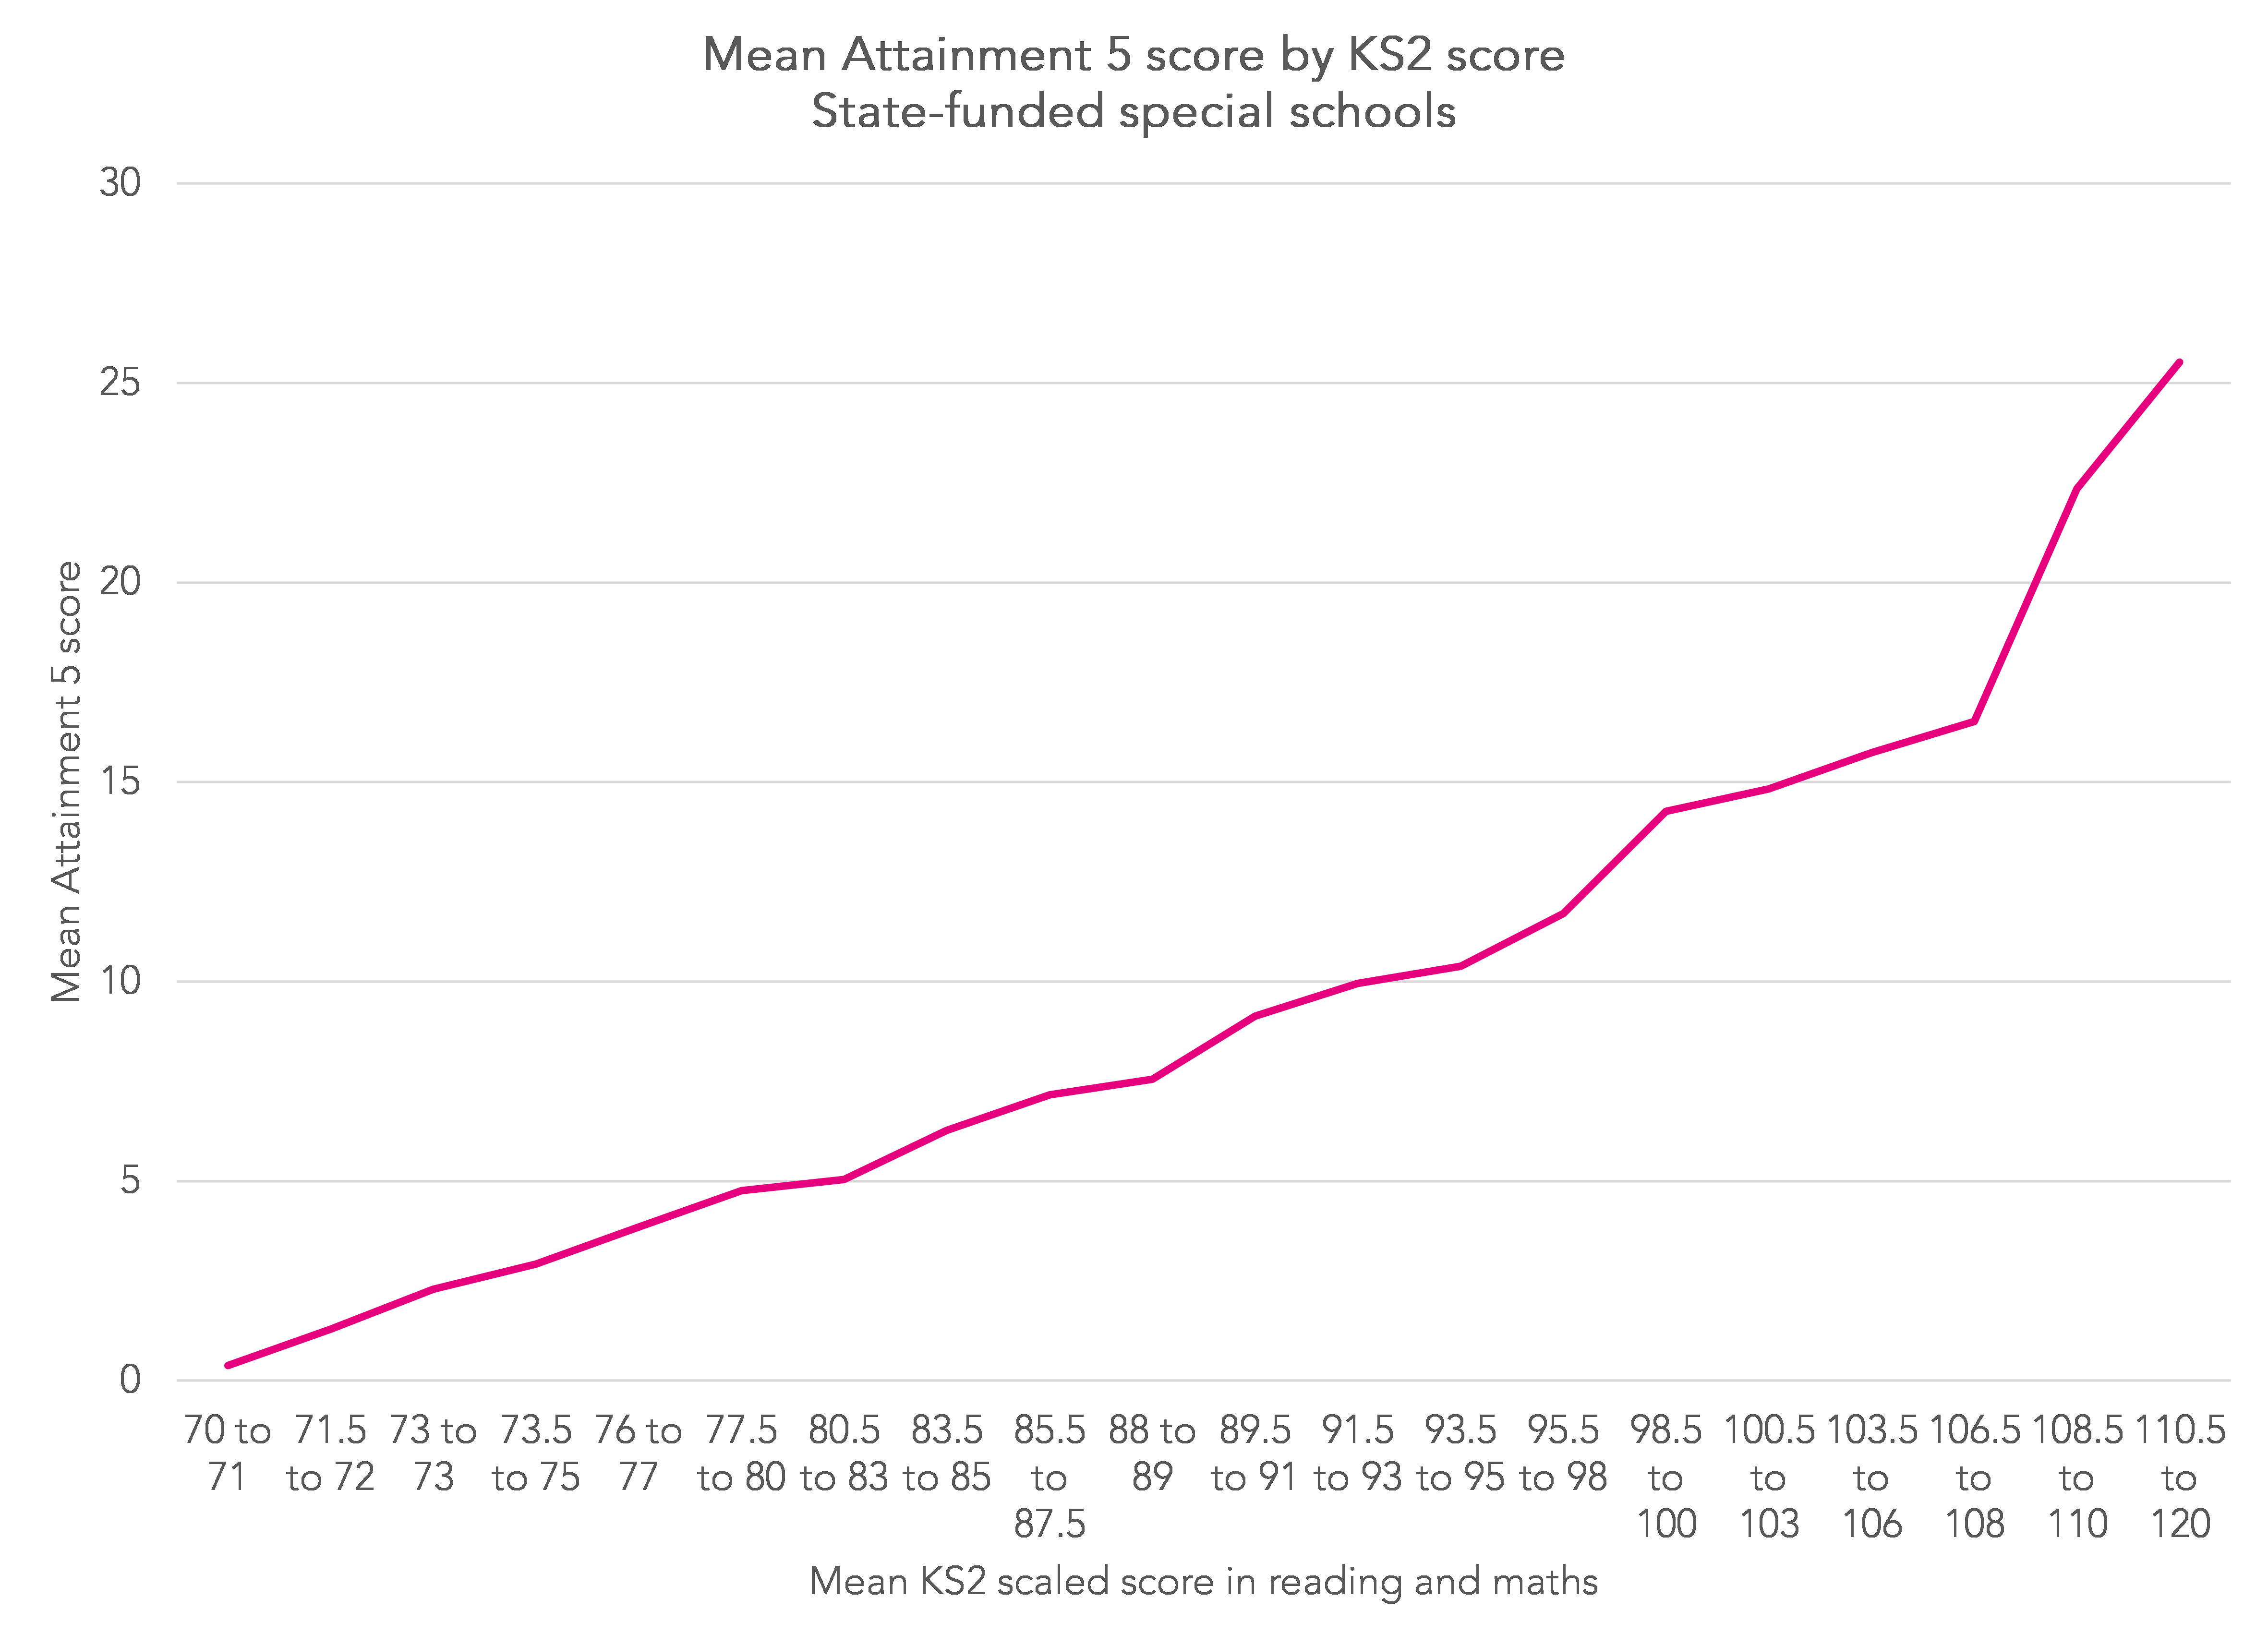
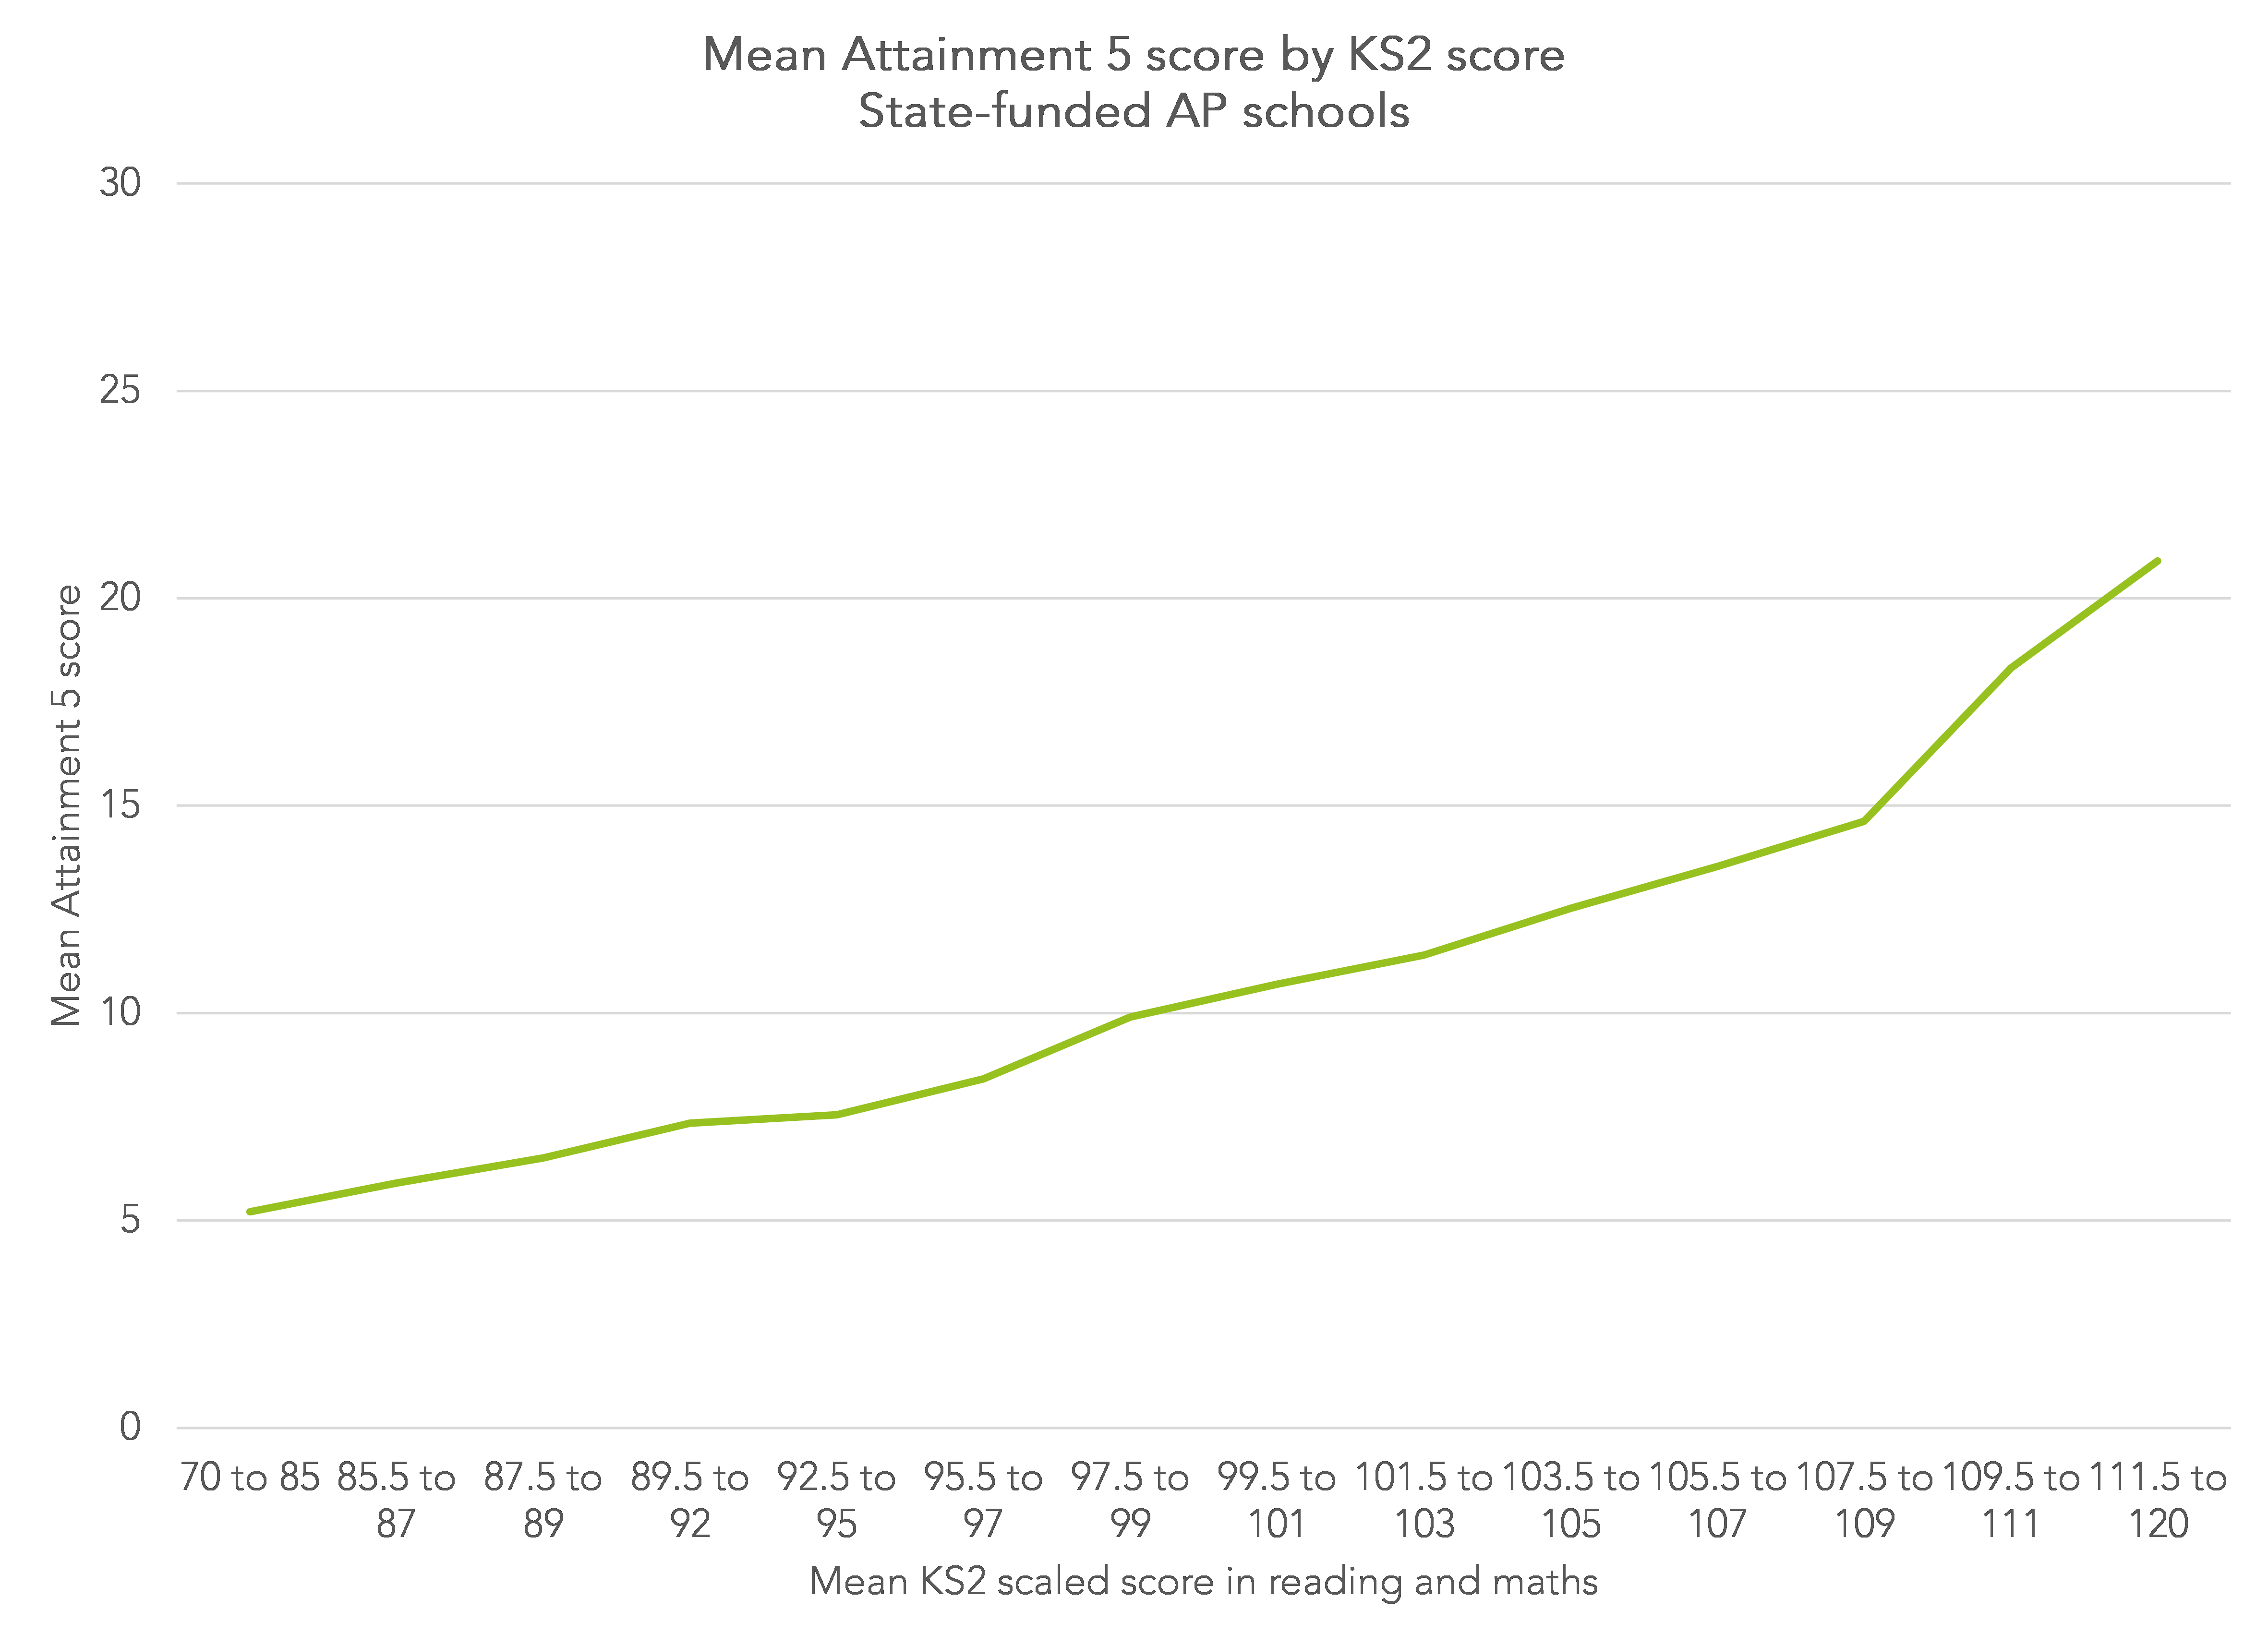
To calculate Progress 5, we first calculate “bands” of pupils based on their average Key Stage 2 result in reading and maths.
In the charts below, you can see the bands that we have created for each sector, and how Attainment 5 increases across the bands. This shows the value of adjusting performance measures for prior attainment: pupils with higher prior attainment will tend to be higher attaining at the end of Key Stage 4.
The main benefit of using Key Stage 2 data as a baseline is that it is readily available within the National Pupil Database for most pupils.
The downside is that a measure of attainment at age 11 may not reflect the attainment, or needs, of pupils when they are admitted to a special or AP school, particularly if those needs are multiple and complex.
Consequently, it is not necessarily a measure of the progress pupils have made since joining the school at which they complete Year 11. Perhaps it should be called something other than Progress 5.
Some sort of assessment on entry could be used in place of Key Stage 2 results but this would have to be a standard assessment used by all schools (or perhaps different assessments with a common core) if it were to be used in the production of national statistics.
Are school-level statistics even needed?
Many schools, particularly AP schools, have very small cohorts. Published measures will likely be extremely variable from one year to the next.
Secondly, school-level statistics are often (and wrongly) interpreted as measures of school quality. Measures may be correlated with school quality, but outcome measures are not a simple function of school quality. They are also affected by pupil attitudes, what happens at home and other factors.
Thirdly, AP schools in particular may have worked with the pupils in their Year 11 cohort for only a short time and so attainment measures may reflect more pupils’ school histories prior to joining AP.
Finally, AP and special schools have different operating models and have different pupil intakes. This affects comparison of performance measures. This can be alleviated to some extent either by comparing similar schools or by making statistical adjustments based on pupil characteristics. We covered both of these in our previous report on AP schools.
All of these are very fair objections.
But our view is that there needs to be a common set of national performance measures for both the AP and special school sectors. The attainment measures we present here are just one strand of this.
These would perhaps have more value for policy makers than school leaders. Without a set of consistent measures that are widely understood by both policy makers and school leaders there can be no improvement.

Want to stay up-to-date with the latest research from FFT Education Datalab? Sign up to Datalab’s mailing list to get notifications about new blogposts, or to receive the team’s half-termly newsletter.


This is obviously a very complex area, but you have to make a start somewhere and this is a good one. It still leaves children with the most complex needs unrecognised, but I know that it will be a real challenge to include them in any measures which rely on examinations of any level. Using KS 2 is of course tricky – we all know how difficult it is to be fair if you are a Y6 teacher!
I think this is a fab article and would resonate with a lot of leaders in special schools. We often find current performance measures as meaningless. A fab article to reflect and something I woild like to support with further. Please get in touch if needed – Oakwood Academy, Manchester