We wrote recently about the relationship between absence and attainment at Key Stage 1 this year. Unsurprisingly, we found that pupils with higher absence rates tended to have lower attainment.
But pupils are missing more school now than they were pre-pandemic. Perhaps this means that the relationship between absence and attainment has changed.
To investigate this we’ll first need to establish how attainment varied with absence pre-pandemic.
The data I’ll use to do this is from the National Pupil Database. And the pupils I’ll include are those who appeared in performance tables at Key Stage 1 or Key Stage 2 in 2019, attended a mainstream state-funded school when they took those tests, and can be matched with attendance data from the 2018/19 academic year. This is 657,354 Key Stage 1 and 634,549 Key Stage 2 pupils.
Proportion of pupils by absence
Firstly, let’s look at the distribution of pupils by their absence rates across the 2018/19 academic year.
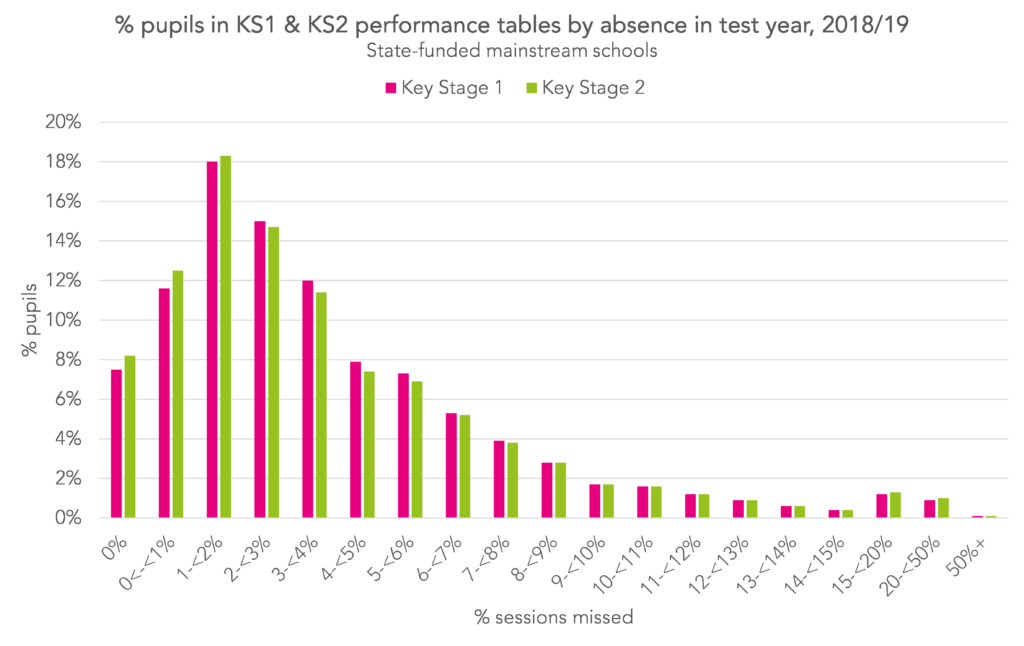
Broadly, absence rates were similar among Key Stage 1 and Key Stage 2 pupils. In both cases the “modal” (most common) absence rate was between one and two percent. And the average percentage of sessions missed was the same: 3.9%.
The same proportion of Key Stage 2 pupils were persistently absent in their test year as Key Stage 1, with 7% of pupils missing at least 10% of sessions. Key Stage 2 pupils were slightly more likely to have missed no sessions at all – 8.2% of Key Stage 2 pupils vs 7.5% of Key Stage 1.
Relationship with Key Stage 1 attainment
Attainment at the end of Key Stage 1 is measured by teacher assessments in reading, writing and maths (and science). In our population:
- 76% of pupils achieved the expected standard in reading
- 70% achieved the expected standard in writing
- 77% achieved the expected standard in maths
- 66% achieved the expected standard in reading, writing and maths
To see the relationship between Key Stage 1 attainment and absence, I’ll plot the percentage of pupils who reached the expected standard in reading, writing and maths, broken down by pupils’ absence rates in 2018/19.
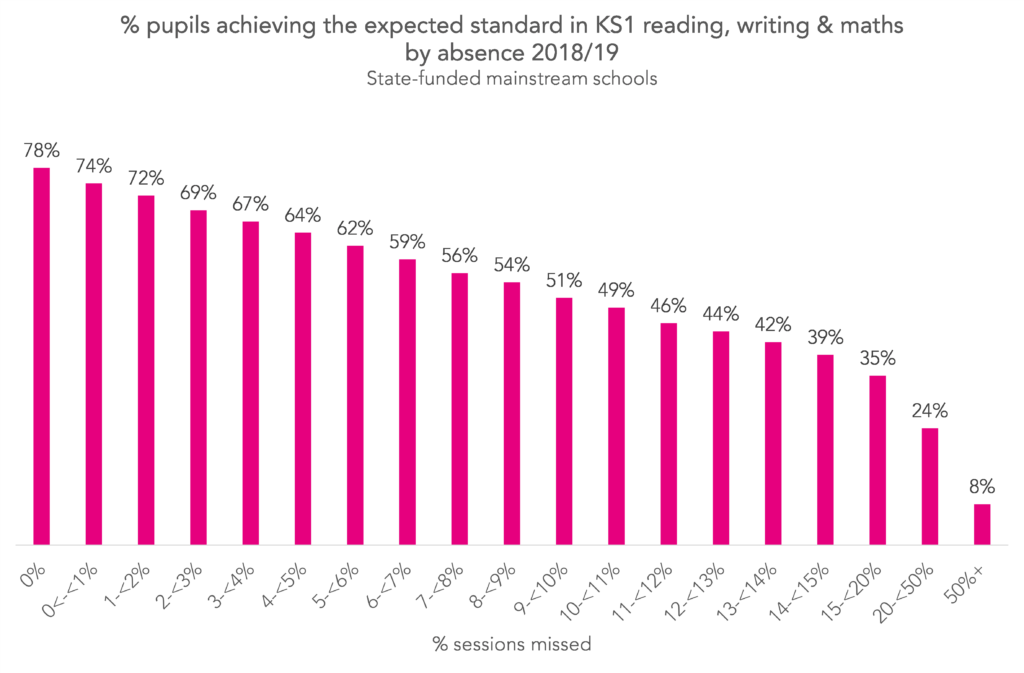
Pupils with higher absence rates had lower attainment. For example, while 78% of pupils with no absence achieved the expected standard in reading, writing and maths, only 51% of those who missed between nine and ten percent of sessions (equivalent to around a day off every fortnight) did. 40% of pupils who were persistently absent in the test year achieved the expected standard in reading, writing and maths, and 8% of those who were severely absent (missed at least 50% of sessions, a relatively small number of pupils – 584).
Despite the clear relationship here, we can’t say that higher absence caused lower attainment because there are underlying factors which cause both higher absence and lower attainment.
Relationship with Key Stage 2 attainment
Attainment at the end of Key Stage 2 is measured by tests in reading and maths, and teacher assessment in writing (and science). In reading and maths, achieving a scaled score of 100 or more is classed as having met the expected standard. In our population:
- 74% of pupils achieved the expected standard in reading
- 80% achieved the expected standard in writing
- 80% achieved the expected standard in maths
- 66% achieved the expected standard in reading, writing and maths
Again, to see the relationship with absence, I’ll plot the percentage of pupils who met the expected standard in reading, writing and maths, broken down by pupils’ 2018/19 absence rates.
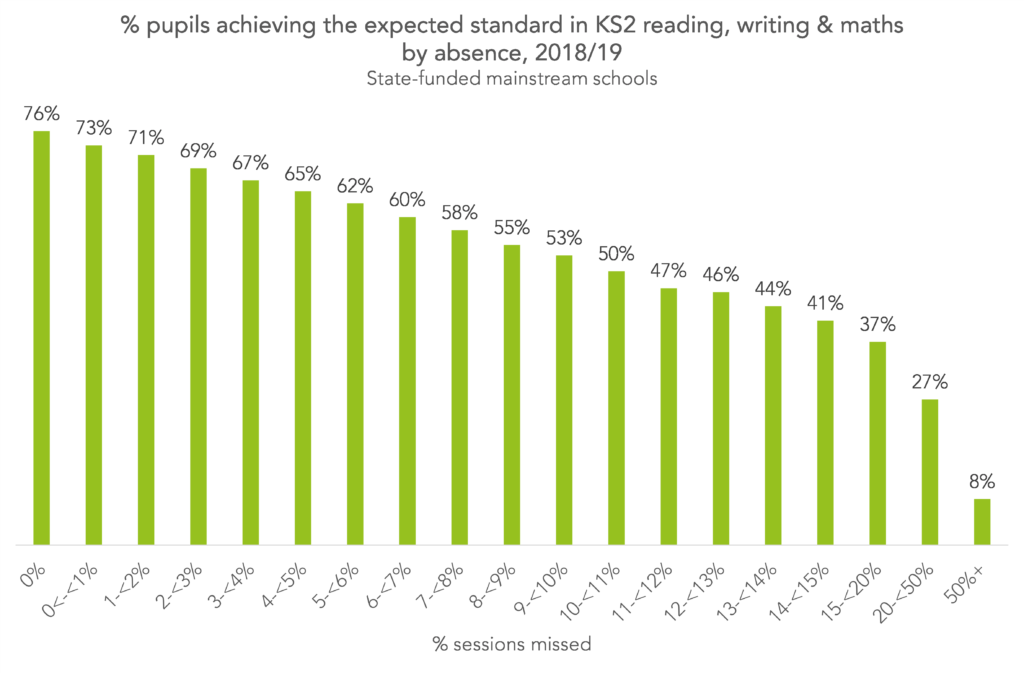
The pattern is very similar to that seen at Key Stage 1. 76% of pupils with no absence achieved the expected standard in all three subjects, compared with 42% of those who were persistently absent, and 8% of those who were severely absent (again, only a relatively small number of pupils were in this last category, this time 788).
Absence and the disadvantage gap
Disadvantaged pupils tend to miss more school than their peers, on average. And they tend to score lower in tests of attainment. To see how much of the disadvantage gap in attainment was related to differences in absence, let’s construct a (familiar, to regular readers) thought experiment:
- What if disadvantaged pupils had the same rates of absence as non-disadvantaged pupils? (But the attainment associated with a given absence rate remained unchanged.)
The impact on the percentage of pupils achieving the expected standard in reading, writing and maths at Key Stage 1 and Key Stage 2 are shown below:

If disadvantaged pupils had the same absence rates as other pupils, the disadvantage gap would have reduced from 18.5% to 14.8% at Key Stage 1, and from 18.5% to 15.4% at Key Stage 2 – a reduction of 3.7 and 3.1 percentage points, respectively.
Put another way, around a fifth of the disadvantage gap at Key Stage 1 in 2019 and around a sixth at Key Stage 2 was related to disadvantaged pupils having higher absence rates than their peers. The rest (i.e. the majority) of the gap was not related to differences in absence rates.
Want to stay up-to-date with the latest research from FFT Education Datalab? Sign up to Datalab’s mailing list to get notifications about new blogposts, or to receive the team’s half-termly newsletter.


Leave A Comment