Since our last absence roundup, at the end of Spring Term last year, we’ve had a change of Government. The new education secretary has made clear her commitment to tackling high rates of absence in schools, enacting the previous Government’s plan to increase absence fines, and expanding the use of attendance support mentors.
Now that we’re half-way through Autumn Term, let’s see if there’s any early good news.
Data
As usual, we’ll be using data from the attendance registers of schools subscribing to FFT Attendance Tracker. This year’s data covers around 2,500 secondary and 6,000 primary schools. And we’ll be looking at the period covering the beginning of September up until Friday 25th October.
End of year figures for 2023/24
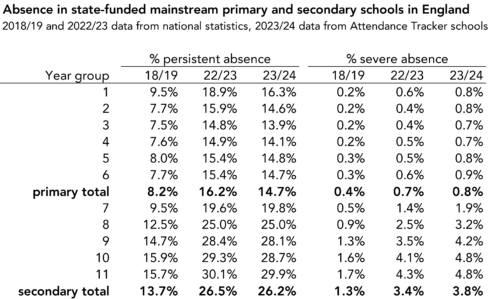
Let’s look first at how the rest of last year panned out. Below, we show the percentage of pupils classed as “persistently absent” (having missed 10% of sessions or more) and the percentage classed as “severely absent” (having missed 50% of sessions or more). We compare last year with the previous year, and with pre-pandemic[1].

Overall, persistent absence reduced slightly from the previous year, with a more noticeable drop at primary than secondary. Severe absence, however, looks to have increased slightly, both at primary and secondary.
Persistent and severe absence remain much higher than pre-pandemic, particularly at secondary.
For completeness, we provide this data by year group, below. Broadly, each year group mirrors the overall picture.
Weekly this term so far – primary vs secondary
Let’s turn now to the current academic year. Below we plot the percentage of sessions missed by pupils each week, compared with the equivalent weeks the previous year.
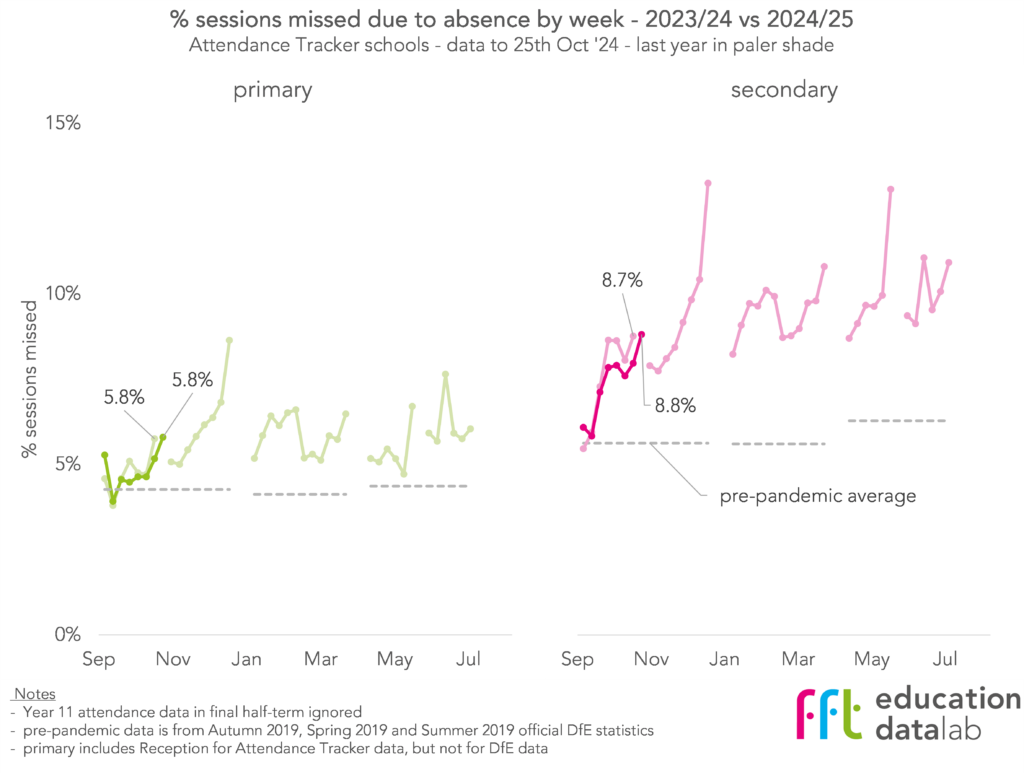
Overall, this year has been similar to last year. At primary, the weekly absence figures have been more-or-less identical, while at secondary, there was slightly less absence in the latter part of the half-term this year (apart from the week just before the break, which was the same in both years).
Overall absence by reason code
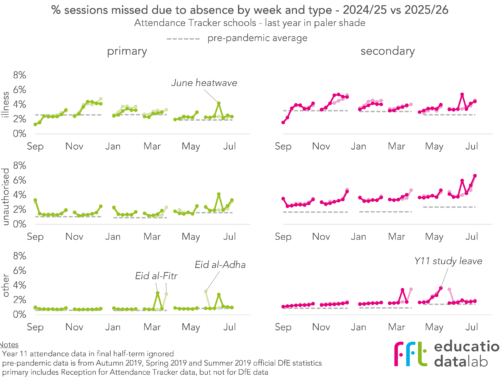
Now, let’s aggregate the percentage of sessions missed across the whole half-term, and compare with the same period last year. To give a bit more insight, we’ll categorise absences by the reason code recorded in schools’ registers.
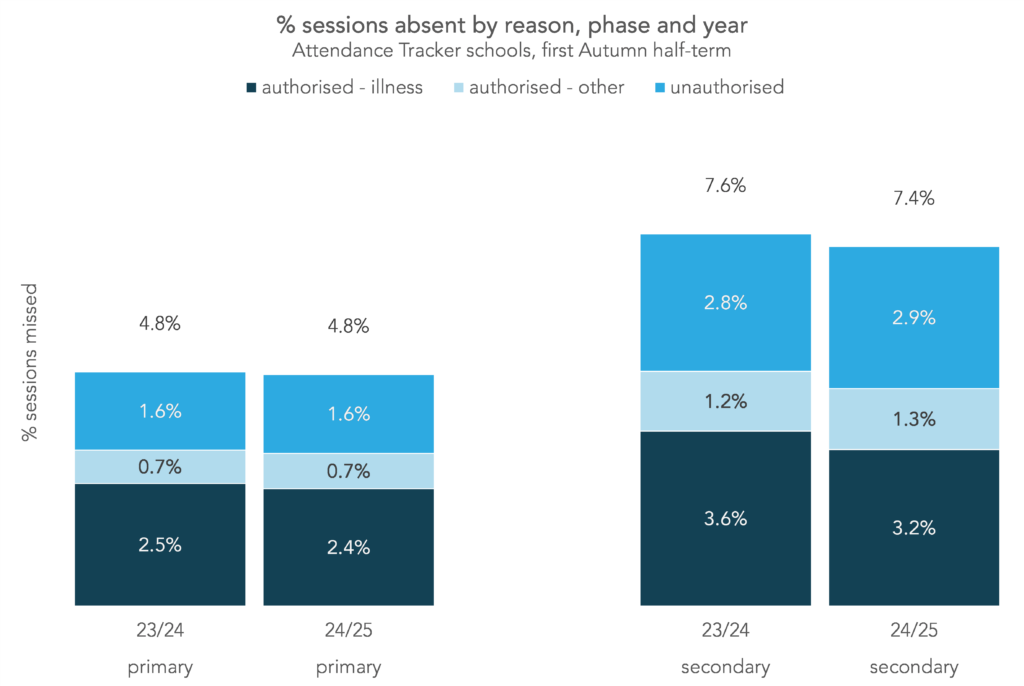
Confirming the picture we saw in the weekly figures, primary pupils have missed roughly the same percentage of sessions this year as they did last year, while secondary pupils have missed slightly fewer.
Looking at the breakdown by reason, we see that the driver of this small reduction for secondary pupils is a drop of around 10% in absence coded as illness. Unauthorised absence, and other types of authorised absence have remained roughly the same. (Though noting that some absence currently recorded as unauthorised will change to one of the other categories as schools chase reasons for absence in the most recent weeks).
The breakdown by reason code for primary pupils is almost identical in both years.
Persistent absence so far this year by region
We’ll finish by looking briefly at persistent absence. Below, we plot the percentage of pupils classed as persistently absent so far this year and compare with the same period last year. We show the figures overall, and separately for each region.
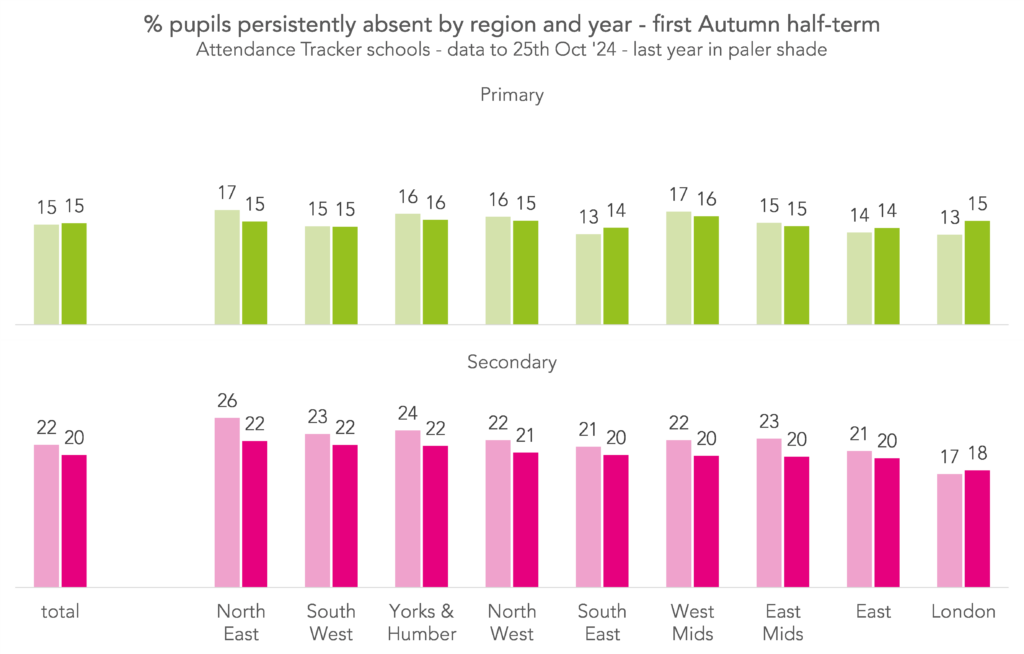
The picture for persistent absence is a familiar one – no change at primary and a slight reduction at secondary.
This is generally mirrored in each of the regions, apart from London, where persistent absence has increased (albeit only slightly) at both primary and secondary.
However, because it’s early in the year, these figures are quite volatile. Most “persistently absent” pupils will have missed just four or five days of school. We’ll get a firmer sense of how things look as the term goes on.
Summing up
The small reduction in absence at secondary this year will likely be welcome news. Unauthorised absence remaining stubbornly high will be less welcome, particularly as this is the type of absence targeted by newly increased fines.
With the approaching winter likely to bring large amounts of illness-related absence, we’ll have to wait and see whether these early patterns hold for the rest of the term.
Want to stay up-to-date with the latest research from FFT Education Datalab? Sign up to Datalab’s mailing list to get notifications about new blogposts, or to receive the team’s half-termly newsletter.


Leave A Comment