Children in need are a legally defined[1] group of children assessed as needing help and protection as a result of risks to their development or health. This group includes children on child in need plans, children on child protection plans, children looked after by local authorities, care leavers and disabled children.
Children can be referred to Children’s Social Care Services (CSC) by a number of agencies including self-referral by the family, though the most common referral sources are police, schools and healthcare services. Different local authorities have different service configurations but, broadly speaking, following referral, most children receive a social work assessment and most of these children will be considered “in need” by the authority.
Published statistics show that on 31st March 2023, 3.4% of all children aged 0-17 were defined as in need.
But how many children are ever in need up to age 18? That is a question we, along with colleagues[2], try to answer in a new article recently published in the International Journal of Population Data Science and which we summarise here.
Why we did this
Surely this is easy, you may think.
The Department for Education has collected a Children in Need Census (CIN Census) since 2008/09. This is an electronic file of data relating to children referred to (and receiving services from) Children’s Social Care Services (CSC) departments. CIN Census is a component dataset of the National Pupil Database.
Surely it’s just a case of using that to count how many children have experienced social care?
Well yes and no.
In an ideal world, we would have tracked an entire national cohort of children from birth to age 18 using the CIN Census.
However, this option was not available to us. If we took the cohort of pupils born in 2008/09 when the CIN Census was introduced, they would have only been aged 14 in the 2022/23 CIN Census[3]. Moreover, there are concerns about the quality of data in the first few years of the CIN Census.
The approach we take then is to look at three separate cohorts, each for a short period. We estimate the percentage of young people in each cohort defined as in need and then combine these estimates to cover the full 0-18 age range.
Data
We use CIN Census data from 2011/12 to 2017/18.
These cohorts were: 1) children born in 2012/13, followed to age 5 (i.e., to the day before their 6th birthday); 2) children born in 2005/06, followed from age 6 age to 12; and 3) children born in 2000/01, followed from age 13 to 17.
This work necessarily involves tracking children over time in the CIN Census. Although NPD has a unique child identifier (PMR), this is only populated when children have been observed in the school system. Young people recorded in the CIN Census are matched to NPD (itself largely composed of data collected from schools) on the basis of UPN and date of birth.
However, UPNs are only issued when a child joins a school. Before then, children in need are indexed in NPD by an identifier known as lachildid. If they continue to receive services from CSC when they join the school system then a PMR will appear and we can retrospectively assign a PMR to their lachildid.
What this means is that many children who receive services from CSC before they enter school are never allocated with a PMR in NPD. In addition, any that move from one LA to another will have more than one lachildid if they receive services from both. This introduces a risk of double-counting. As a result, we undertake some sensitivity analysis to test its possible impact on our results.
We also undertake a range of data cleaning tasks before embarking on the analysis. More on this can be found in the supplementary material of our article. R code for cleaning CSC data can also be found in a GitHub repository.
Results
We begin by trying to identify “new” cases of children in need at each age from 0-17.
We do this separately for three age cohorts, observing cohort 1 from age 0 to 5, cohort 2 from age 6 to 12 and cohort 3 from age 13 to 17. For cohorts 2 and 3 we make an estimate of the number of cases we observe that we think might have previously been in need[4]. We refer to these as discounted cases.
The number of new cases at each age is then expressed as a proportion of the population “at risk” of becoming a child in need (CiN) for the first time, which is the ONS mid-year population estimate minus the number of young people previously classified as CiN. This is known as a hazard rate: the probability that an event will happen given that it has not already happened.
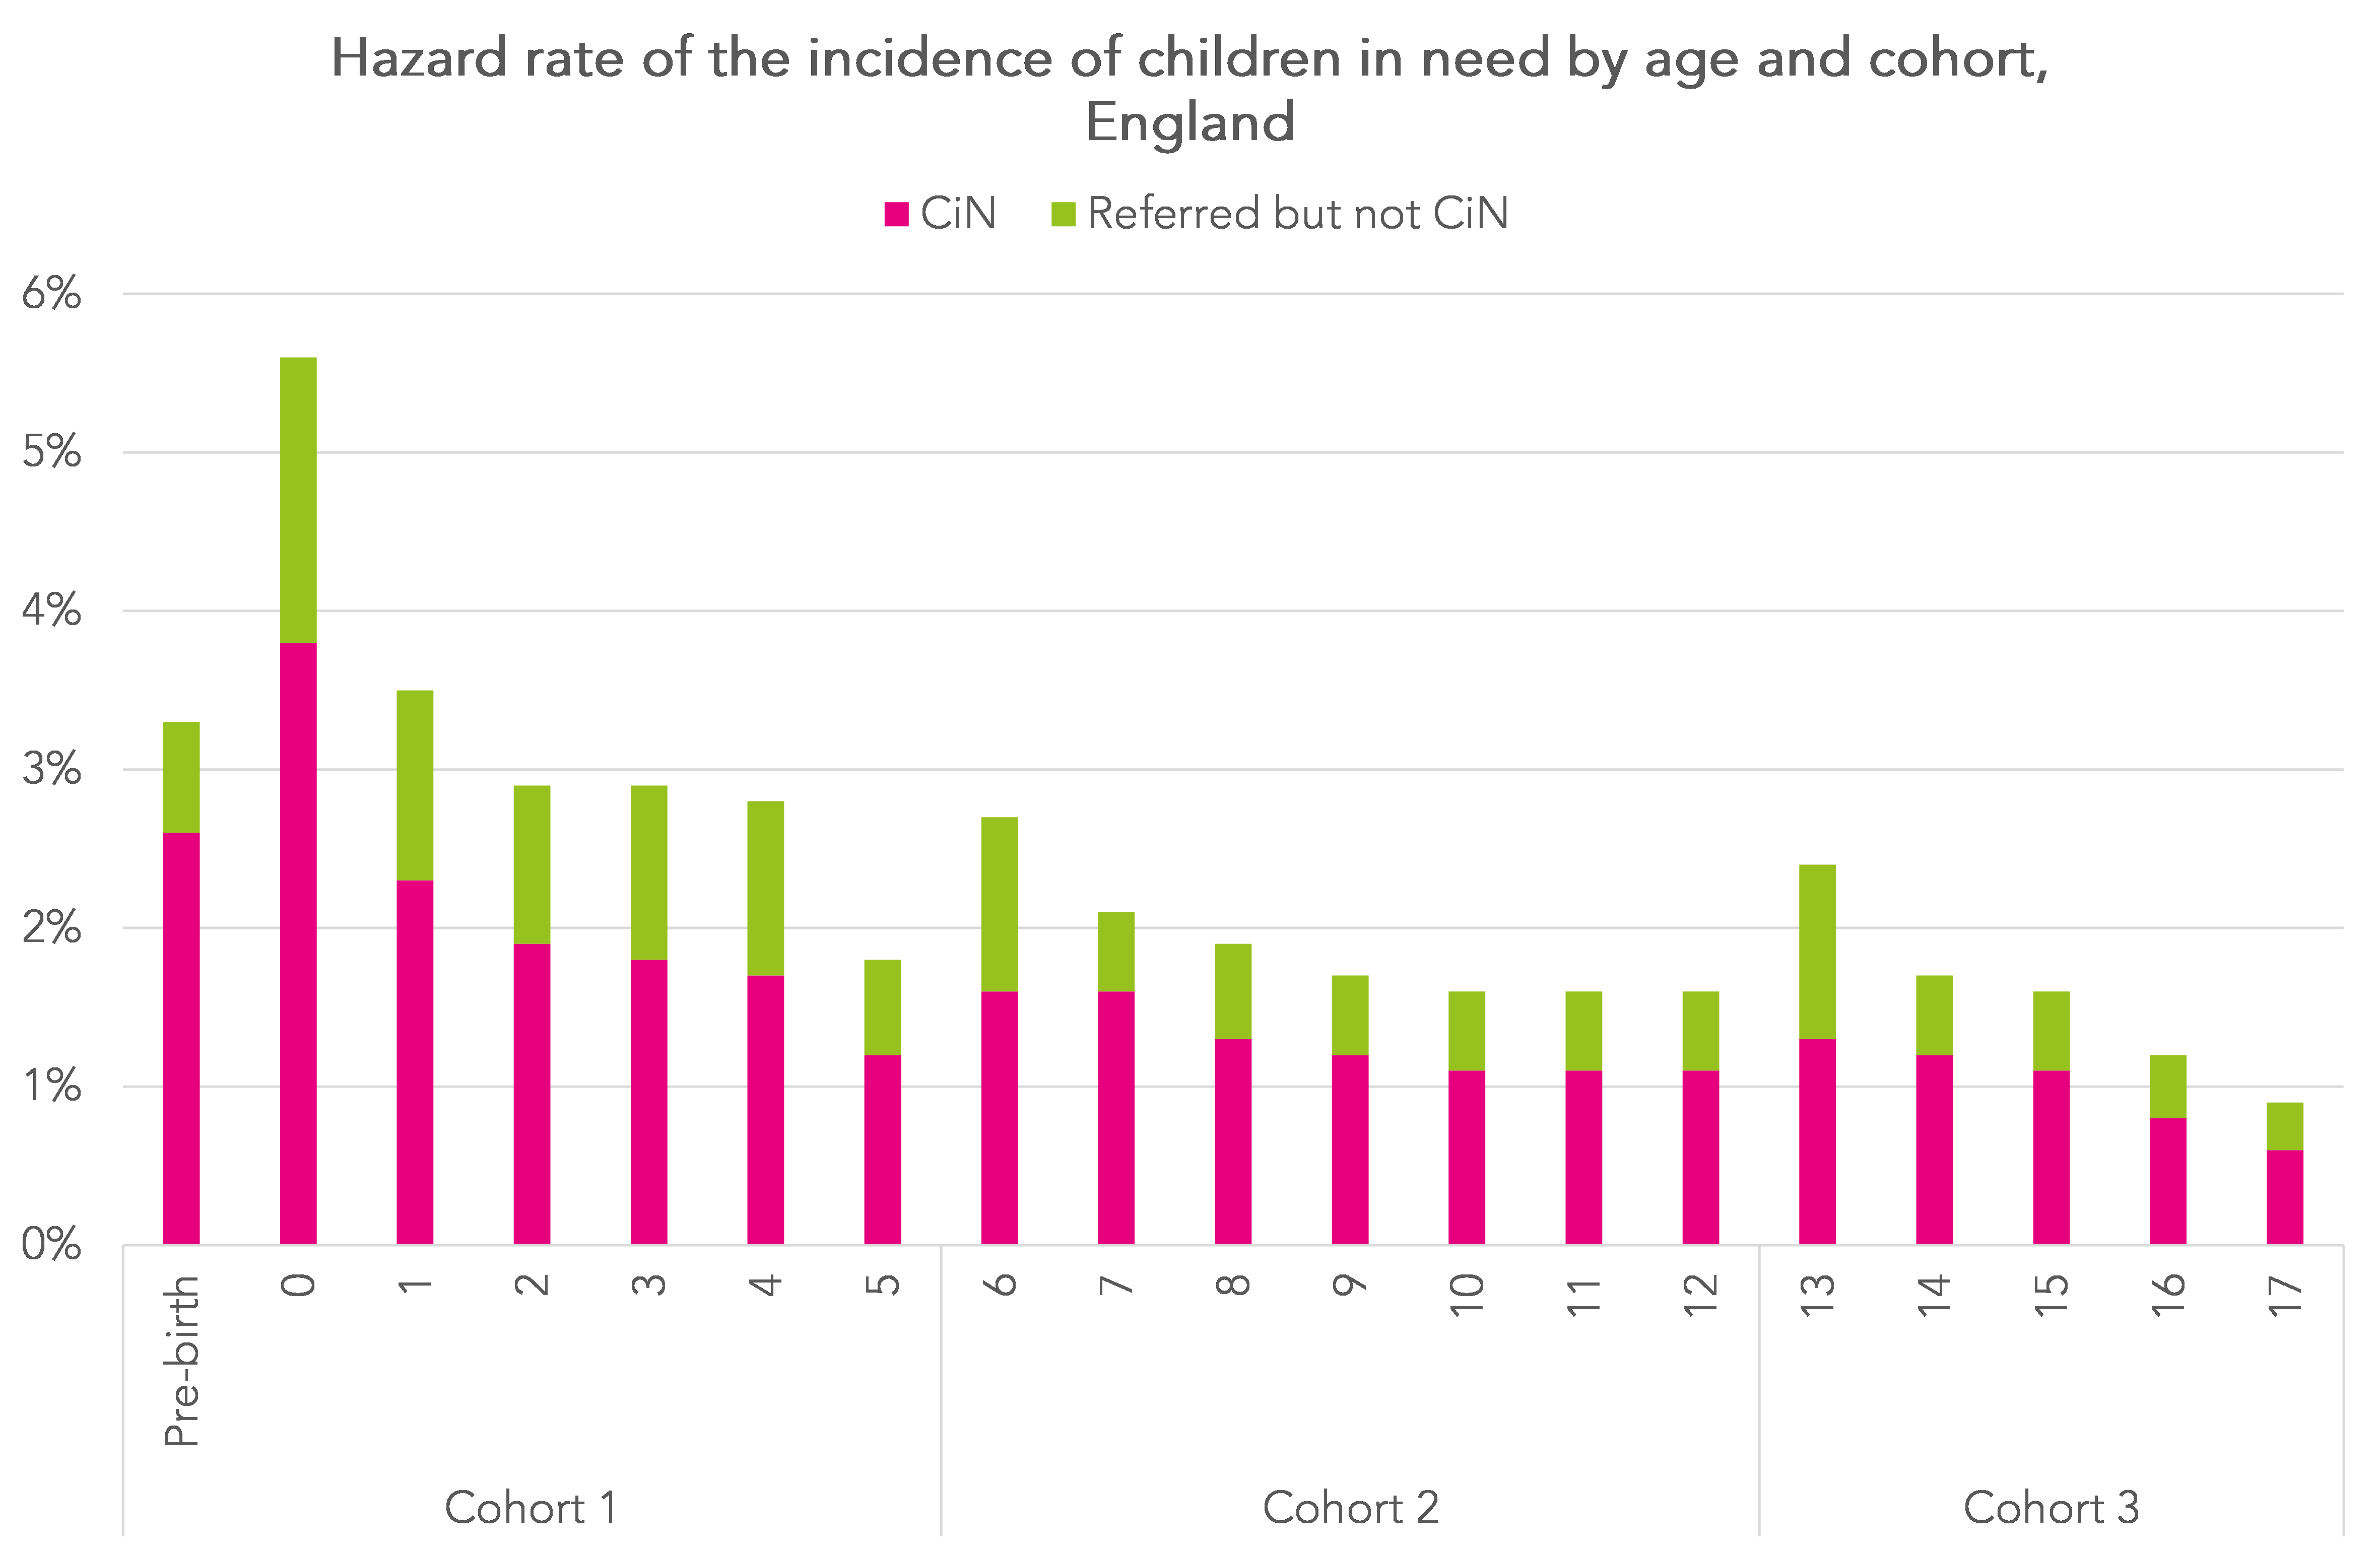
Generally, the hazard rates suggest that between 1% and 2% of young people will become classified as in need for the first time each year between ages 2 and 15. The risk is higher for under 2s and lower for over 15s.
We then calculate cumulative incidence rates of being CiN within each age cohort. This gives us cumulative incidence rates up to age 5 (a), between 6 and 12 (b) and between 13 and 17 (c). We then combine the three rates using the following formula:
CI = 100 * (1-(1-a)(1-b)(1-c))
Overall, we estimate that 25.3% of all children living in England will be recognised by Children’s Social Care Services as a CiN at least once before they turn 18 and that 7.1% will be subject to a child protection plan.
We also find that almost a third of young people are referred to social services before their 18th birthday.
Summing up
Published DfE statistics show that around 3% of young people are in need and around 0.4% are subject to a child protection plan as at 31st March each year. These figures have been relatively stable over the last few years.
However, they do not tell us about how many young people experience children’s social care at any time during their lifetime.
Our research suggests that almost a third of young people will be referred to social services before the age of 18, a quarter will be classified as in need, and 7% will be subject to a child protection plan.
Put another way, cross-sectional estimates of children accessing particular services, such as the rate of children in need on 31st March each year or the percentage of pupils according to the January School Census will not give any indication of the proportions who will experience such events during their childhood[4].
- Under the Children Act 1989
- Patricia Troncoso, Ruth Gilbert, Richard Dorsett, Bianca di Stavola, Andy Bilson and Rachel Pearson
- When aged 0-5 for cohort 2 and aged 0 to 12 for cohort 3.
- And of course there is overlap between the group classified as in need and the group classified as having SEN .
Want to stay up-to-date with the latest research from FFT Education Datalab? Sign up to Datalab’s mailing list to get notifications about new blogposts, or to receive the team’s half-termly newsletter.

‘Our research suggests that almost a third of young people will be referred to social services before the age of 18’, what a poor reflection this comment makes on the society we have created.
I feel the true fraction would be larger as CIN is voluntary, parents can refuse so it never appears as a CIN, and now schools are asked to be social workers though the Early Help/ Early Intervention processes, again is this being recorded.
Interestingly, a third of children generally leave primary/ secondary school not at the expected standard – how many are in the unenviable intersection of that particular Venn diagram?
Hi Robert. Yes, I daresay the referral rate would be higher still if early help were included. In terms of attainment of pupils who are referred, we looked at this in this report https://ffteducationdatalab.org.uk/wp-content/uploads/2023/08/AfC-final-report.pdf. One downside is that we don’t observe CIN status over the full 0-16 age range for any of the cohorts we looked at for the reasons we set out in the blog (i.e. the CIN census only being introduced in 2008/09).
This was a very interesting article. Is there any scope for a follow-up looking at attainment outcomes?
Hi Adele. Many thanks. In fact, there is a “prequel” looking at attainment https://ffteducationdatalab.org.uk/wp-content/uploads/2023/08/AfC-final-report.pdf