Yesterday saw the publication of the Department for Education’s Schools, Pupils and their Characteristics statistics.
This includes, inter alia, data on pupil numbers in schools in England in January 2025.
There has been a drop of 11,000 in the number of pupils attending independent schools since last year, and since the introduction of VAT on school fees at the start of the year.
Much coverage, including that on the BBC website, seems to put this down to pupils leaving the independent sector.
But is that really the case?
Pupil numbers in independent schools
The first thing to say is that the age-profile of pupils in independent schools has historically been skewed towards older pupils.
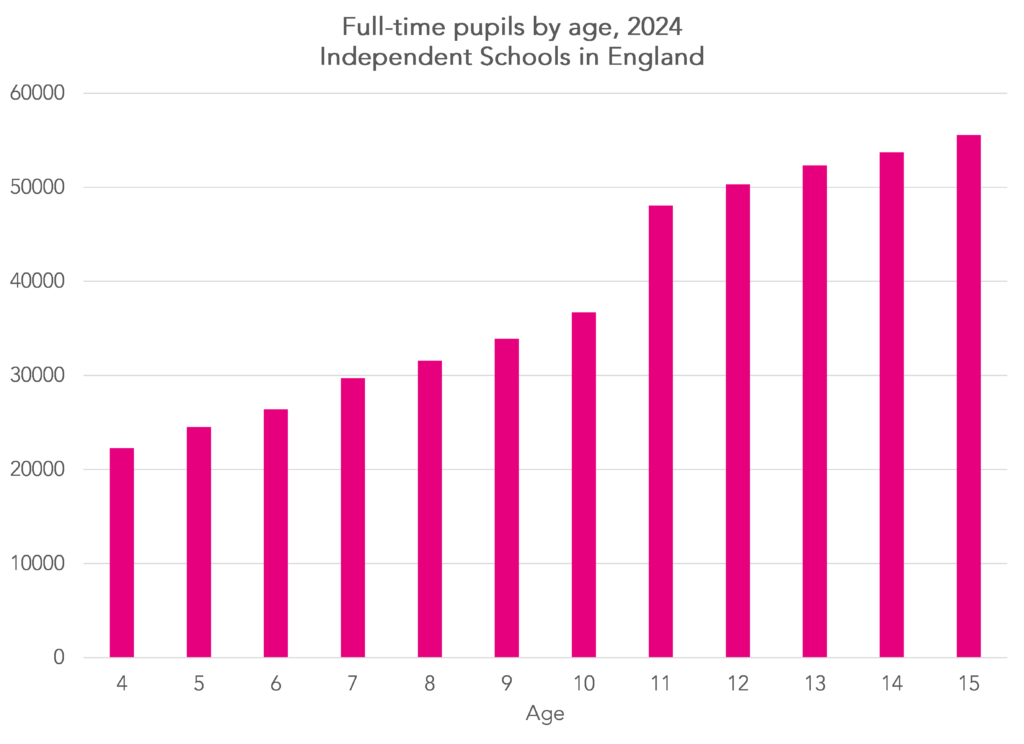
In the chart below, we show the number of full-time pupils by academic age in independent schools in 2024. We concentrate on those of compulsory school age (4 to 15).
This shows a “stepped” pattern. There are more 15 year olds than 14 year olds, more 14 year olds than 13 year olds and so on.
How age cohorts increase in size
Now we look at age cohorts. For example, 4 year olds in 2024 were 5 year olds in 2025 and so on.
The chart also implies that age cohorts increase in size over time.
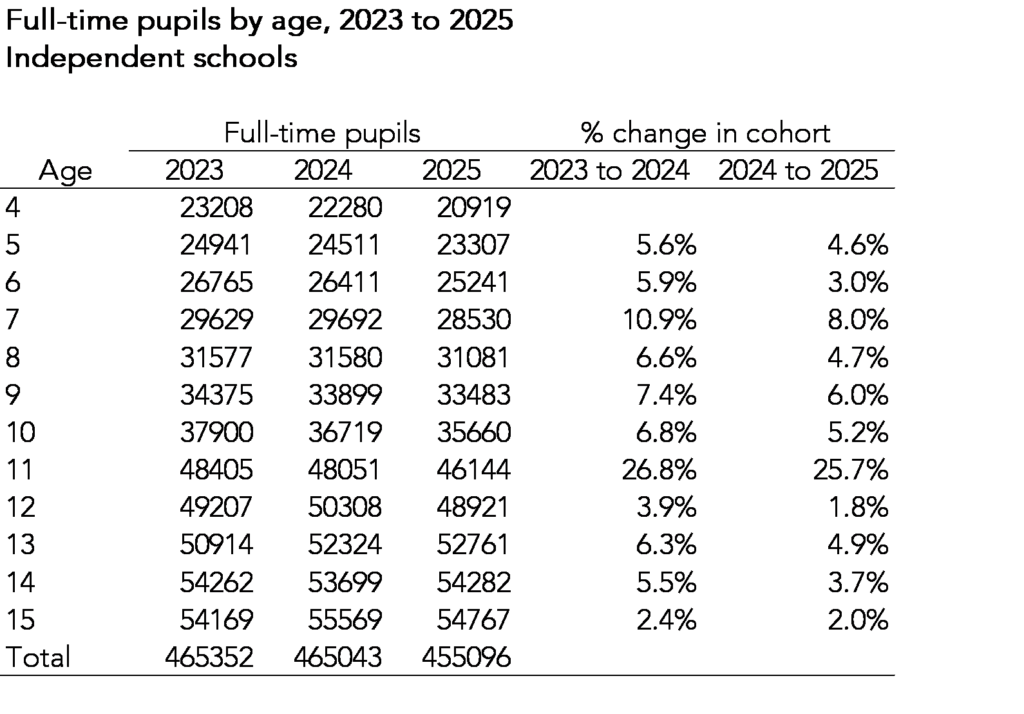
In the table below, we again show the number of full-time pupils on roll in independent schools by age, but this time for 2023, 2024 and 2025.
The first thing that is noticeable is that there are generally fewer pupils of each age in 2025, with the exception of 13 and 14 year olds. For example, there were 23,307 5 year olds in 2025 and 24,511 5 year olds in 2024.
But in the final two columns, we show the proportional size of increase in the age cohort compared to the previous year. For example, there were 23307 5 year olds in 2025 compared to 22280 4 year olds in 2024, an increase of 4.6%.
All the age cohorts increased in number in 2025. That in itself is not surprising, the same thing happened the previous year. In other words, more pupils tend to join the independent sector (either from the state sector or from overseas) than leave between the ages of 4 and 15. This is particularly the case between the ages of 10 and 11.
However, all of the age cohorts increased by a smaller proportion in 2025 than in 2024.
Summing up
There were fewer pupils on roll in independent schools in January 2025 than the previous year.
However, the fact that pupil numbers are lower this year does not necessarily mean that there has been an “exodus” from the independent sector.
First of all, some of this is to be expected given the overall decline in pupil numbers in England. As older, larger cohorts leave school, they are replaced by younger, smaller cohorts.
Secondly, it also ignores how age cohorts in independent schools increase in size over time as a result of pupils moving into the sector.
This opens the possibility that the decline in pupil numbers may be less to do with pupils leaving and more to do with fewer pupils joining.
However, we are unable to test this hypothesis further. Without pupil-level data for independent schools we cannot measure flows into and out of the sector.
Want to stay up-to-date with the latest research from FFT Education Datalab? Sign up to Datalab’s mailing list to get notifications about new blogposts, or to receive the team’s half-termly newsletter.


Whether they leave or choose not to join makes no difference, it means less independent school children. The governments and the IFA guess was out by 300%. If it is out by a similar margin for the full year the money raised from the new VAT on education will not offset the cost of state education. However, it will be hard to tell as the Labour Party votes down an amendment to track the impact.
Hi Al. It’s the claim that lots of pupils have left the sector that I’m calling into question.
Could the comparison look at the change to the national number of students in each age as we have a falling roll in the state sector also. It could be that these patterns correlate in some way?
My guess is that these numbers will look considerably worse as we enter the new school year.
My guess is that these numbers will look considerably worse as we enter the new school year
These data will not determine the ‘exodus’. While the author has identified a reduction in numbers (circa 2%), from personal exposure I understand many parents were able to pay for the school year, and may have been reluctant to move children mid year. The required data set will be the 2026 year which will determine a more accurate movement of children.
While it is not comprehensive as lots of privately educated pupils do not attend ISC schools, the ISC publish data in their Annual Census which can help shed some light https://cms.isc.co.uk/media/0u0llqvv/_isc_census_2025_29may25.pdf
The ISC publish data on the total number of pupils by year group (Appendix 1, Table 3) and the total number of pupils who joined an ISC school since the previous survey by year group (Appendix 1, Table 4). This can be used to calculate the total number of pupils who left an ISC school since the previous year by year group.
For example, we know from the 2024 ISC Census that there were a total of 51,800 Year 10 pupils in ISC schools in January 2024. We know from the 2025 ISC Census that there were 52,498 Year 11 pupils in ISC schools in January 2025 and that 2,358 of these joined their school in the previous 12 months. We can therefore calculate that a total of 1,660 pupils who would have been in Year 11 in January 2025 left an ISC school in the preceding 12 months, either to change to a different private school or to leave the sector entirely. (51,800 Year 10 pupils in 2024 plus 2,358 joiners in Year 11 in 2025 minus 52,498 Year 11 pupils in Year 11 in 2025). As it happens, this was a smaller number than the previous year.
This could be used to calculate joining rates (the percentage of all students who have joined a new ISC school each year) and leaving rates (the percentage of the previous year’s ISC cohort who left in the 12 months following the ISC Census) for ISC schools.
OBR predicted a 35 000 reduction in parents paying these fees. ISC’s – possibly self-interested – prediction was a lot higher. The actual reduction – moderated by the considerations in the article above – has been c 11k. On the big question, I support the ‘VAT on fees’ policy because the question is whether the indy schools are running a charity or selling a service. I can really only see that one way.