Around this time last year, we published a post about the size of multi-academy trusts (MATs). And given that there’s been some pressure on schools and smaller MATs to join larger trusts, we thought it might be worth revisiting the topic to see how things have changed over the last year.
We used public data from Get Information about Schools for this analysis.
An overview
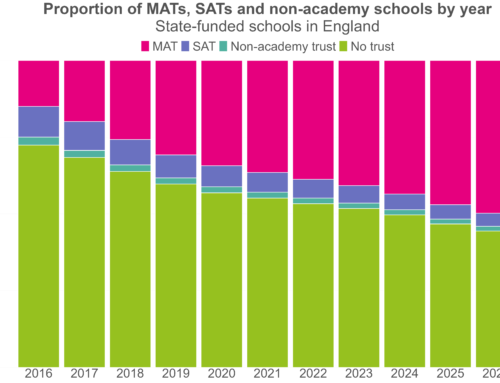
First a look at how many schools are currently part of a MAT. The chart below shows how all schools – including all phases, special schools and PRUs – break down in terms of MAT membership.

In the latest data, 46.4% of schools are academies, up from 44.7% a year ago. However, 1,251 of these are single academy trusts – and therefore not part of a MAT.[1]
40.7% of schools are currently part of a MAT, up from 38.6% last year. This translates to 466 more schools in MATs than this time last year.
But while the number of schools in MATs is on the increase, the number of active MATs has actually fallen. In the latest data, there are 1,188 active MATs, compared to 1,197 this time last year.[2]
You don’t have to be a statistician to work out that this means that MATs are getting (a bit) bigger.
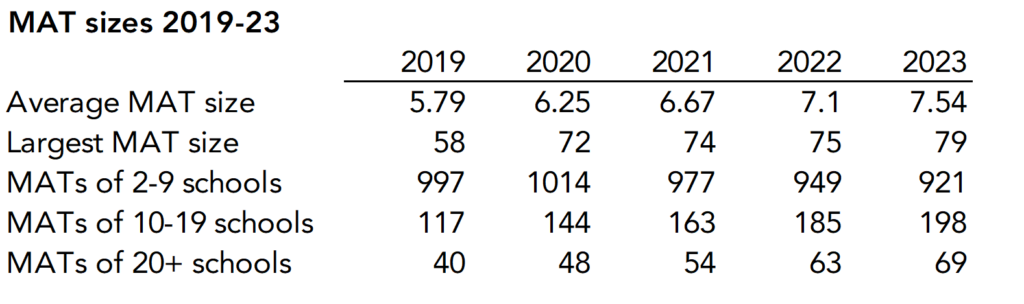
As shown below, the average size of a MAT has been increasing year on year, as has the number of mid and large trusts. At the same time, the number of smaller MATs has been falling.
Expanding MATs
Let’s take a closer look at what’s happening at the MAT level. The chart below shows the trends over the last five years.
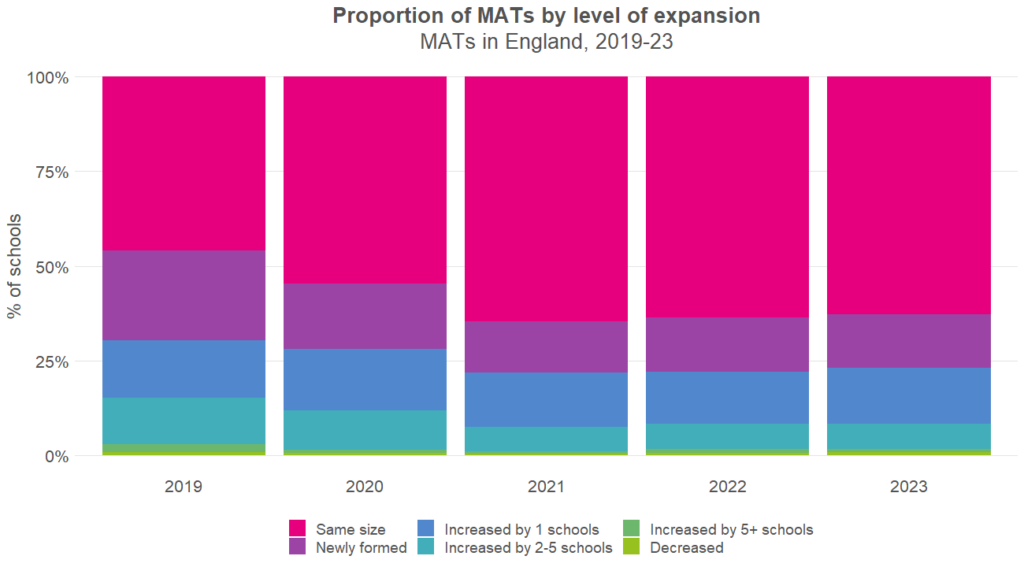
While MATs are getting bigger on average, nearly three-quarters (71.6%) of the MATs that are currently active are the same size as they were this time last year.
Just a quarter (25.3%) increased in size, most of these by just one school. But this does still amount to 301 MATs that have expanded.
This is actually a lower proportion than a few years ago; of those MATs that were active in 2019, 29.5% had increased in size since 2018.
Larger MATs were far more likely to expand than smaller MATs, as shown below.
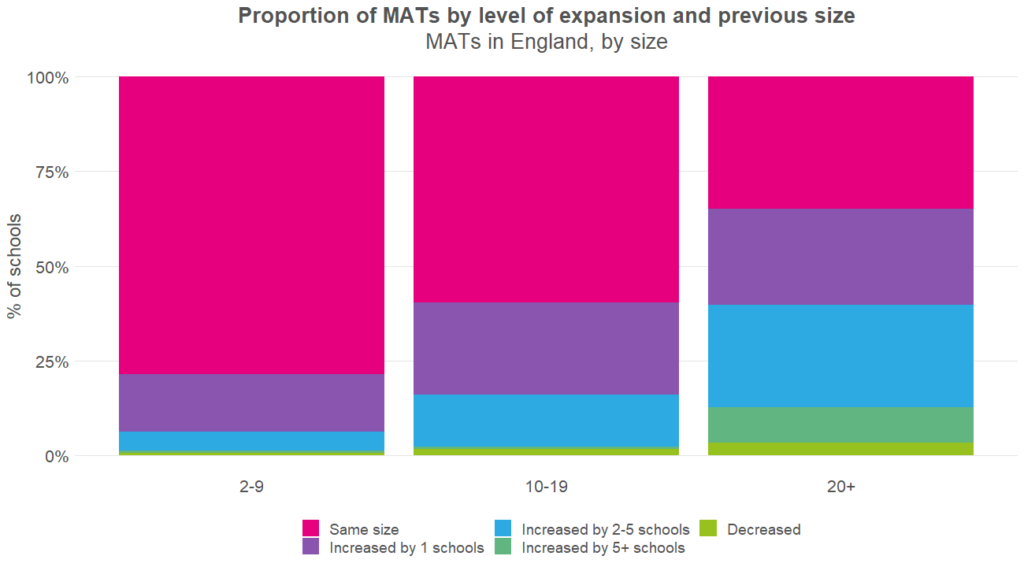
61.9% of large MATs – those with twenty or more schools – have increased in size since last year, compared to 38.6% of mid-sized MATs and 20.9% of smaller MATs.
Regional differences
As we noted in our last post on MAT size, there are some considerable differences by region, as shown below.
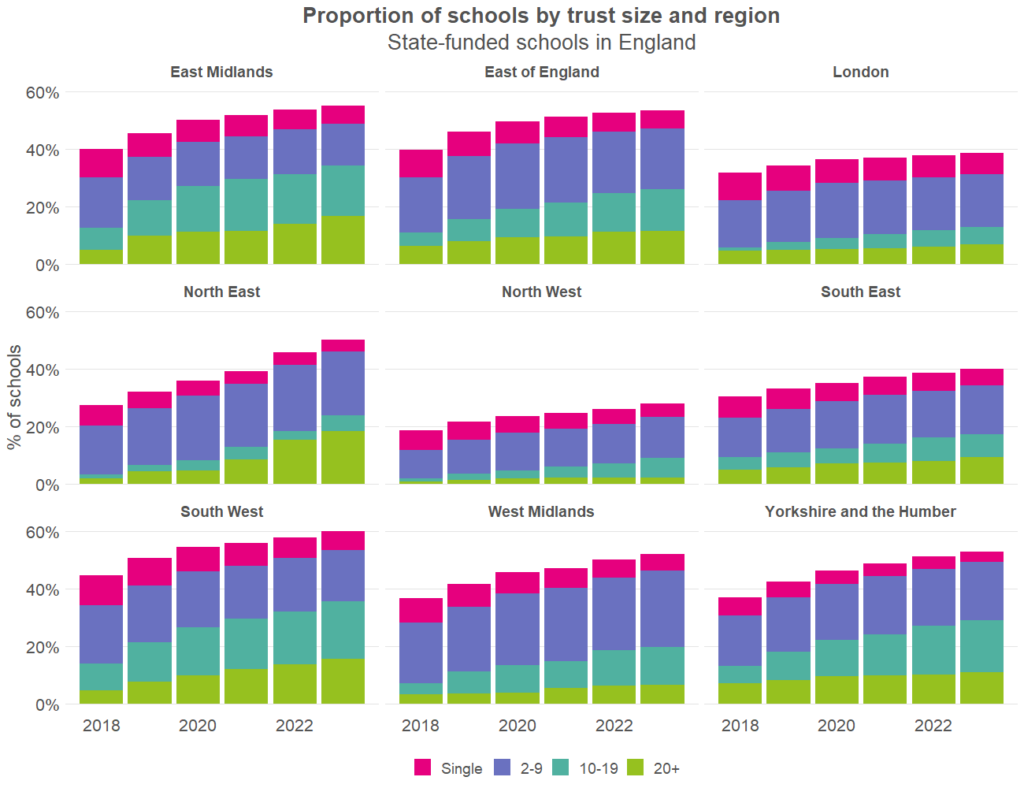
In every region, the proportion of schools in MATs is higher now than it was this time last year. But the differences between regions remain similar.
In the North West, just 23.4% of schools are part of a MAT, while the South West is the only region in which more than half of schools (53.4%) are in a MAT.
The North East has a particularly high proportion of schools in large MATs – those with twenty or more schools. 18.2% of schools in the region are part of a large MAT, compared to just 2.3% in the North West.
Destinations since this time last year
The chart below shows the type of MAT that schools currently belong to by the type of MAT that they belonged to this time last year.

Most schools are still in the same situation as this time last year, but a substantial number now belong to a larger trust. This includes 6% of those who were SATs last year, 6% of those who were in a small MAT, and 6% of those who were in a mid-sized MAT.
Most of these changes came about because existing MATs expanded, rather than because schools moved to a different MAT. Movement between MATs is rare – of those schools that were part of a MAT this time last year, 97.1% are still part of the same MAT.
In almost all cases, switching to another MAT follows the school’s existing MAT becoming inactive. What we can’t tell from the data is *why* their existing MAT became inactive. In some cases, the existing MAT may have merged with another MAT, but it’s difficult to see this in the data.
Newly academized schools
What’s perhaps surprising, given the pressure on schools to join larger MATs, is that those joining a MAT for the first time were more likely to join a smaller MAT of less than 10 schools.
The chart below shows the trends over the last few years.
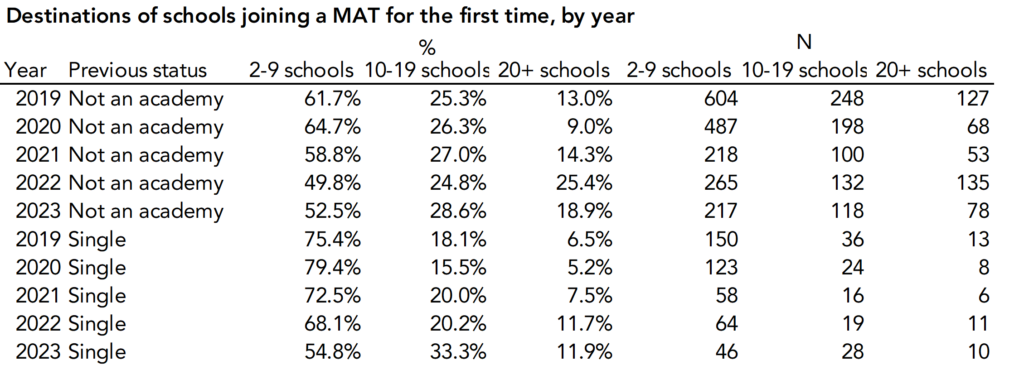
More than half (52.9%) of those that joined a MAT for the first time this year joined a small MAT, and relatively few joined a large MAT with 20 or more schools. This is particularly true of those that were previously SATs.
But it is becoming more common for new joiners to join larger MATs. Back in 2019, for example, 75.4% of SATs who joined a MAT chose small MAT of less than 9 schools, some of these forming their own new MATs. This year, just 54.7% joined or formed a small MAT.
Final thoughts
Over the last few years, MATs have tended to increase in size, although there are still plenty of small MATs out there. The changes over the last year seem broadly in line with the trends over the last few years, with no particular surprises.
[1]: This differs from the number of schools that the Get Information about Schools (GIAS) data classifies as being supported by a single-academy trust. However, our analysis showed that 160 schools were listed in the GIAS data as being supported by a multi-academy trust, but the trust consisted of just one school. We have therefore counted these 160 schools as SATs.
[2]: We have defined an ‘active MAT’ as a MAT with at least two schools. The latest GIAS group dataset includes 1433 open MATs, but cross referencing with school level data from the same source, we found that 245 of these MATs currently have no schools.
Want to stay up-to-date with the latest research from FFT Education Datalab? Sign up to Datalab’s mailing list to get notifications about new blogposts, or to receive the team’s half-termly newsletter.


Leave A Comment