National headlines for this year’s Key Stage 2 tests were released by DfE last month. They showed that, overall, attainment was up slightly on last year, but remained below pre-pandemic levels. (61% of pupils met the expected standard in reading, writing and maths, compared with 60% last year and 65% in 2019.)
In today’s post, we’re going to dig behind the headlines. In particular, we’ll be looking at how disadvantaged pupils fared this year.
One slight wrinkle is that the definition of “disadvantaged” has subtly changed this year. In the past, this has been defined as being eligible for free school meals at any point in the last 6 years. We (and others) often use “FSM6” as shorthand for this longer definition.
But due to the transitional protections brought about by the rollout of Universal Credit, all pupils eligible for free school meals since 1st April 2018 are now in the disadvantaged group as they have remained eligible since then. In other words, the FSM6 group is now really the FSM7 group.
Data
To do this, we’ll use data submitted to us by schools using our Early Results Service. We’ll use data submitted during the first submission window – from around 2,000 schools.
The results we present below are for this sample of schools. Generally, we find that data collected from a large number of schools produces a close approximation of the national average but results for groups of pupils can sometimes be more variable.
Overall attainment
We’ll start by looking at overall levels of attainment in our sample of schools. Below, we plot the percentage of pupils who reached the expected standard in reading, writing teacher assessment, and maths. We’ll compare with the same schools last year, and in 2019.
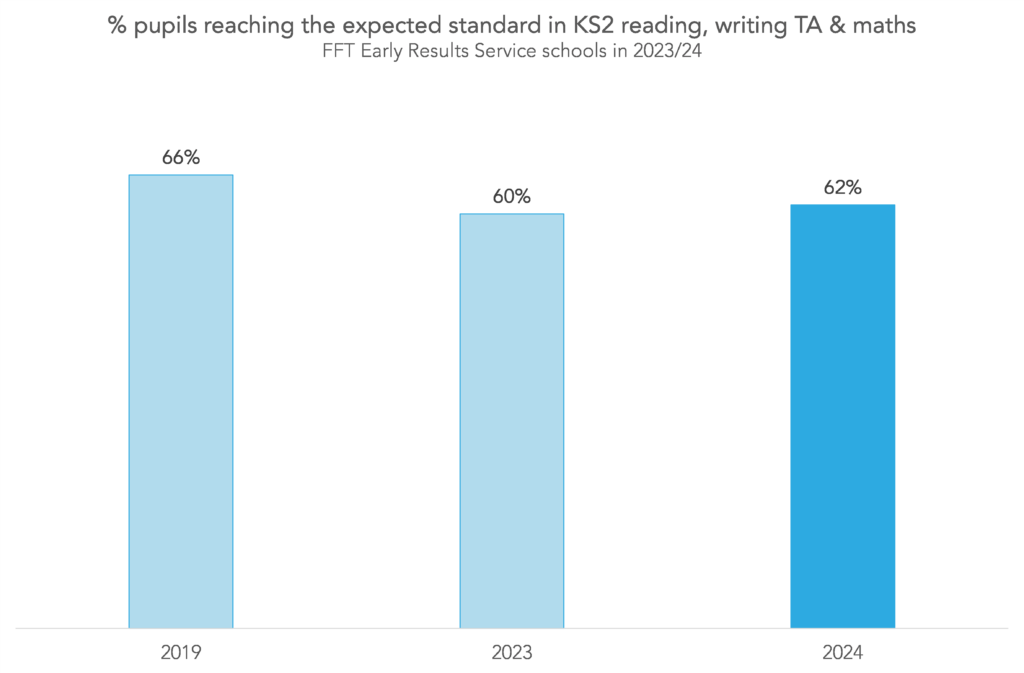
The pattern among our sample of schools is the same as the national picture – attainment this year is slightly higher than last, but lower than pre-pandemic[1].
Disadvantage gap over time
Looking at the data by disadvantage, noting the caveat in the introduction about the definition of FSM6, gives us the following:
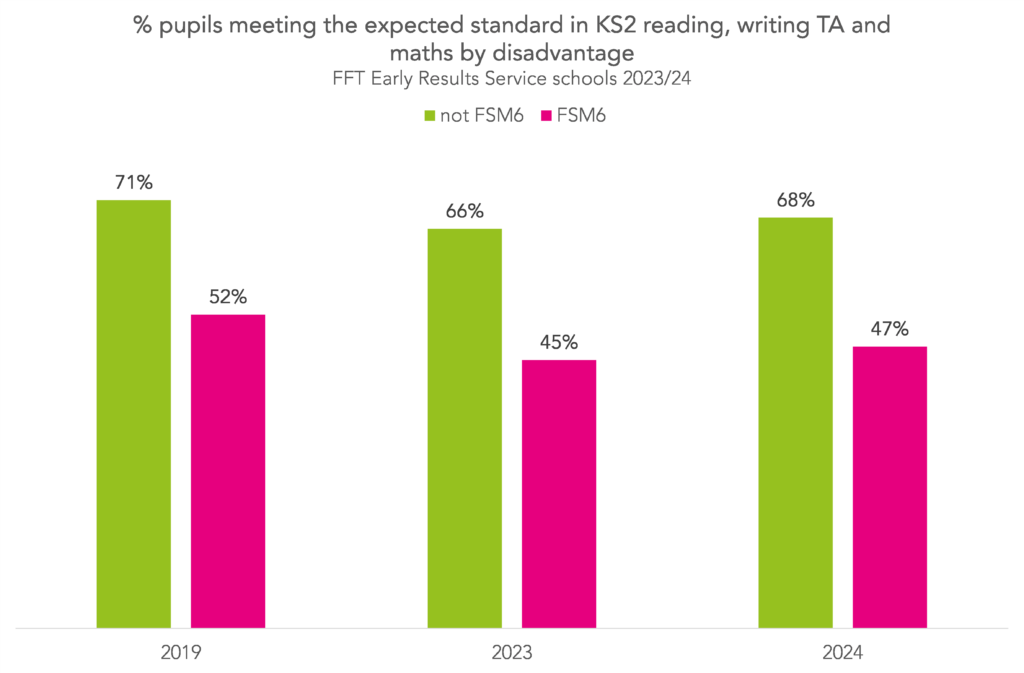
The difference in attainment between disadvantaged pupils and their peers in our sample of schools grew slightly over the pandemic, from around 19 percentage points (ppt) in 2019 to 21ppt in 2023. This mirrors the findings of DfE’s disadvantage gap index[2] last year.
This year the difference has stayed the same, at 21ppt.
However, changes to free school meal eligibility criteria in recent years mean it’s hard to make like-for-like comparisons by disadvantage over time.
Components of this year’s disadvantage gap
Now let’s look at this year’s disadvantage gap in a bit more detail. Below, we show the percentage of pupils who reached the expected standard in each subject.
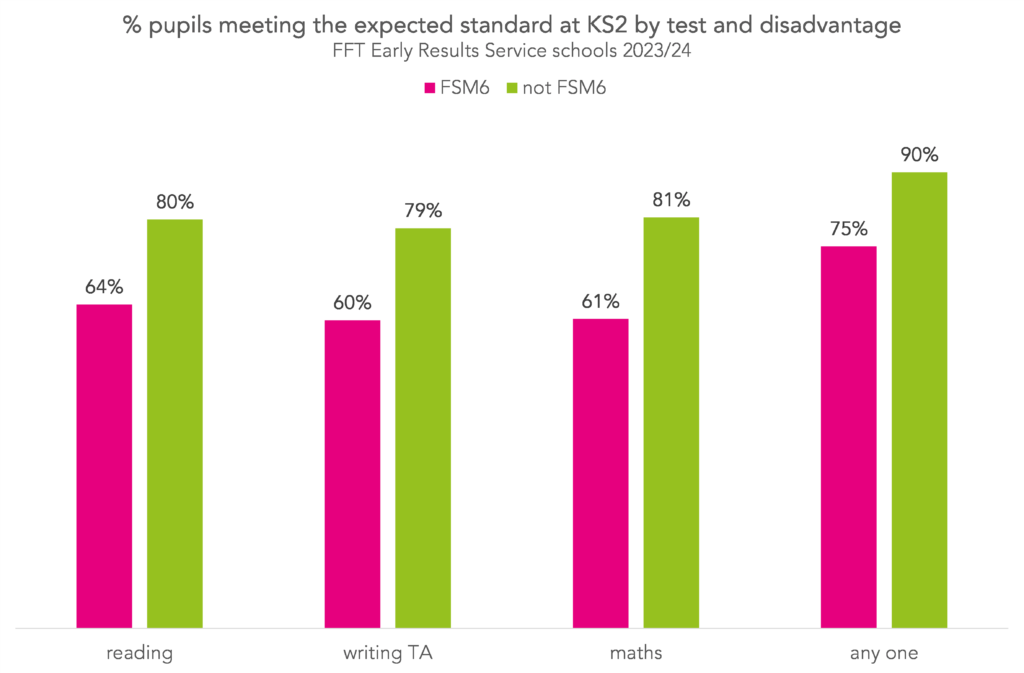
The disadvantage gap in each individual subject was smaller than the gap in all three subjects combined. Although similar across all subjects, the gap was smallest in reading (17ppt) and largest in maths (20ppt).
90% of non-disadvantaged pupils met the expected standard in at least one subject, compared with 75% of disadvantaged pupils.
Had all pupils who met the expected standard in one or two subjects been able to meet it in the other/s, then the overall proportion of pupils meeting the expected standard in all three subjects would have increased from 62% to 85%. And the disadvantage gap would have reduced, from 21ppt to 15ppt.
Quantifying the gap
To finish, we’ll quantify how much lower disadvantaged pupils scored in reading and maths than their peers.
To do this, we’ll need to look beyond the threshold measure of pupils meeting the expected standard.
Below, we plot the percentage of pupils by their raw score in their reading test, marked out of 50[3]. To make comparisons easier, we use cumulative percentages, that is, the percentage of pupils who scored at least a particular mark. The grey dotted line shows the mark needed to have met expected standard.
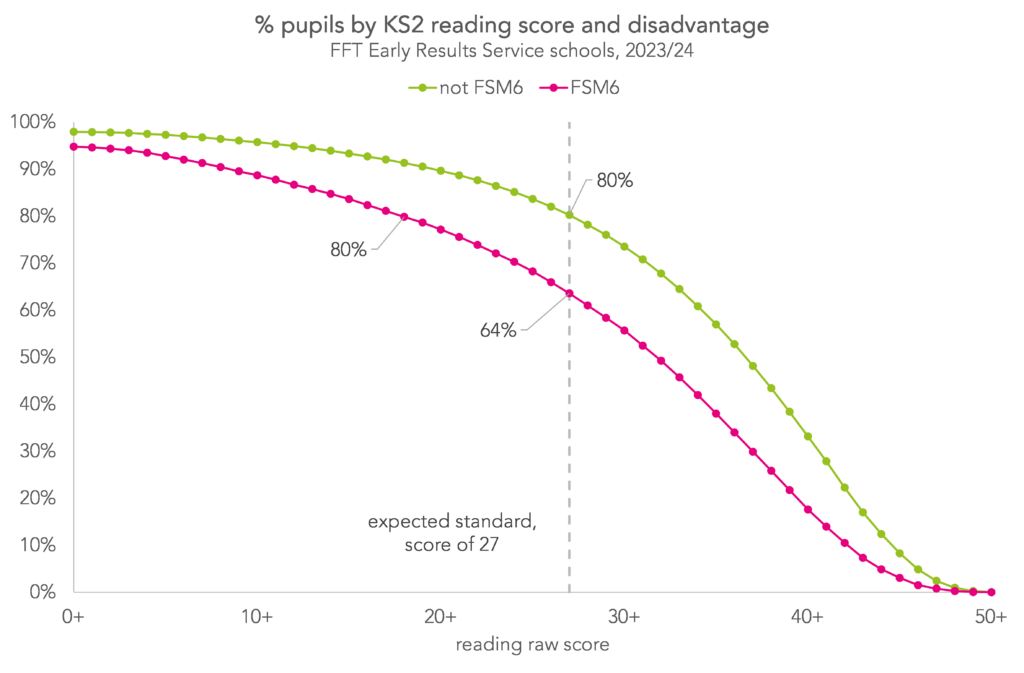
We can see that 80% of non-FSM6 pupils met the expected standard, by scoring 27 or better. If we look at the distribution for FSM6 pupils, the same proportion, 80%, scored 18 or better. Put another way, in order for as many disadvantaged pupils to have met the expected standard as non-disadvantaged pupils, the threshold score would have needed to be 9 marks lower for disadvantaged pupils.
Going through the same process for maths, where the disadvantage gap at the expected standard is wider:
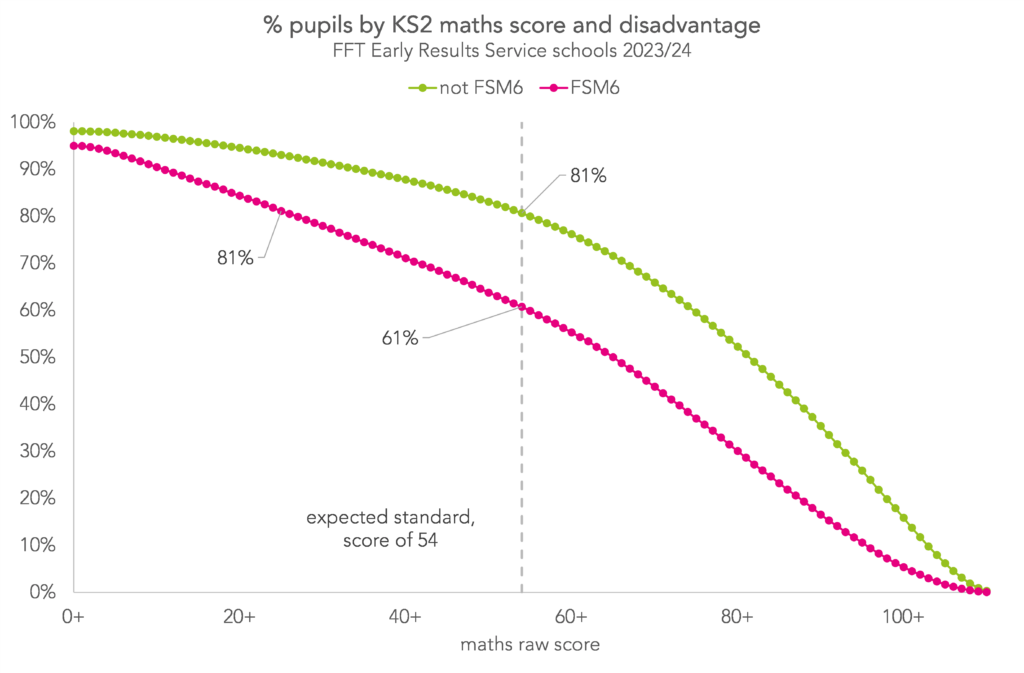
81% of non-disadvantaged pupils met the expected standard by scoring at least 54. 81% of disadvantaged pupils scored 25 or better. So, in maths, the threshold score would have needed to be 29 marks lower for disadvantaged pupils.
Of course, having different thresholds for disadvantaged pupils isn’t possible (or desirable) in practice. This is intended as an alternative way of thinking about the disadvantage gap.
Summing up
Overall, the disadvantage gap in attainment at the expected standard in KS2 reading, writing, and maths, looks to have stayed roughly the same as last year, at least in our sample of schools.
We’ll get to see the official disadvantage gap next week when DfE publishes its Key Stage 2 statistical release. It will be interesting to see if (and how) they deal with the change in composition of the “FSM6” group.
Schools which took part in FFT’s Early Results Service have access to a range of reports. These include progress measures, calculated from pupils EYFS scores.
Want to stay up-to-date with the latest research from FFT Education Datalab? Sign up to Datalab’s mailing list to get notifications about new blogposts, or to receive the team’s half-termly newsletter.
[1] The proportions themselves are very similar too. The national figures are: 2019 65%, 2023 60%, 2024 61%.
[2] Found in the “attainment and progress by pupil characteristics section. The disadvantage gap index ranks all pupils in the country by attainment in reading and maths, then compares the mean rank of disadvantaged pupils with the mean rank of non-disadvantaged pupils. Because it uses ranks it tends to provide better comparability of the disadvantage gap over time compared to raw differences in attainment. Further details can be found in the methodology document.
[3] The full list of marks and their scaled score equivalents can be found here.


Thank you for this helpful analysis on disadvantage/FSM. Would you consider EAL as disadvantaged and does it show the same trends as FSM?
Hi James. No, we wouldn’t consider EAL as disadvantaged. To be honest there isn’t particularly good quality data on the attainment of pupils with EAL. DfE publishes attainment statistics for pupils with a first language other than English. But this doesn’t give any sense of level of fluency in English. For what it’s worth, you can see data up to 2023 in this link (data for 2024 will be published next week). https://explore-education-statistics.service.gov.uk/data-tables/permalink/37708482-d81f-4940-b4d4-08dccb80a395
So helpful and food for thought particularly in relation to these outcomes and thinking about impact of absence
This data is very interesting and I love reading your content. Is there any data which delves into the ethnicity of those who fall into the disadvantaged category and whether these are any trends there?
Hi Charlene. We’ve done some work on the interaction between ethnicity and disadvantage before, see e.g. here, broadly focussed on how the size of the disadvantage gap varies for pupils from different ethnic backgrounds. If you wanted to do some more digging, the Key Stage 2 data released by DfE contains breakdowns by the combination of disadvantage and ethnicity (if you click “download all data” it’s the file called ks2_national_pupil_characteristics_2016_to_2024_provisional.csv).