Recently, we were commissioned by CASE (campaign for state education) to investigate the rate at which pupils moved on and off school rolls. In particular, they were interested to see whether there were differences between local authority (LA) schools and academies.
You can read our full report here. Or, for a summary of the highlights, read on…
Data
We used data from the National Pupil Database (NPD) on around 2.5 million pupils. We looked at pupils who were on-roll at a state-funded secondary school at the time of the January census in 2021/22 in Years 7 to 10, and at the time of the January census in 2022/23 in Years 8 to 11.
We counted a pupil as having left their school if they had a record in January 2022 and either had no record in January 2023, or had a record in January 2023 but at a different school. Similarly, we counted a pupil as having joined their school if they had a record in January 2023 and either had no record in January 2022, or had a record in January 2022 but at a different school[1] (there are different reasons why a pupil may have no record in one of the census points, for example, a move to/from the independent sector, a different country, or elective home education.)
We define “outward” and “inward” mobility as percentages with the number of leavers and joiners, respectively, as the numerators, and the number of pupils on-roll in January 2022 as the denominator. For example, a school with 100 pupils, 10 joiners, and 10 leavers would have both an inward and outward mobility of 10%.
The headlines
Below, we summarise mobility overall, and separately for LA schools and academies.
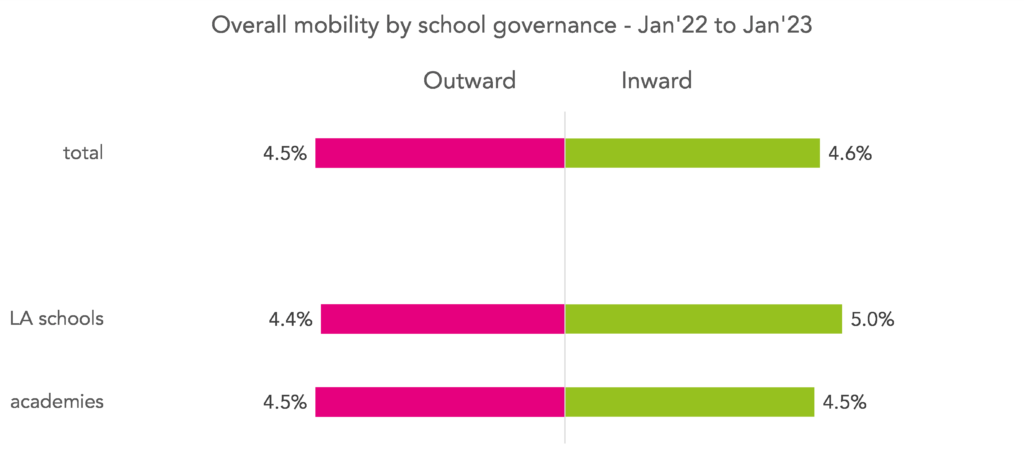
Overall, inward mobility was slightly higher than outward mobility, meaning that there were slightly more joiners than leavers over the time period.
Outward mobility was roughly the same in LA schools and academies, while inward mobility was a little higher in LA schools than academies.
We can break the data down further by comparing academies which were part of big multi-academy trusts (MATs) with those which weren’t (a combination of single academies and academies which are part of smaller trusts). We define a big MAT as one with at least ten mainstream secondary schools.
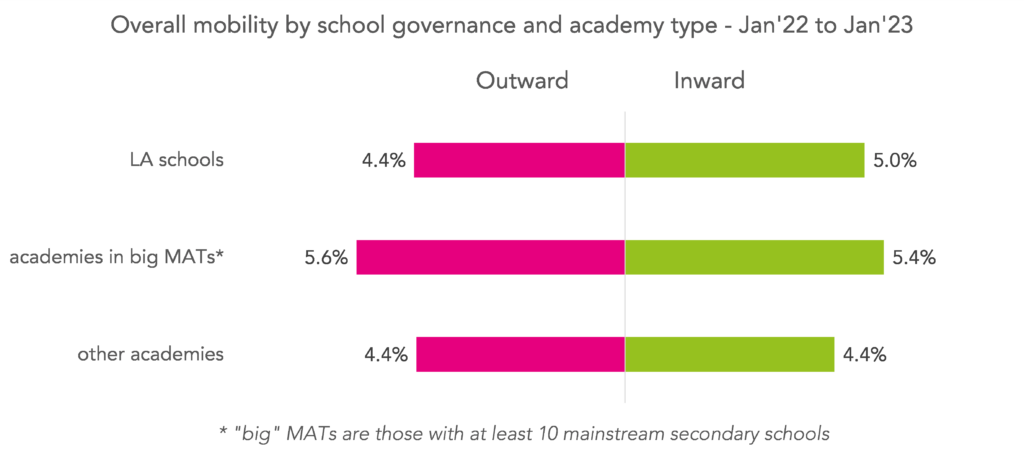
Academies which were part of big MATs had higher rates of both inward and outward mobility compared to other types of academies and to LA schools.
The impact of pupil and school characteristics
That schools in big MATs have higher rates of mobility, particularly outward mobility, than other types of school might raise an eyebrow or two. However, so far, we haven’t looked at whether and how pupil characteristics varied across the different school types. Perhaps schools in large MATs had a greater proportion of disadvantaged pupils, for example.
To unpick this, we first assign each pupil in an academy a “predicted” probability of leaving, based on the observed proportion of pupils with the same characteristics[2] who left LA schools. We then compare the actual, observed outward mobility of pupils in academies (and the subset of big MATs) with these predictions. Here, we limit our analysis to mainstream schools only.
These are the results:
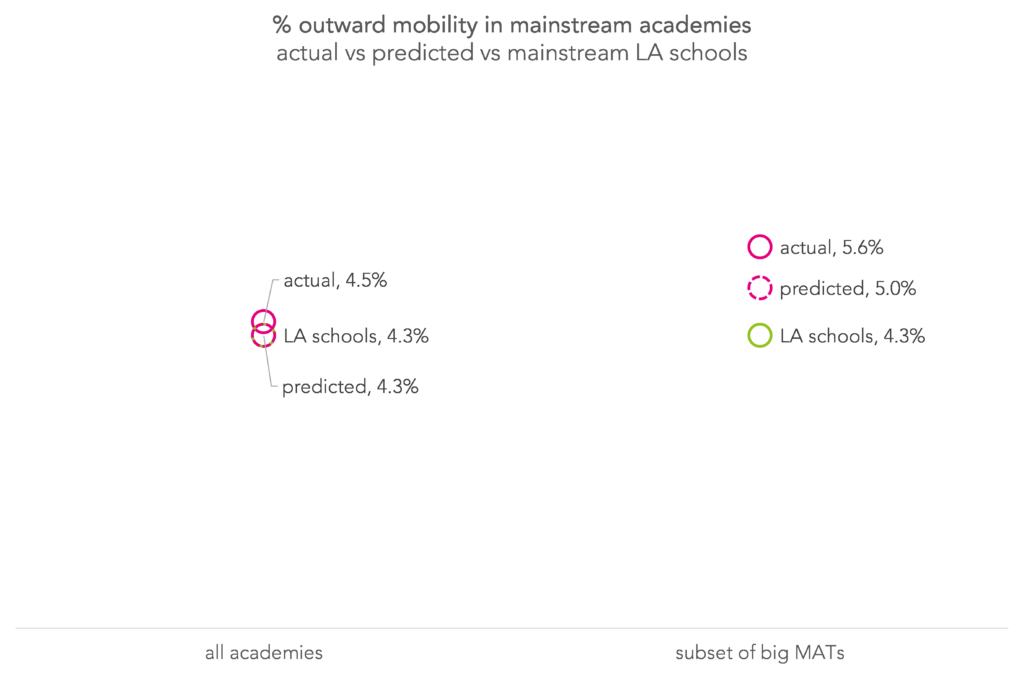
Let’s first compare predicted outward mobility rates with the average for LA schools. In academies, these two numbers are the same – 4.3%. This means that pupils in academies, broadly, had similar characteristics to those in LA schools (at least in terms of their impact on the probability of being a leaver). In the subset of academies which belonged to big MATs, however, the predicted probability was higher, at 5.0%. This means that, on average, pupils in big MATs had characteristics associated with a slightly greater likelihood of leaving their schools than those in LA schools.
However, by comparing actual and predicted outward mobility, we see that outward mobility is still a little higher for pupils in big MATs than those in LA schools – by 0.6 percentage points, or around 13%. (For all academies, the difference is 0.2 percentage points, or 6%.)
In short, some, but not all, of the observed difference in outward mobility between LA schools and academies in big MATs can be explained by pupil characteristics.
A note on vulnerable pupils
One final thing we looked at was how mobility varied by school type for vulnerable pupils[3]. We found that while LA schools saw a net inflow of vulnerable pupils (i.e. inward mobility higher than outward), academies, and particularly those in big MATs, saw an outflow.
We thought this finding warranted a bit more digging. So we ran the numbers again, but looking only at mainstream LA schools and academies.
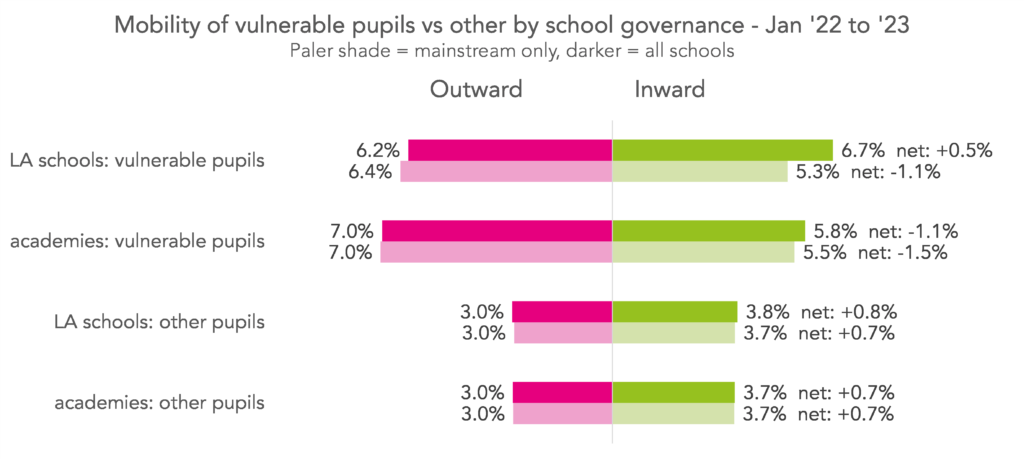
With AP and special schools removed, both LA schools and academies saw a net outflow of vulnerable pupils. Inward mobility was almost identical, though higher outward mobility in academies, and particularly in big MATs, meant that the net outflow was higher for these schools (though note that we’ve not taken pupil characteristics into account here).
These two results together – for all schools and just mainstream schools – show that while all mainstream schools tended to “lose” some vulnerable pupils, non-mainstream LA schools[4] were the most common destination. In other words, vulnerable joiners were accommodated disproportionately in the LA sector rather than in academies.
Summing up
Academies which were part of big MATs had higher rates of outward mobility compared with other types of academies, and with LA schools. Some, but not all, of this difference can be accounted for by pupil and school characteristics.
And, while there was a net outflow of vulnerable pupils from all types of mainstream schools, non-mainstream LA schools had a higher inflow of vulnerable pupils than non-mainstream academies.
Want to stay up-to-date with the latest research from FFT Education Datalab? Sign up to Datalab’s mailing list to get notifications about new blogposts, or to receive the team’s half-termly newsletter.

[1] We ignored any pupils who moved schools as part of a “standard” transition. Examples of standard transitions include moving from Year 9 in a middle school to Year 10 in a secondary/high school. Details of how we did this can be found in the full paper.
[2] We performed a logistic regression on pupils in LA schools with a binary dependent variable indicating whether a pupil left or not, and the following as independent variables: gender, ethnicity, first language (English/other), academic age, % terms FSM, % terms SEN (either support or with an EHCP), had an EHCP, ever had SEMH, ever permanently excluded, number of days suspended in Autumn 2021, % ever FSM pupils in Years 7-10 of the school attended, IDACI ranking of home postcode, prior attainment (high / medium / low / no data), prior attainment interacted with academic age, school Ofsted rating in December 2021
[3] A vulnerable pupil is one who met at least one of these criteria: had an EHCP, ever had SEMH, ever permanently excluded, missed five or more days due to suspension in Autumn 2021, ever eligible for FSM.
[4] Community special schools, non-maintained special schools, foundation special schools, and pupil referral units.


It would be interesting to know what proportion of the pupils moving experience doing this multiple times and if there is an impact from this.