Earlier this year the DfE released a report (pdf) called “the link between attendance and attainment in an assessment year”. In it, they produced some figures which compared the KS4 outcomes of similar pupils with different absence rates in Year 11. (They did the same for KS2 outcomes and Year 6 absence rates, which we’ll leave to one side here.)
Aside from their decision to report all of their headline findings in terms of odds ratios which are, at best, unintuitive and, at worst, misleading, we also thought it was interesting that pupils’ absence rates prior to Year 11 weren’t really taken into account in the model[1].
This meant that any differences in outcomes which were correlated with attendance were attributed solely to attendance in Year 11, ignoring whether pupils had longer-term problems attending school regularly.
In this post, we’ll explore this by considering the relationship between pupils’ absence rates in Year 11 and their KS4 outcomes, in the context of their absence rates in Year 10. In other words, what is the relationship between Year 11 absence and KS4 attainment for pupils with similar absence rates in Year 10?
Data
As usual, we’ll be using data from our FFT Attendance Tracker schools. We link this to attainment data submitted by schools just after results day this year as part of the FFT Early Results Service. We then remove any pupils who moved schools during Year 11, or who had incomplete absence records in either Year 10 or Year 11. This leaves us with around 250,000 pupils in 1,500 schools.
Year 11 absence vs Attainment 8
Let’s start by summarising the relationship between Year 11 absence and attainment.
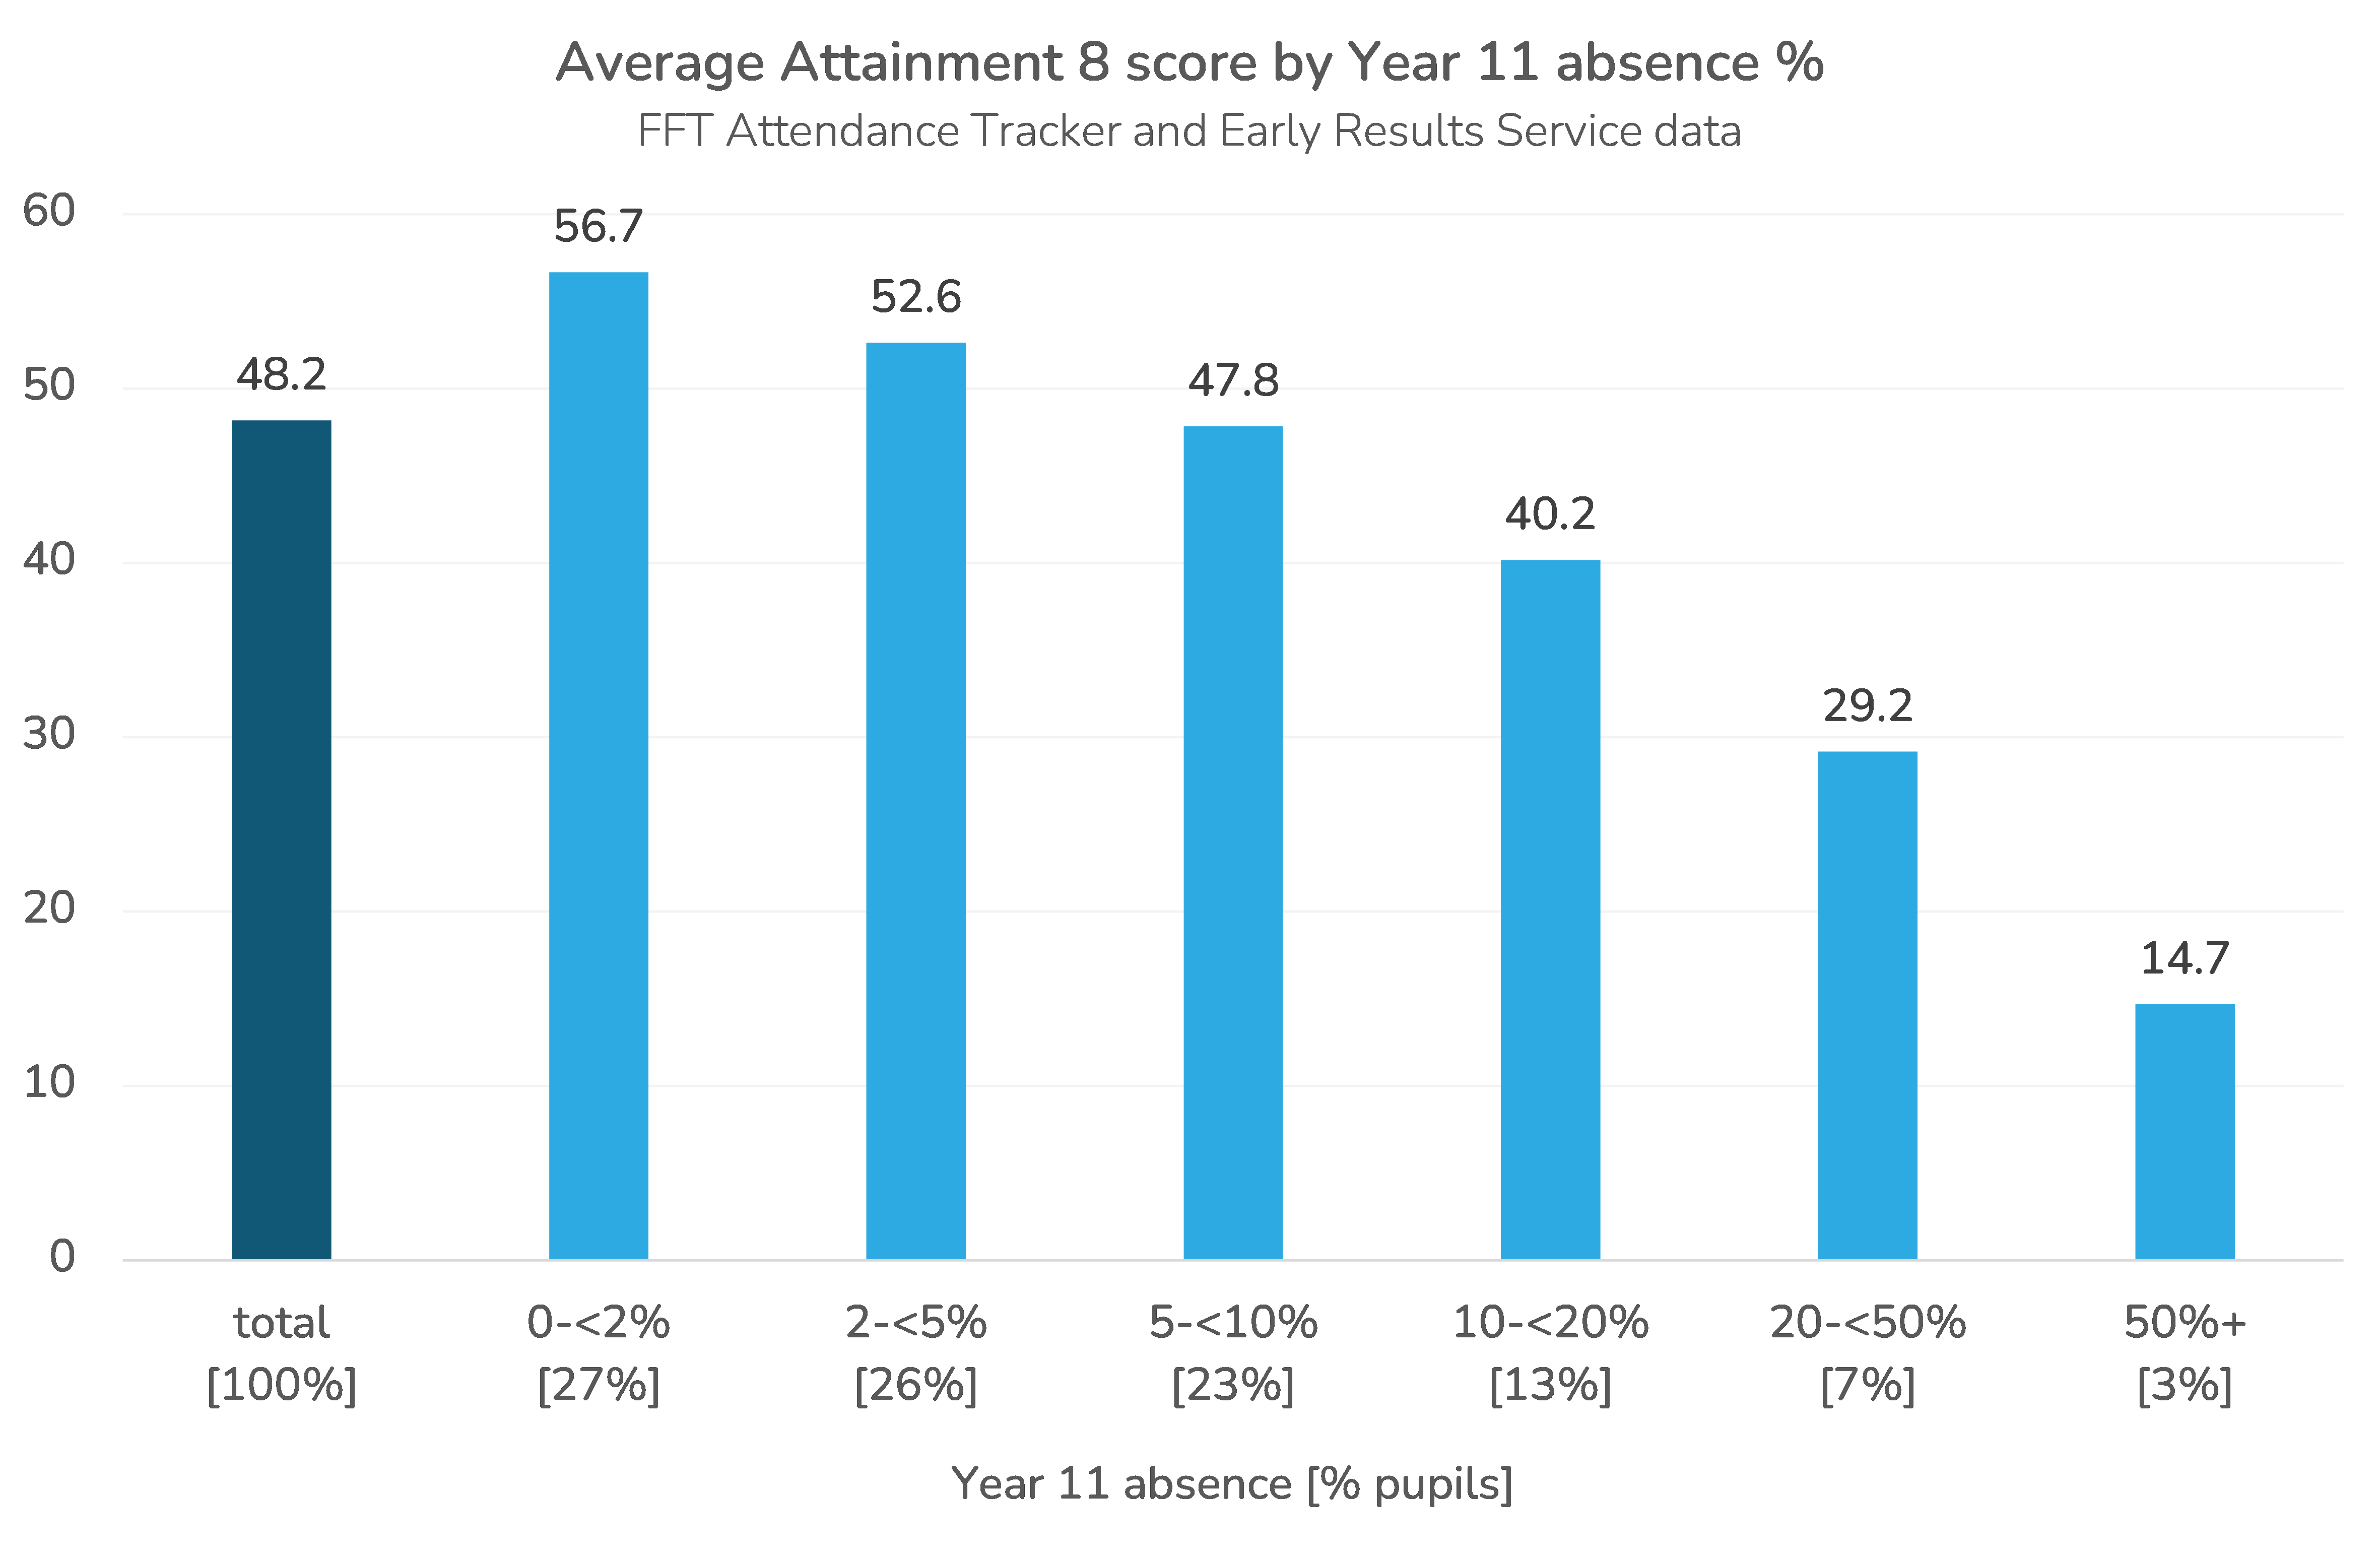
As we’d expect, average attainment falls with increasing absence. Pupils in our sample who missed less than 2% of sessions had the highest Attainment 8 score, 56.7, while those who missed 50% or more had the lowest, 14.7.
To make these differences a bit more tangible, dividing Attainment 8 by ten is roughly equivalent to the average grade pupils achieved across their eight eligible qualifications[2]. So, for example, the difference between pupils who missed less than 2% of sessions and 5-10% of sessions is equivalent to just under one grade per qualification.
Accounting for Year 10 absence
Now let’s bring Year 10 absence rates into the picture. Below, we again plot mean Attainment 8 scores by Year 11 absence grouping (along the horizontal axis), but this time we separate pupils in each grouping by their Year 10 absence rate (each of the dots). We don’t plot any groupings with fewer than 1,000 pupils, and you can download the underlying data here (pdf).
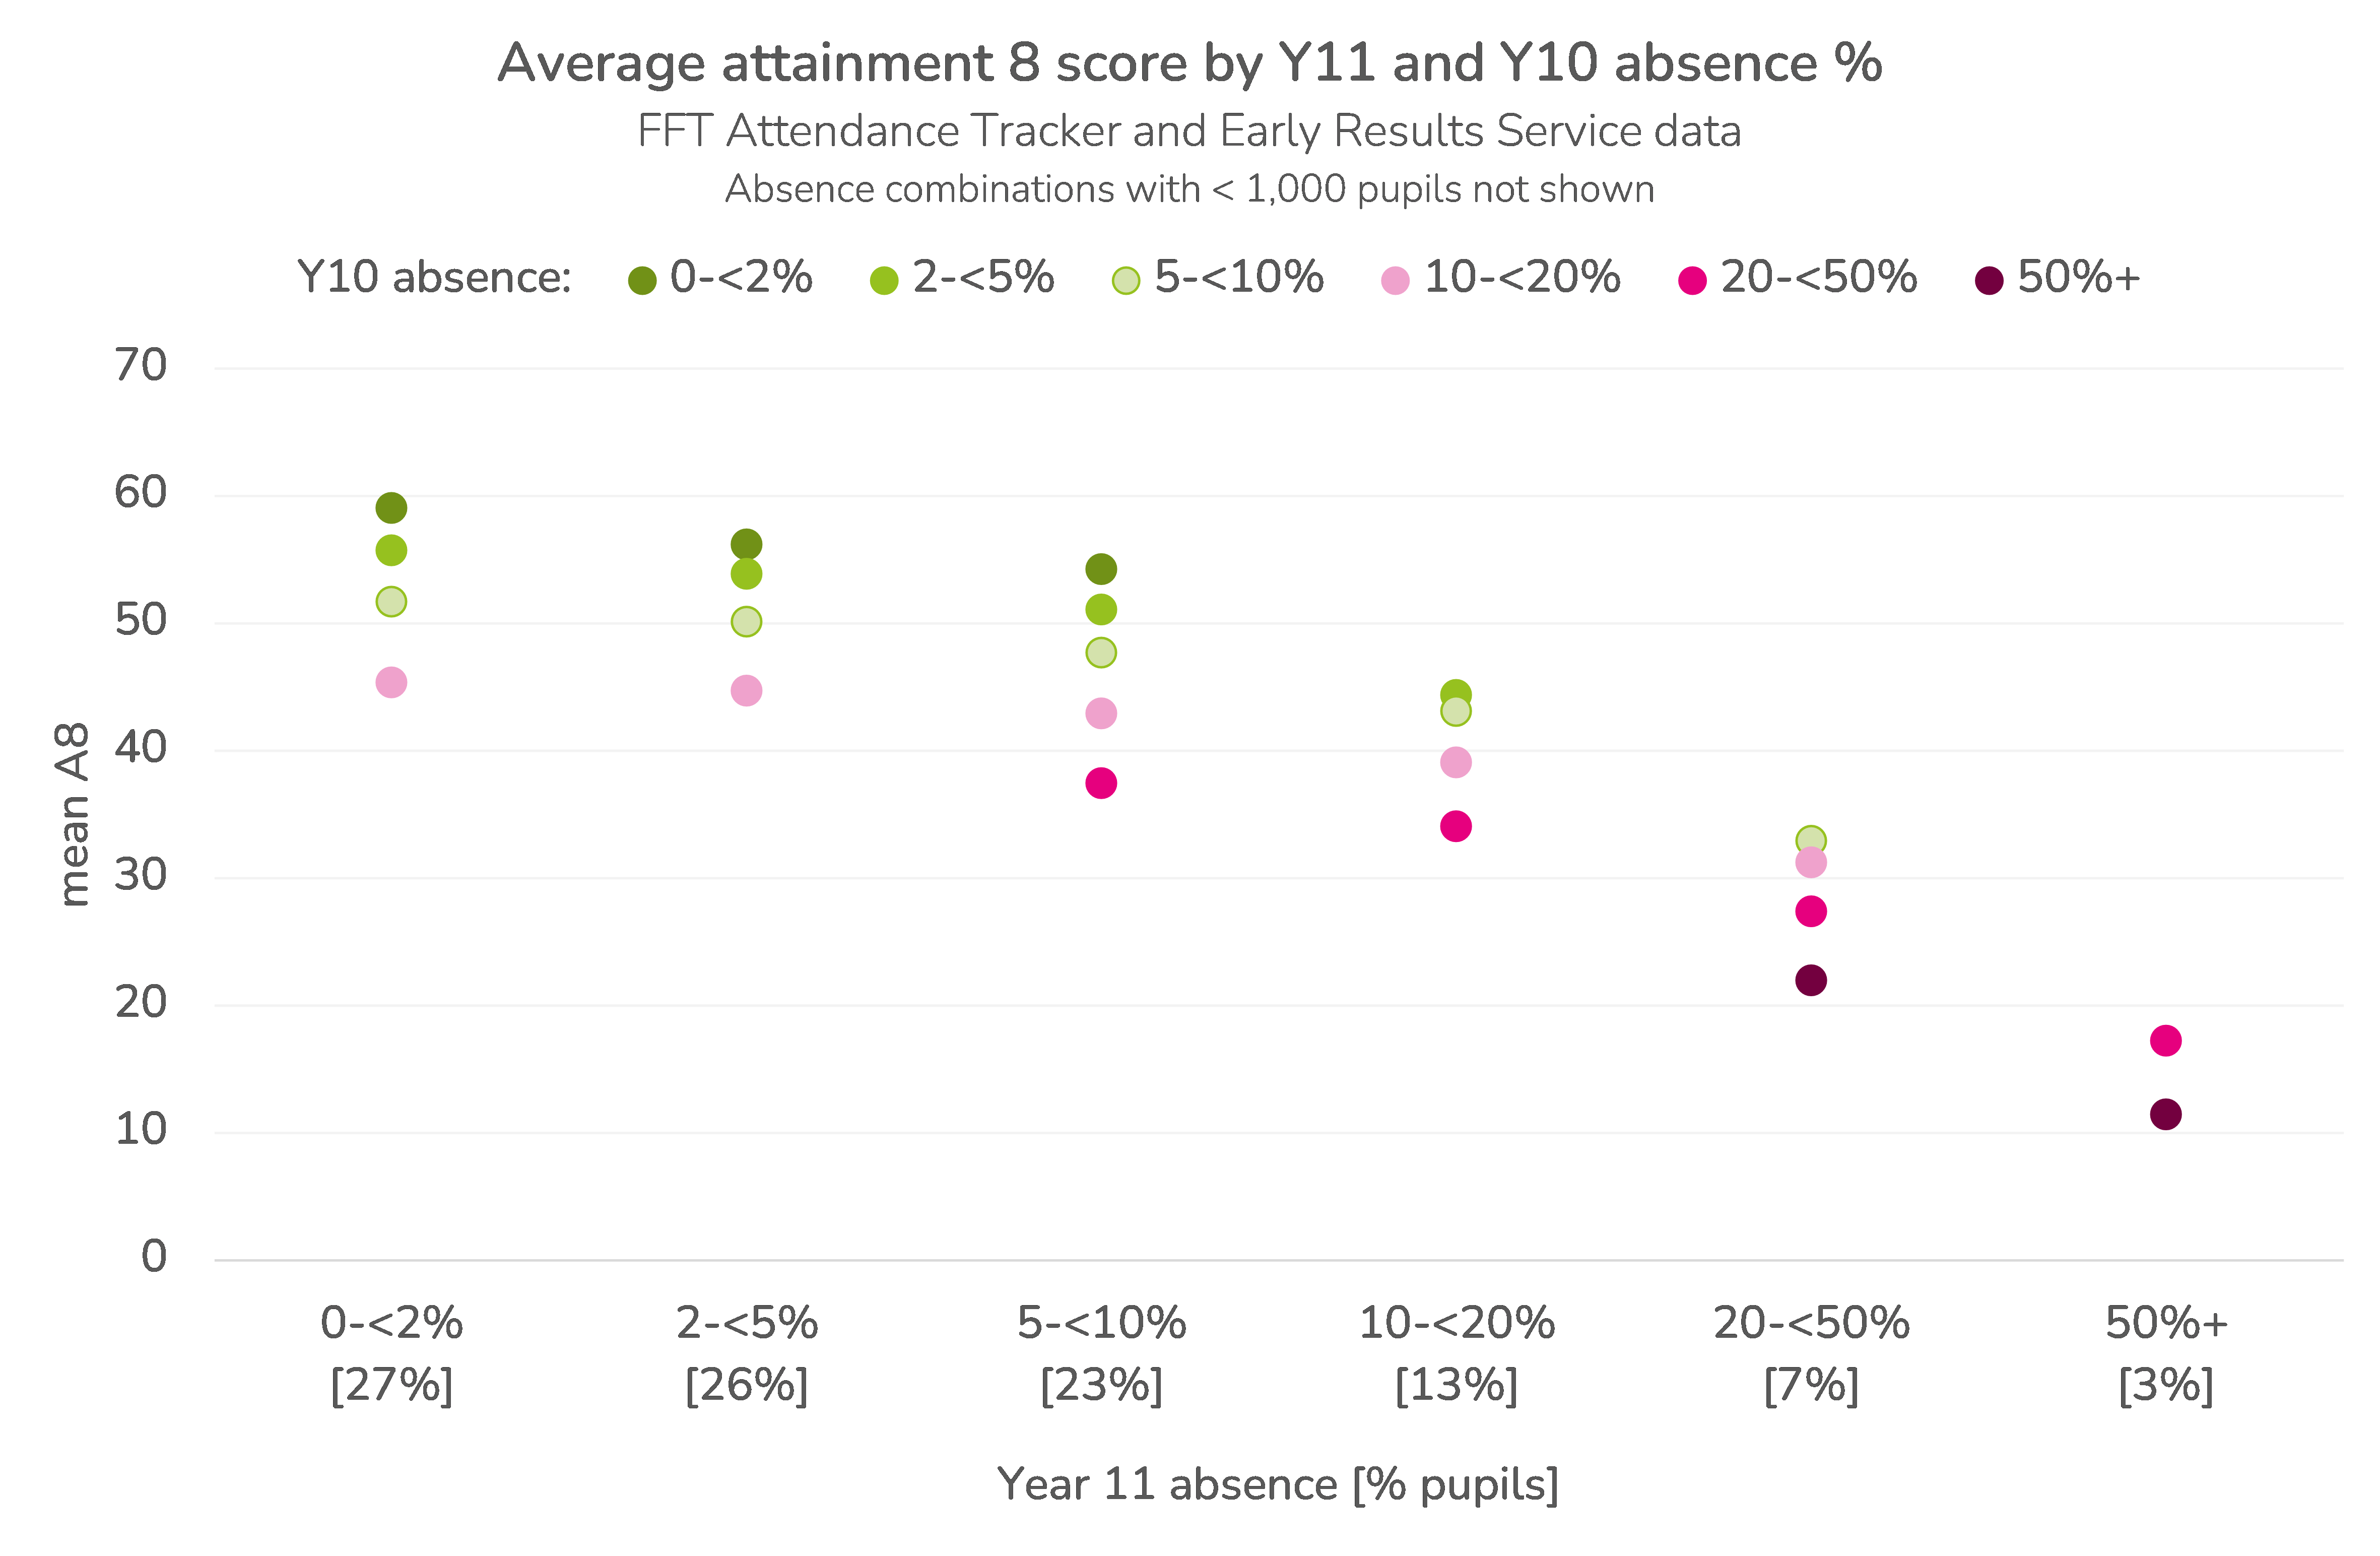
There are a few interesting patterns to unpick. The first is that when we focus on each set of coloured dots separately, we don’t see Attainment 8 scores drop by as much with each increase in Year 11 absence as we saw when we looked at the relationship in the overall population. For example, for those who missed less than 2% of sessions in Year 10 (the darkest green), Attainment 8 varied from 59.1 for those who missed less than 2% of sessions in Year 11 to 54.3 for those who missed between 5 and 10%, a difference of just under 5 points, or half a grade. This is around half the difference between these two absence groupings in the Year 11 population overall. That said, the relationship doesn’t disappear completely.
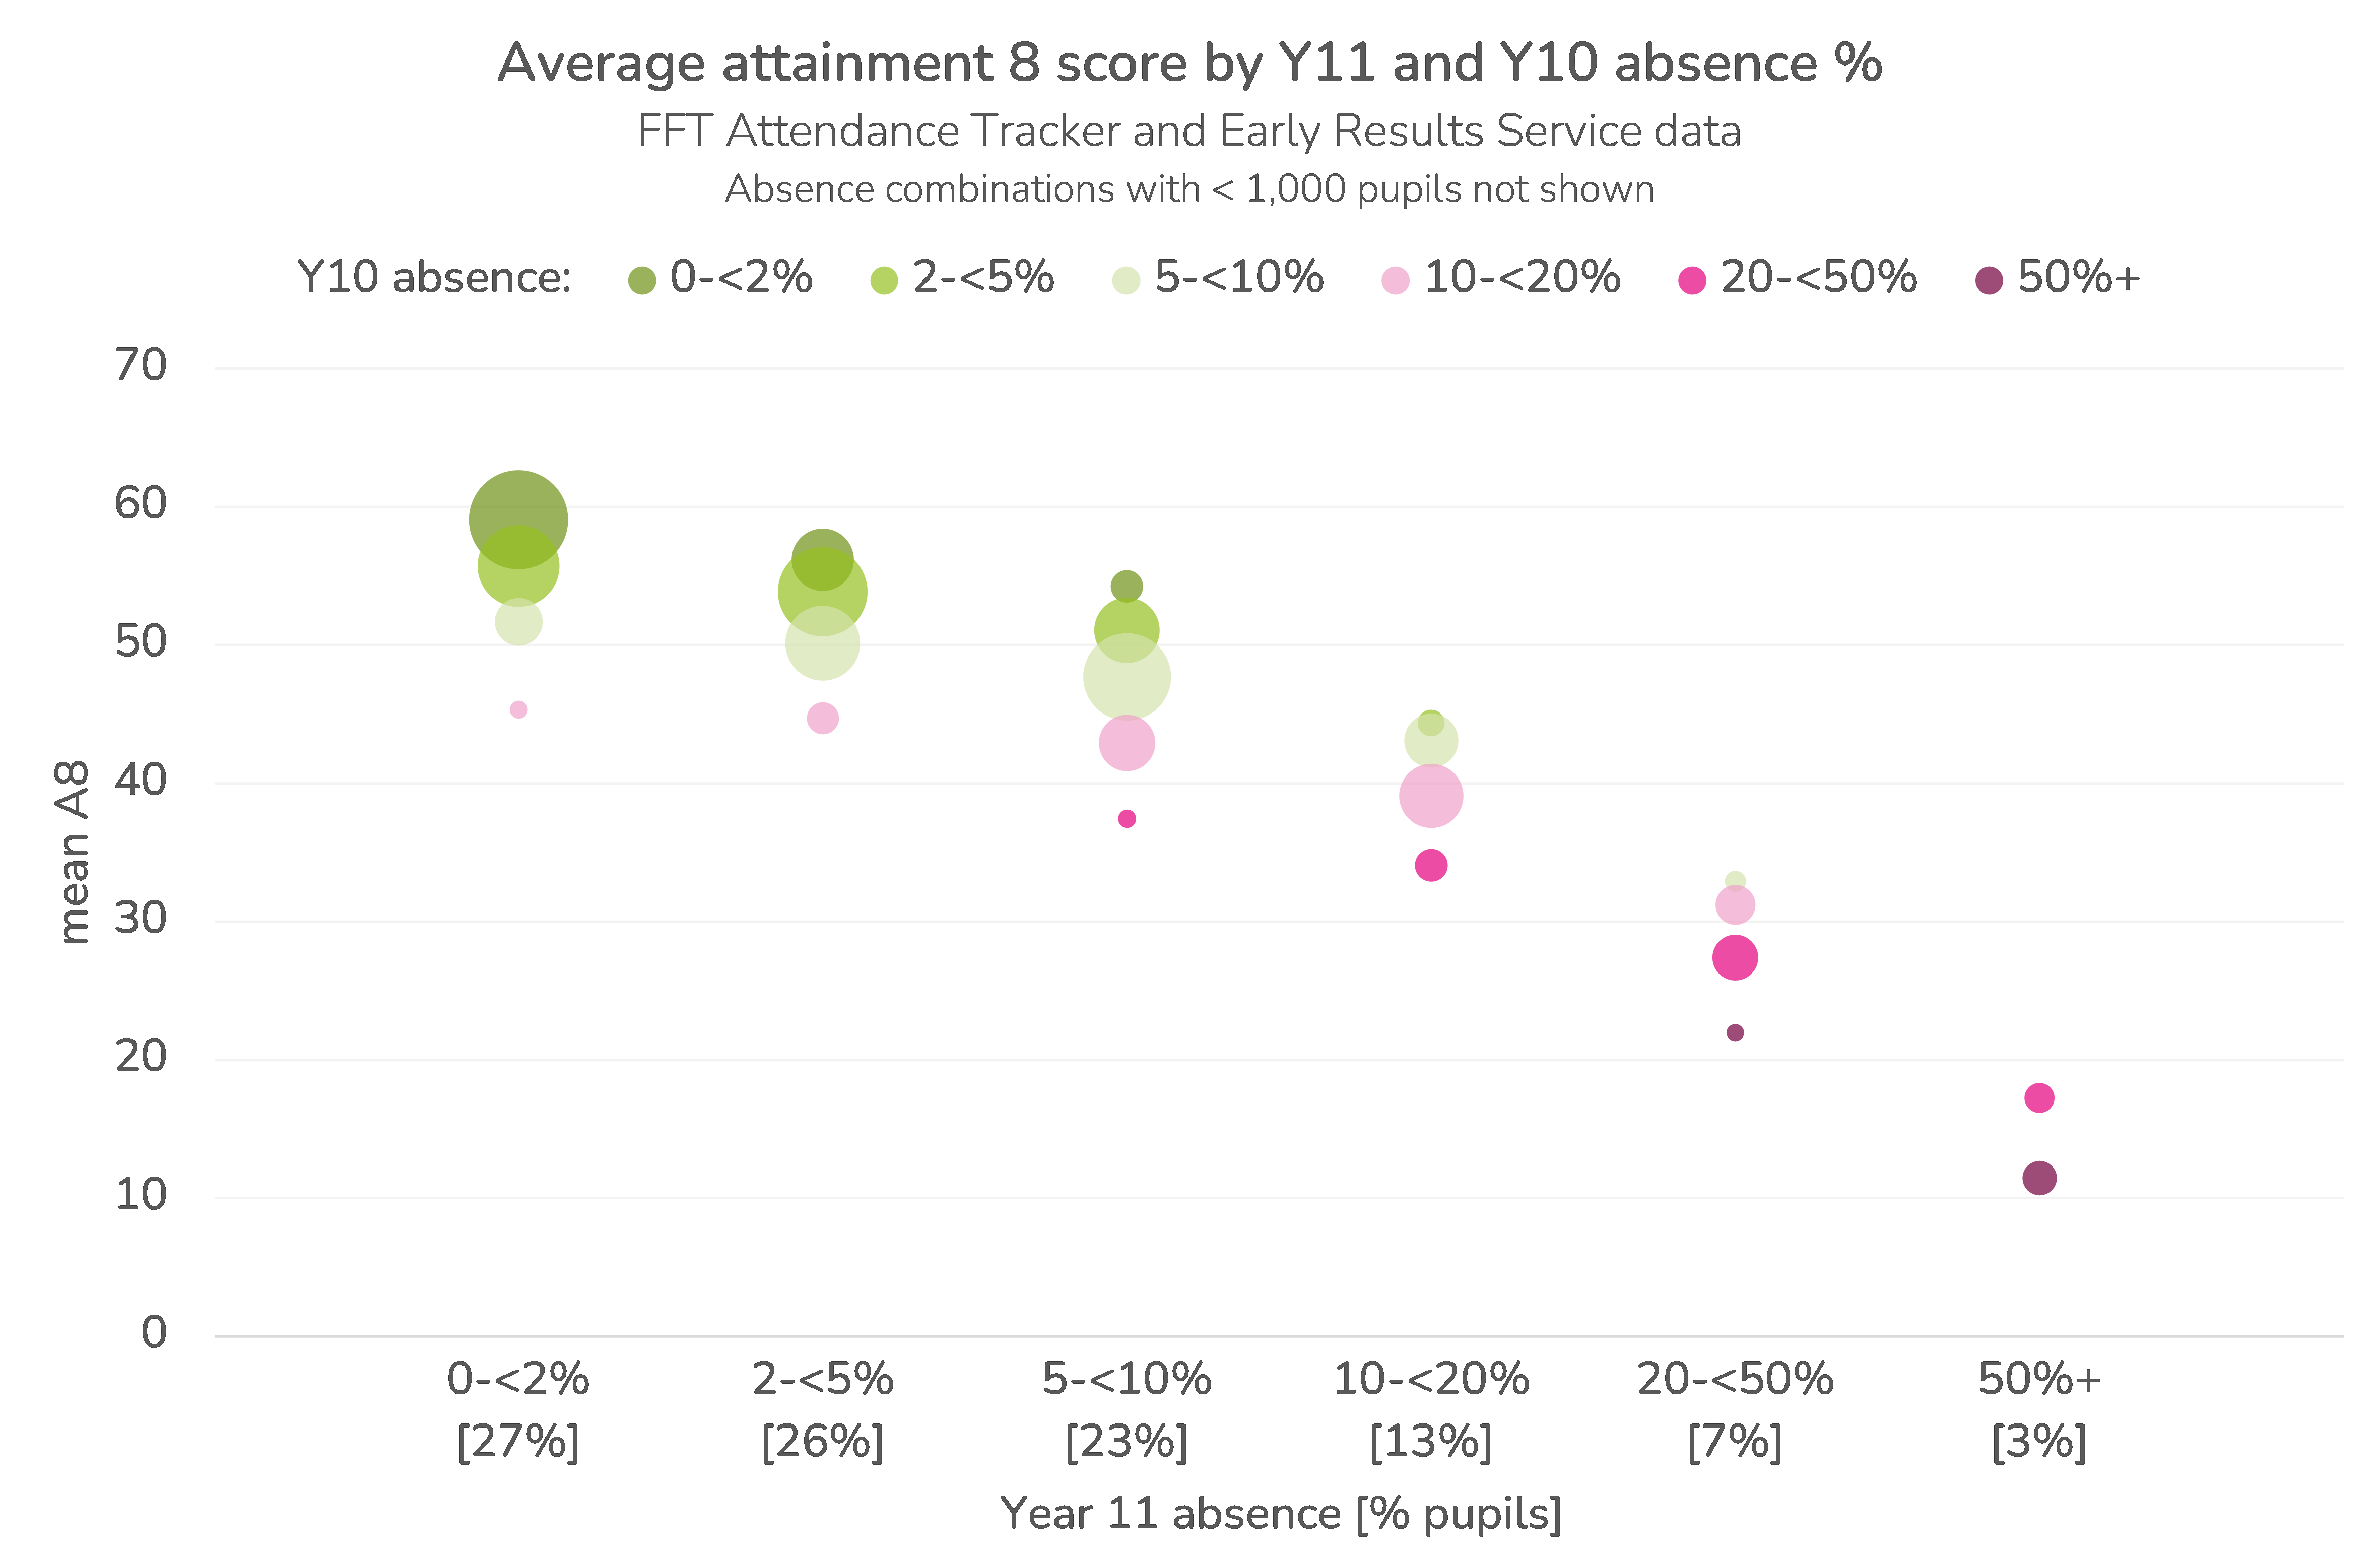
Of course, not all of these combinations are equally likely. It’s very unlikely that a pupil with an absence rate of 0-2% in Year 10 would go on to miss 50%+ of sessions in Year 11, for example. And that’s because absence in Year 10 and 11 are correlated. Or, in other words, pupils who miss a lot of school in Year 10 will tend to miss a lot in Year 11 too, and vice versa. We therefore produce a second version of the above plot, this time with the size of the points scaled by the number of pupils observed.
Sign up to our newsletter
If you enjoy our content, why not sign up now to get notified when we publish a new post, or to receive our half termly newsletter?
When we focus on a single Year 11 absence grouping, we see considerable variation. For example, among pupils who missed 5-10% of sessions in Year 11, Attainment 8 ranged from 54.3 for those who’d missed 0-2% of sessions in Year 10 to 42.3 for those who’d missed 10-20%, a difference of over a grade, on average. (Attainment 8 was lower still at 37.4 for those who’d missed 20-50% of sessions in Year 10, but this was only the case for a relatively small number of pupils.)
What does this mean?
We’ve shown two things here. The first is that there is an element of the relationship between Year 11 absence and attainment which is captured by absence in Year 10. The second is that there is a relationship between absence in Year 10 and attainment among pupils with the same absence rate in Year 11.
We’ve not shown that absence necessarily causes low attainment, as there are a wide range of factors which correlate both with high absence and low attainment. Though it certainly is the case that pupils with high rates of absence are at risk of low attainment.
Finally, we’ve not shown that Year 11 absence isn’t important. Just that if you’re identifying pupils at risk of low attainment in Year 11 based on their attendance, it might be a good idea to look beyond the current academic year’s figures.
Want to stay up-to-date with the latest research from FFT Education Datalab? Sign up to Datalab’s mailing list to get notifications about new blogposts, or to receive the team’s half-termly newsletter.
[1] At KS2, they included Year 2 absence in their list of things that made pupils comparable to one another, and at KS4, Year 6 absence. In both cases, they used quite a crude measure of was / was not persistently absent.
[2] We divide by ten rather than eight because English and maths are double counted.


Have you investigated these patterns using the subset of students for which you have CAT4 data and your CAT based progress measure? – How much of the variation in attainment 8 between best and worst attending groups is related to differences in start point and how much to ‘lost learning’ in key stage 3 and 4?
Hi Mike. The patterns overall are pretty similar in both versions. As in, we see both A8 and CAT4-based-P8 decrease with each increase in Y11 absence, but the decrease becomes less pronounced when we account for Year 10 absence (CAT4-based-P8 version available here). The relationship is slightly weaker in the P8 version, which makes sense because we’d expect absence and baseline attainment to be negatively correlated. We’d need to do some further work to answer your question fully though, not least bringing in absence rates in earlier years.
Hi,
I will like to know if there can be an analysis of the GCSE attainment of EAL and non-EAL students with similar attendance.
Hi, no plans just now but it’s the type of thing we often write about. Do you have a hypothesis?