With attainment in London, Greater Manchester and the Black Country, the focus of City Challenge initiatives, apparently no longer giving cause for concern, the spotlight has shifted to coastal towns and rural areas. The 2014 report of Her Majesty’s Chief Inspector of Schools, for example, drew attention to the problems faced by schools in such areas in recruiting teachers.
In this blog, we look at the progress made by pupils between Key Stage 2 and Key Stage 4 in coastal schools. We firstly measure the straight-line distance to the nearest coast for every secondary school. This in itself raises some interesting questions- where exactly does the River Mersey become the Irish Sea? Having made some pragmatic decisions to take care of estuaries, we define a coastal school as one that is within 5.5km of the coast.
In Chart 1, we show Progress 8 for 2014 for coastal schools and other schools broken down by Pupil Premium eligibility. The results are stark: Pupil Premium pupils attending coastal schools achieved an average Progress 8 score of -5.2, equivalent to over half a grade per subject in the 10 subjects counted in the measure (with double weighting for English and maths). A school achieving such a score would be below the proposed DfE floor standard for 2016. The gap in Progress 8 between Pupil Premium pupils and their peers is wider in coastal schools than in other schools. Entry patterns drive some of this difference. Pupil Premium pupils in coastal schools were entered for an average of 8.4 subjects (8.7 subjects in other schools) compared to a national average for all pupils of 9.2 subjects.
Chart 1: Progress 8 2014 by Pupil Premium Eligibility and School Location

To some extent, Chart 1 does not offer a fair comparison. The Pupil Premium group in coastal schools may tend to differ in other respects from the Pupil Premium group in other schools. For instance, there are variations in progress between white pupils and those from minority ethnic backgrounds. If a higher proportion of the Pupil Premium group in coastal schools is from a White background then the gap in progress between coastal schools and other schools should come as no surprise. 92% of Pupil Premium pupils attending Coastal schools are White British compared to 64% of Pupil Premium pupils attending other schools. Chart 2 shows little difference between coastal schools and other schools in the average Progress 8 score of this group.
Chart 2: Progress 8 2014 by Pupil Premium Eligibility and School Location, White British pupils

Moreover, the impact of growing up in disadvantaged circumstances may also differ by area. Should we compare Pupil Premium pupils in coastal towns with those in the major cities for whose families a greater level of employment opportunity arguably exists? This can be explored using the ONS Output Area Classification (OAC). Using 2011 census data, it divides all 181 thousand output areas in England and Wales into twenty seven groups based upon a range of demographic, socio-economic, housing and employment indicators. As we show in Table 1, over 80% of Pupil Premium pupils attending coastal schools are resident in nine of the OAC groups compared to just under half of similar pupils attending other schools. By contrast, just 14% of all pupils attending schools in London are resident in such areas.
Table 1: Residence by OAC group and school type, pupils reaching the end of Key Stage 4 in 2014
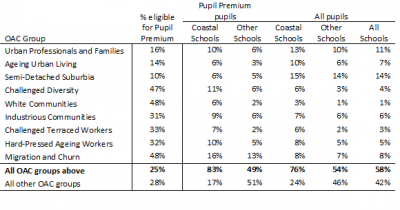
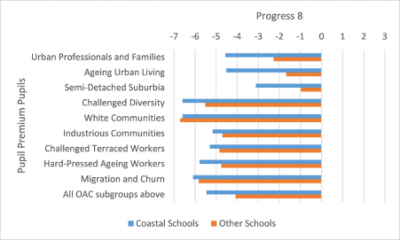
Chart 3 shows that the Progress 8 gap between coastal schools and other schools is much less pronounced in some types of area than others. In fact, it is in the types of area in which higher percentages of pupils are eligible for the Pupil Premium that the gap is narrowest. Nationally, almost half of pupils resident in areas classified as ‘white communities’, ‘industrious communities’ and ‘migration and churn’ are eligible for the Pupil Premium, compared to less than 20% of those resident in areas classified as ‘urban professionals and families’, ‘ageing urban living’ and ‘semi-detached suburbia’. Moreover, the Progress 8 scores of pupils not eligible for the Pupil Premium but resident in the most disadvantaged areas tended to be slightly better if they attended coastal schools.
Chart 3: Progress 8 2014 by Pupil Premium Eligibility, OAC Group and School Location

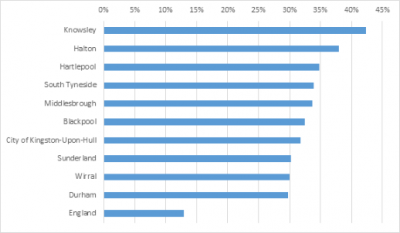
In 2014, almost three-quarters of White British pupils eligible for the Pupil Premium who reached the end of Key Stage 4 in mainstream schools were resident in the nine OAC areas shown in Table 1 and Chart 3. This group of pupils formed around 13% (one in eight) of the national cohort. As Chart 4 shows, they tend to be most concentrated in small, Northern unitary authorities.
Chart 4: The 10 local authorities with the highest percentages of pupils who were White British, eligible for the Pupil Premium and resident in the nine key OAC areas, Key Stage 4 2014
The low rate of relative progress from Key Stage 2 to Key Stage 4 among Pupil Premium pupils attending coastal schools should not be ignored. That said, it is likely to improve over the next few years by entering such pupils in more of the qualifications that count in Progress 8. But when we examine low achievement in coastal areas what we mostly see is low achievement by White British pupils living in disadvantaged areas. Coastal schools tend to have more than their fair share of both. There are similar pockets elsewhere, particularly in towns and smaller cities in the North of England. There has been plenty written in the search for the secret of London’s recent success, much concerned with lessons for wider system improvements. But would we necessarily expect what worked in a diverse, dynamic, global city to flourish in other environments?


I can’t seem to find a list anywhere of schools considered to be coastal schools, you rightly point out the issues with where the coast starts. The Thames is tidal to Teddington…. Using a map of the coastline, provider URNs, their postcodes, and corresponding Easting & Northing, I rolled my own. https://drive.google.com/open?id=0B1xf_L-jCIzYdHhBUmtqM1NCaEE How close is it to yours?
Hi Peter. Thanks for commenting. Send us an email at educationdatalab@fft.org.uk and we’ll send you something.