At our NPD training course last month we discussed the problem of what to do when a test is not universally sat by every pupil in every year. One good example is the Key Stage Two maths extension paper, sat by some 11 year olds in the years up to 2002 and then between 2012 and 2014.
The extension paper was introduced and removed as politicians traded-off the costs of delivery against a desire to measure and stretch the most mathematically capable 11 year olds. Here we examine one aspect of this trade-off by seeing whether the extension marks pupils achieved were likely to have provided any useful information to help secondary schools make setting and teaching decisions.
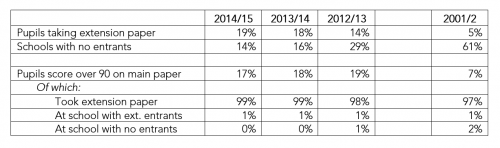
One problem with the test is that it is a partial signal of maths capability because not all pupils ever sat the extension paper. For example, in 2001/2 no students took the test in 61% of schools; this was much lower at 14% of schools in 2014/15. That said, almost all pupils scoring over 90/100 on the main paper did sit the extension paper each year.
Of course, students who performed well in the extension paper went on to do well in their GCSEs
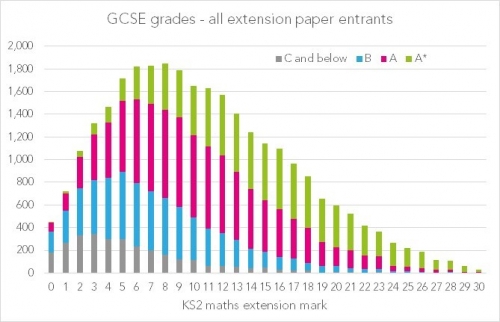
For the students who sat the age 11 maths extension paper in 2001/2 we can observe their eventual maths GCSE grade. The chart below shows that, generally, those with a higher maths extension score were more likely to achieve an A* or an A grade at GCSE. However, this doesn’t tell us whether the extension paper gives us new information on likely future exam performance, given we already know the student’s mark on their main maths papers.
Extension paper gives us little extra information over and above main paper for most students
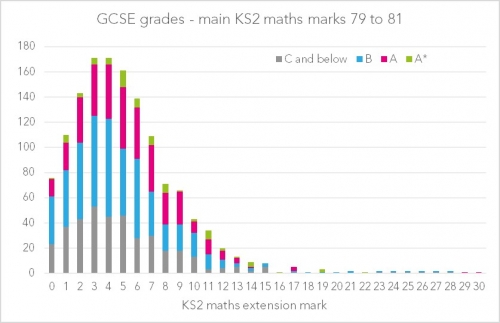
In the four charts below we again show the distribution of GCSE grades achieved against the extension test paper, but this time separately for groups of students with similar marks on the maths main paper. The first chart shows there is little relationship between extension marks and GCSE grades achieved within the group of students who scored 79-81 on the main paper. For this group, their typical marks on the extension papers were very low indicating they had difficulty in accessing the test and so it isn’t a good discriminator of their mathematical capabilities.
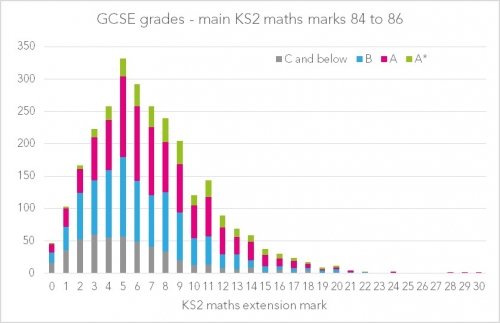
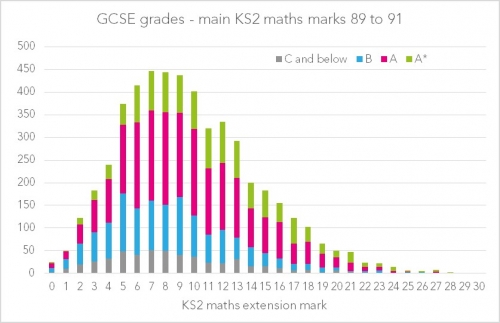
The next two charts show there is also relatively little relationship between the extension paper mark and the GCSE grade for the groups scoring 84-86 and 89-91, respectively. So far, the extension paper doesn’t seem to be particularly useful in telling us about the capabilities of the students (over and above their main paper mark).
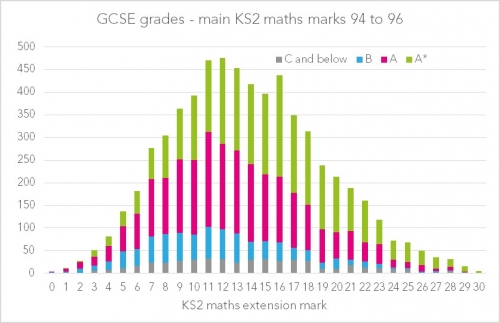
However, all this changes when we look at the group who scored close to full marks in the main paper (94-96). Below we can see that these students scored across the full range of marks on the extension paper from 0 to 30 and that those scoring the higher marks were indeed more likely to go on and achieve an A*.
This all suggests that asking students to sit an extension paper was not an efficient route to yielding more precise information on maths capability, except for the minority of very high achieving students. It is interesting that the extension paper mark is not as strongly related to the student’s eventual GCSE grade as we might expect. We don’t know why. The data could be used to suggest that maths competency is relatively fluid and amenable to change through teaching at secondary school. Alternatively, primary school preparation for the extension paper rather than underlying maths capabilities might have largely determined the student’s extension mark.


An interesting analysis. Would be good to extend by using ML regression, predicting GCSE maths outcome by various Student characteristics plus baseline prior attainment in main test and adding in a measure of whether or not student sat test. Could also test a categorical variable e.g did not sit, sat but low marks, sat but medium marks, sat but high marks. You could get an estimate of extra variance accounted for plus ES for the extension test.
Ideally you’d use cross classified ML models to control for primary & secondary school effects simultaneously.
Thanks for taking the time to respond. I ran some ML models (not cross-classified because I didn’t want to stare at a screen failing to converge for days!) but didn’t report them here. Student baseline attainment in the 3 main maths papers (A+B+arithmetic) explains 49.05% of GCSE variance. Adding those categorical indicators for scoring low, mid and high adds almost nothing to to the explanatory power of the model (raises it to 49.22%), though they are statistically significant. The coefficients of all three are positive compared to not sitting the extension paper: scoring over 10 is associated with doing 0.4 of a GCSE grade better than not sitting the test at all. You are correct that we’d have to account for primary school characteristics and social gradients in progress since it is the more disadvantaged primary schools where no students sat the test. So definitely not a causal story here!