This is the first of two posts in a series of blogposts looking at the relationship between Key Stage 1 attainment and Key Stage 4 outcomes. The second post can be found here.
There are many ways of defining success at Key Stage 4.
One aspect is whether pupils have attained appropriate literacy and numeracy skills.
This analysis looks at outcomes in English at KS4 linked to pupils’ attainment at KS1, including a look at the relationship between outcomes and some pupil characteristics[1].
Exploring the link
The table below shows, for each combination of reading and writing attainment at KS1, the percentage of pupils attaining grade C or higher in English at KS4. Cases where the combination has fewer than 500 pupils are excluded. Most cells are based on more than 1,000 pupils – and 70% of cells are based on more than 10,000 pupils.

Looking at the diagonals in this table, the variation is quite small – for example 63% of pupils with a 2a in reading and a 1 in writing attained grade C or higher in English at KS4, and the figure for 2c in reading and 2b in writing is 65%.
Using a simple scoring system[2], that ranges from zero points for a working towards Level 1, to five points for a Level 3, the scores for each pupil’s reading and writing Levels can be used to generate an overall score from nought to 10. This combined score will be referred to as KS1RW in the rest of this post.
The chart below shows the percentage attaining C or higher at KS4 for each of these KS1RW scores.
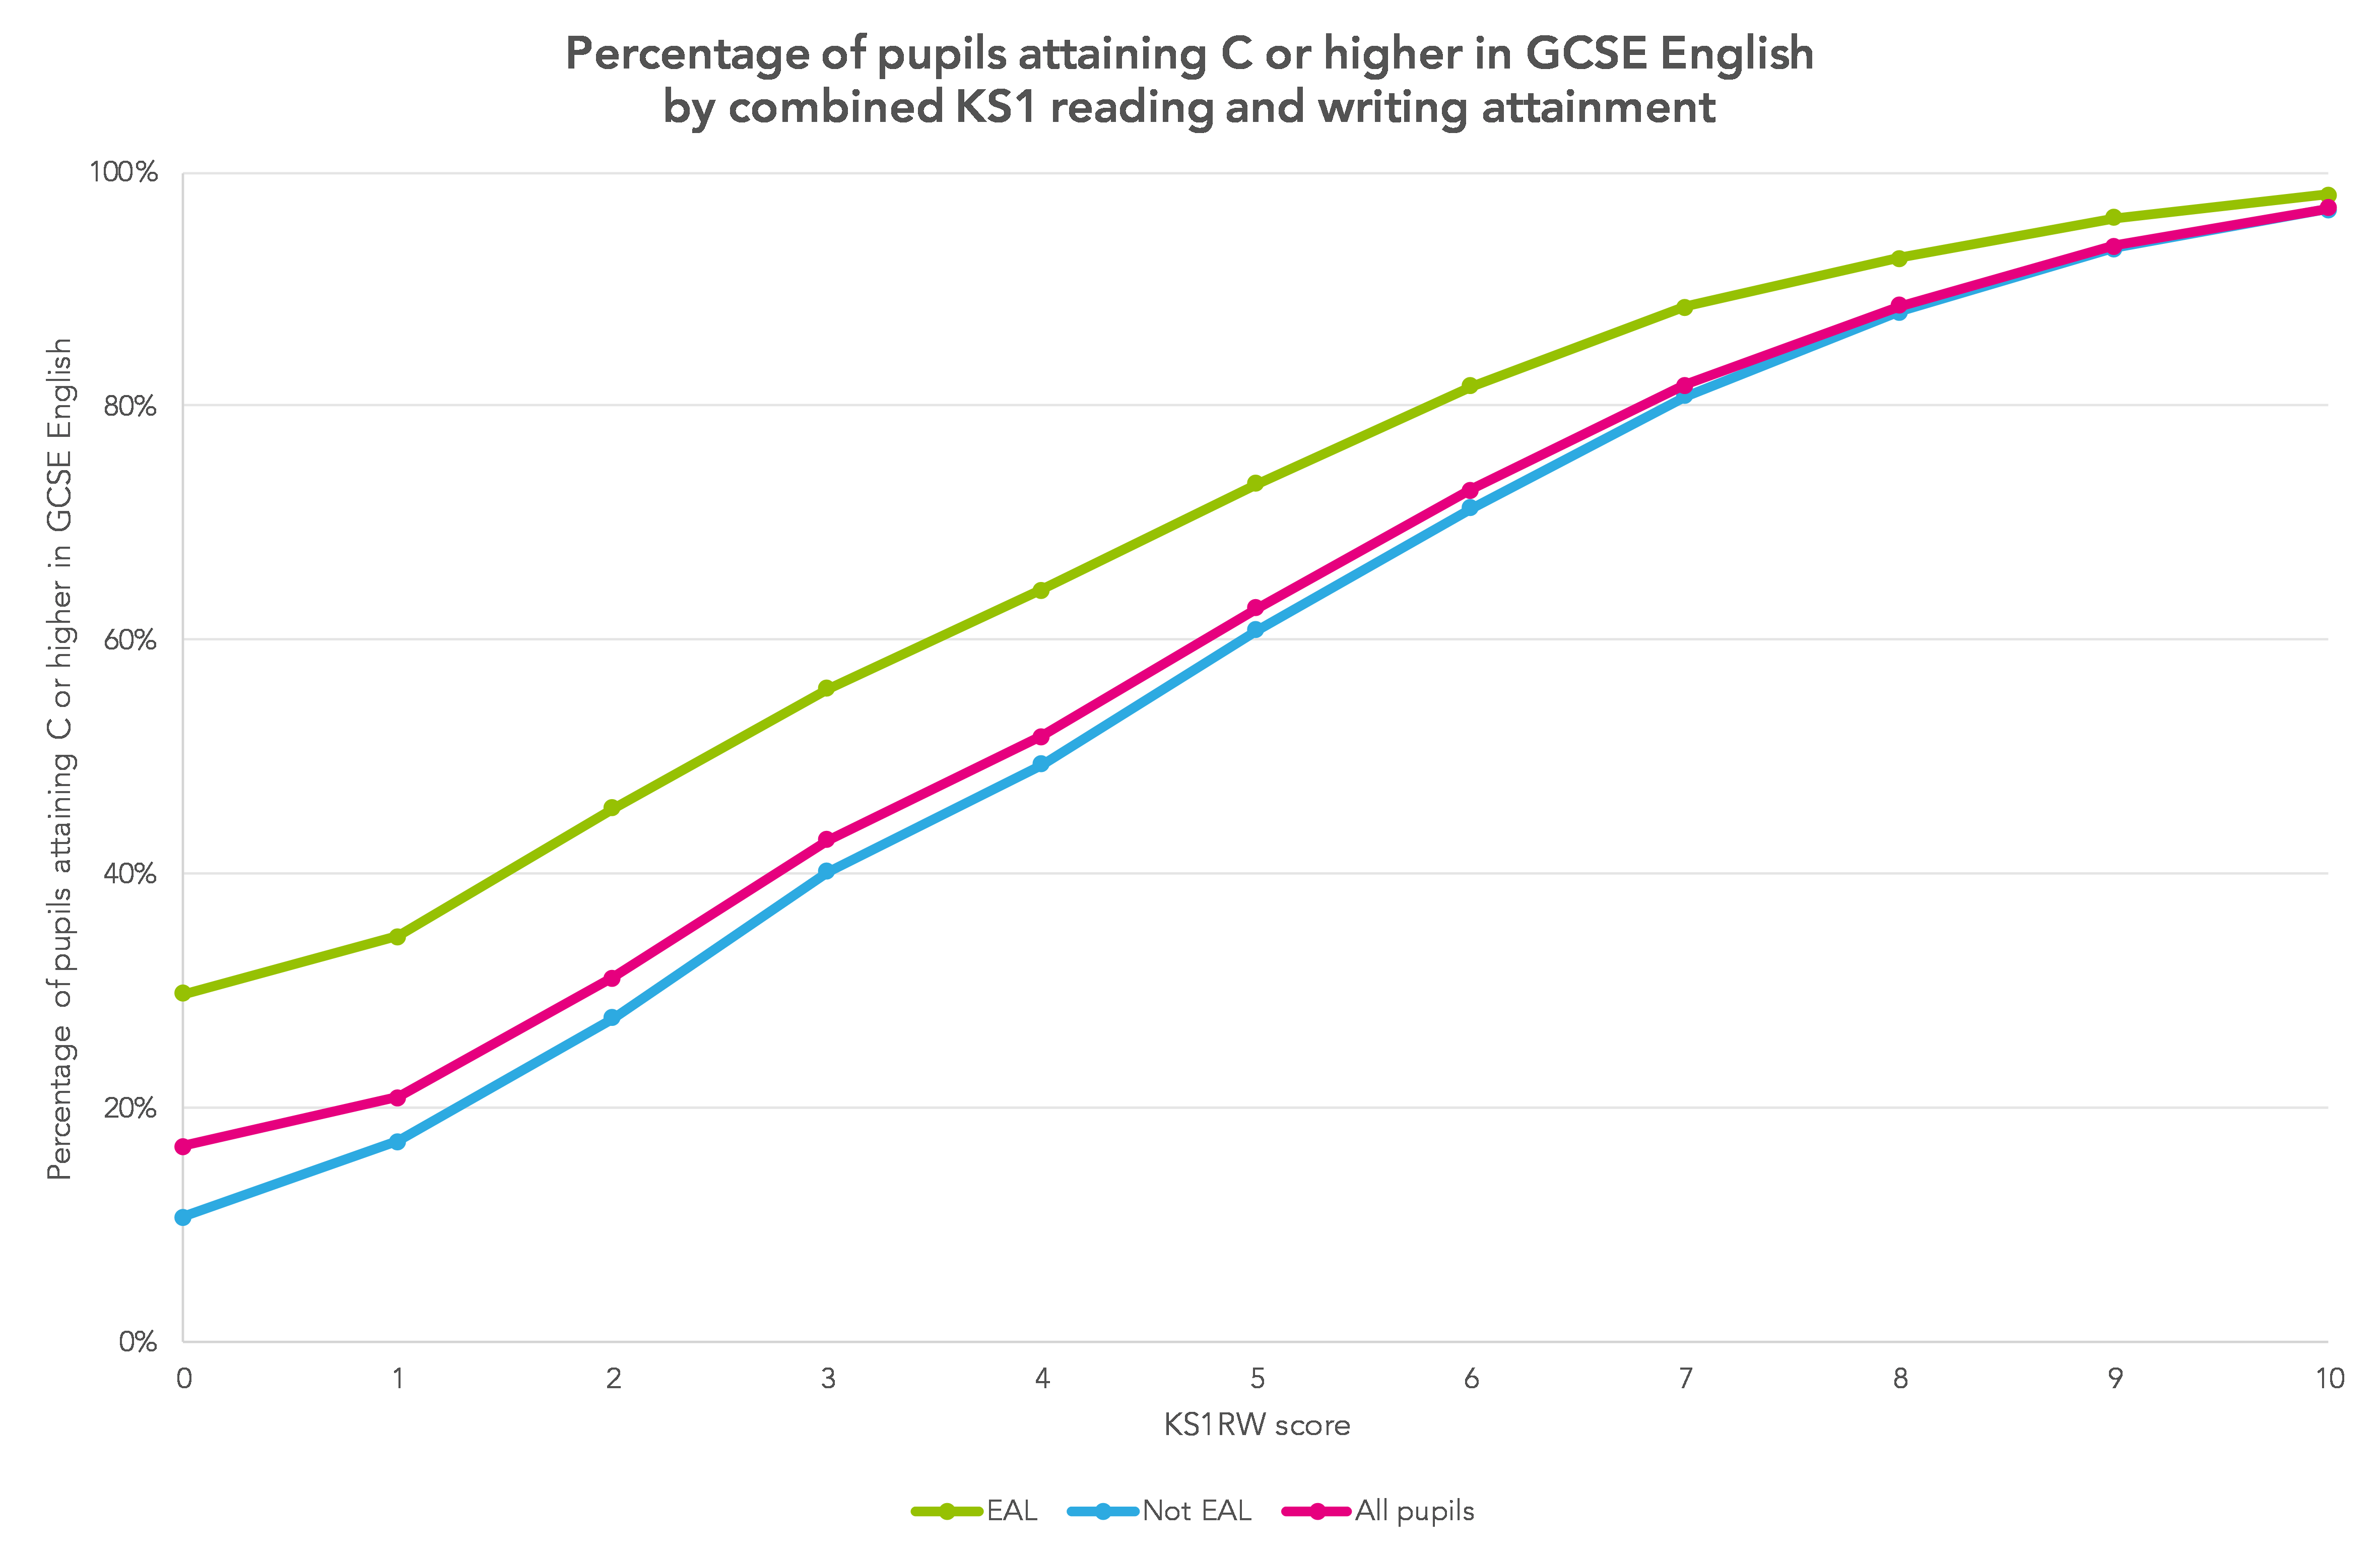
The chart shows data for all pupils, for those who have English as an additional language (EAL), and for those who do not have English as an additional language.
It is clear that, for a given level of attainment at KS1, EAL pupils are more likely to attain a grade C or above at KS4.
This is not surprising – many EAL pupils will be at a lower stage of language development at age seven than other pupils, but, as they progress through the education system, these differences narrow. In the dataset used for this analysis:
- at KS1, 61% of EAL pupils had a KS1RW score of five or higher – 13 percentage points lower than the figure for pupils who were not EAL (74% with a KS1RW score of five or higher);
- at KS4, 73% of EAL pupils attained C or higher in English – two percentage points higher than the figure for pupils who were not EAL (71%).
Pupil characteristics
What about variations by other pupil characteristics – gender, month of birth and free school meals status? Detailed tables, included in this file [PDF], show aggregations based on the following grouping:
- gender;
- term of birth: autumn (pupils born between September and December), spring (January-April) and summer (May-August);
- FSM: three groups based on FSM status in Reception, Year 1 and Year 2 (never FSM-eligible; FSM-eligible for less than 70% of time; FSM-eligible for 70% or more of time);
- EAL: whether or not pupils have English as an additional language.
For each of the groupings, the number of pupils achieving each KS1RW score, and the percentage of pupils attaining a grade C or higher in English at KS4 for each of these scores, is calculated.
For example, if we look at gender groupings:
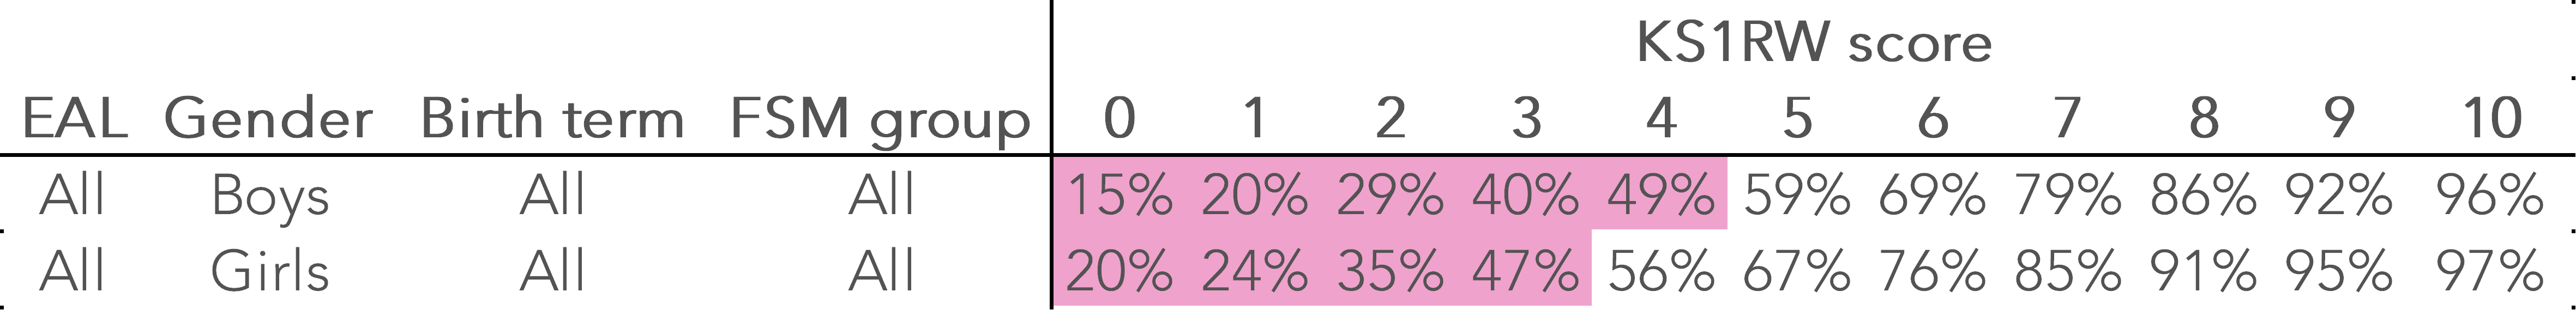
Cases where fewer than 50% of pupils attain grade C or higher in KS4 English are highlighted.
Considering risk
A calculation can be done to calculate a risk factor – the percentage at high risk of not achieving grade C or higher in KS4 English – for each grouping.
This can be done by firstly calculating the total number of pupils that the highlighted cells represent. In the first row of the above table, for example, 162,137 boys have KS1RW scores of 0, 1, 2, 3 or 4.
The total number of boys in the cohort is 493,775, so a percentage high risk figure is calculated as 162,137 divided by 493,775 – a figure of 33%. For girls, the same calculation gives 13% which suggests that, overall, boys are somewhere between two and three times more likely to be in the ‘high risk’ group than girls.
If we look at the most detailed aggregations (the last table in the PDF) then we see even wider variations:
- 66% of boys born in the spring term, who are FSM-eligible for a high proportion of their time in school and have English as their first language, are in the high risk group.
- 6% of girls born in the autumn term, who are never FSM-eligible and have English as their first language, are in the high risk group.
In broad terms, looking across all of the different aggregation tables, we can see that high risk is associated with being a boy, being disadvantaged, and having English as a first language.
In conclusion
It’s clear that KS1 attainment is an important factor in the likelihood of whether pupils attain a grade C or above in English at KS4. And there are some groups at higher risk of not reaching this standard.
But while pupil characteristics and attainment at KS1 have a big influence, they must not be seen as a determining factor for individual pupils.
While a majority of pupils attain close to the average for their group, there are considerable variations. If we look, for example, at the 18,864 pupils who were working towards Level 1 for both reading and writing:
- 37% attained grade E or lower in GCSE English, but
- 16% achieved B or C grades, and
- 140 pupils (1%) achieved an A* or A grade.
Likewise, while the risks for EAL pupils are relatively low, we need to remember that, for the pupils in this dataset, much of their time in school was during a period when there was specific funding and support for EAL pupils. With the removal of this funding and the consequent reduction in support services it will be interesting to see whether or not the progress made by EAL pupils is maintained.
The analyses presented here might help in the identification of support and intervention priorities for pupils post-Key Stage 1 – particularly if schools (both primary and secondary) make use of tools such as Student Explorer in FFT Aspire.
And the data in this analysis is based on KS1 attainment from many years ago – 2006/7 and 2007/8. What has happened since then? A simple way of looking at this is to consider the percentage of pupils with a KS1RW score lower than five, as shown in the chart below.
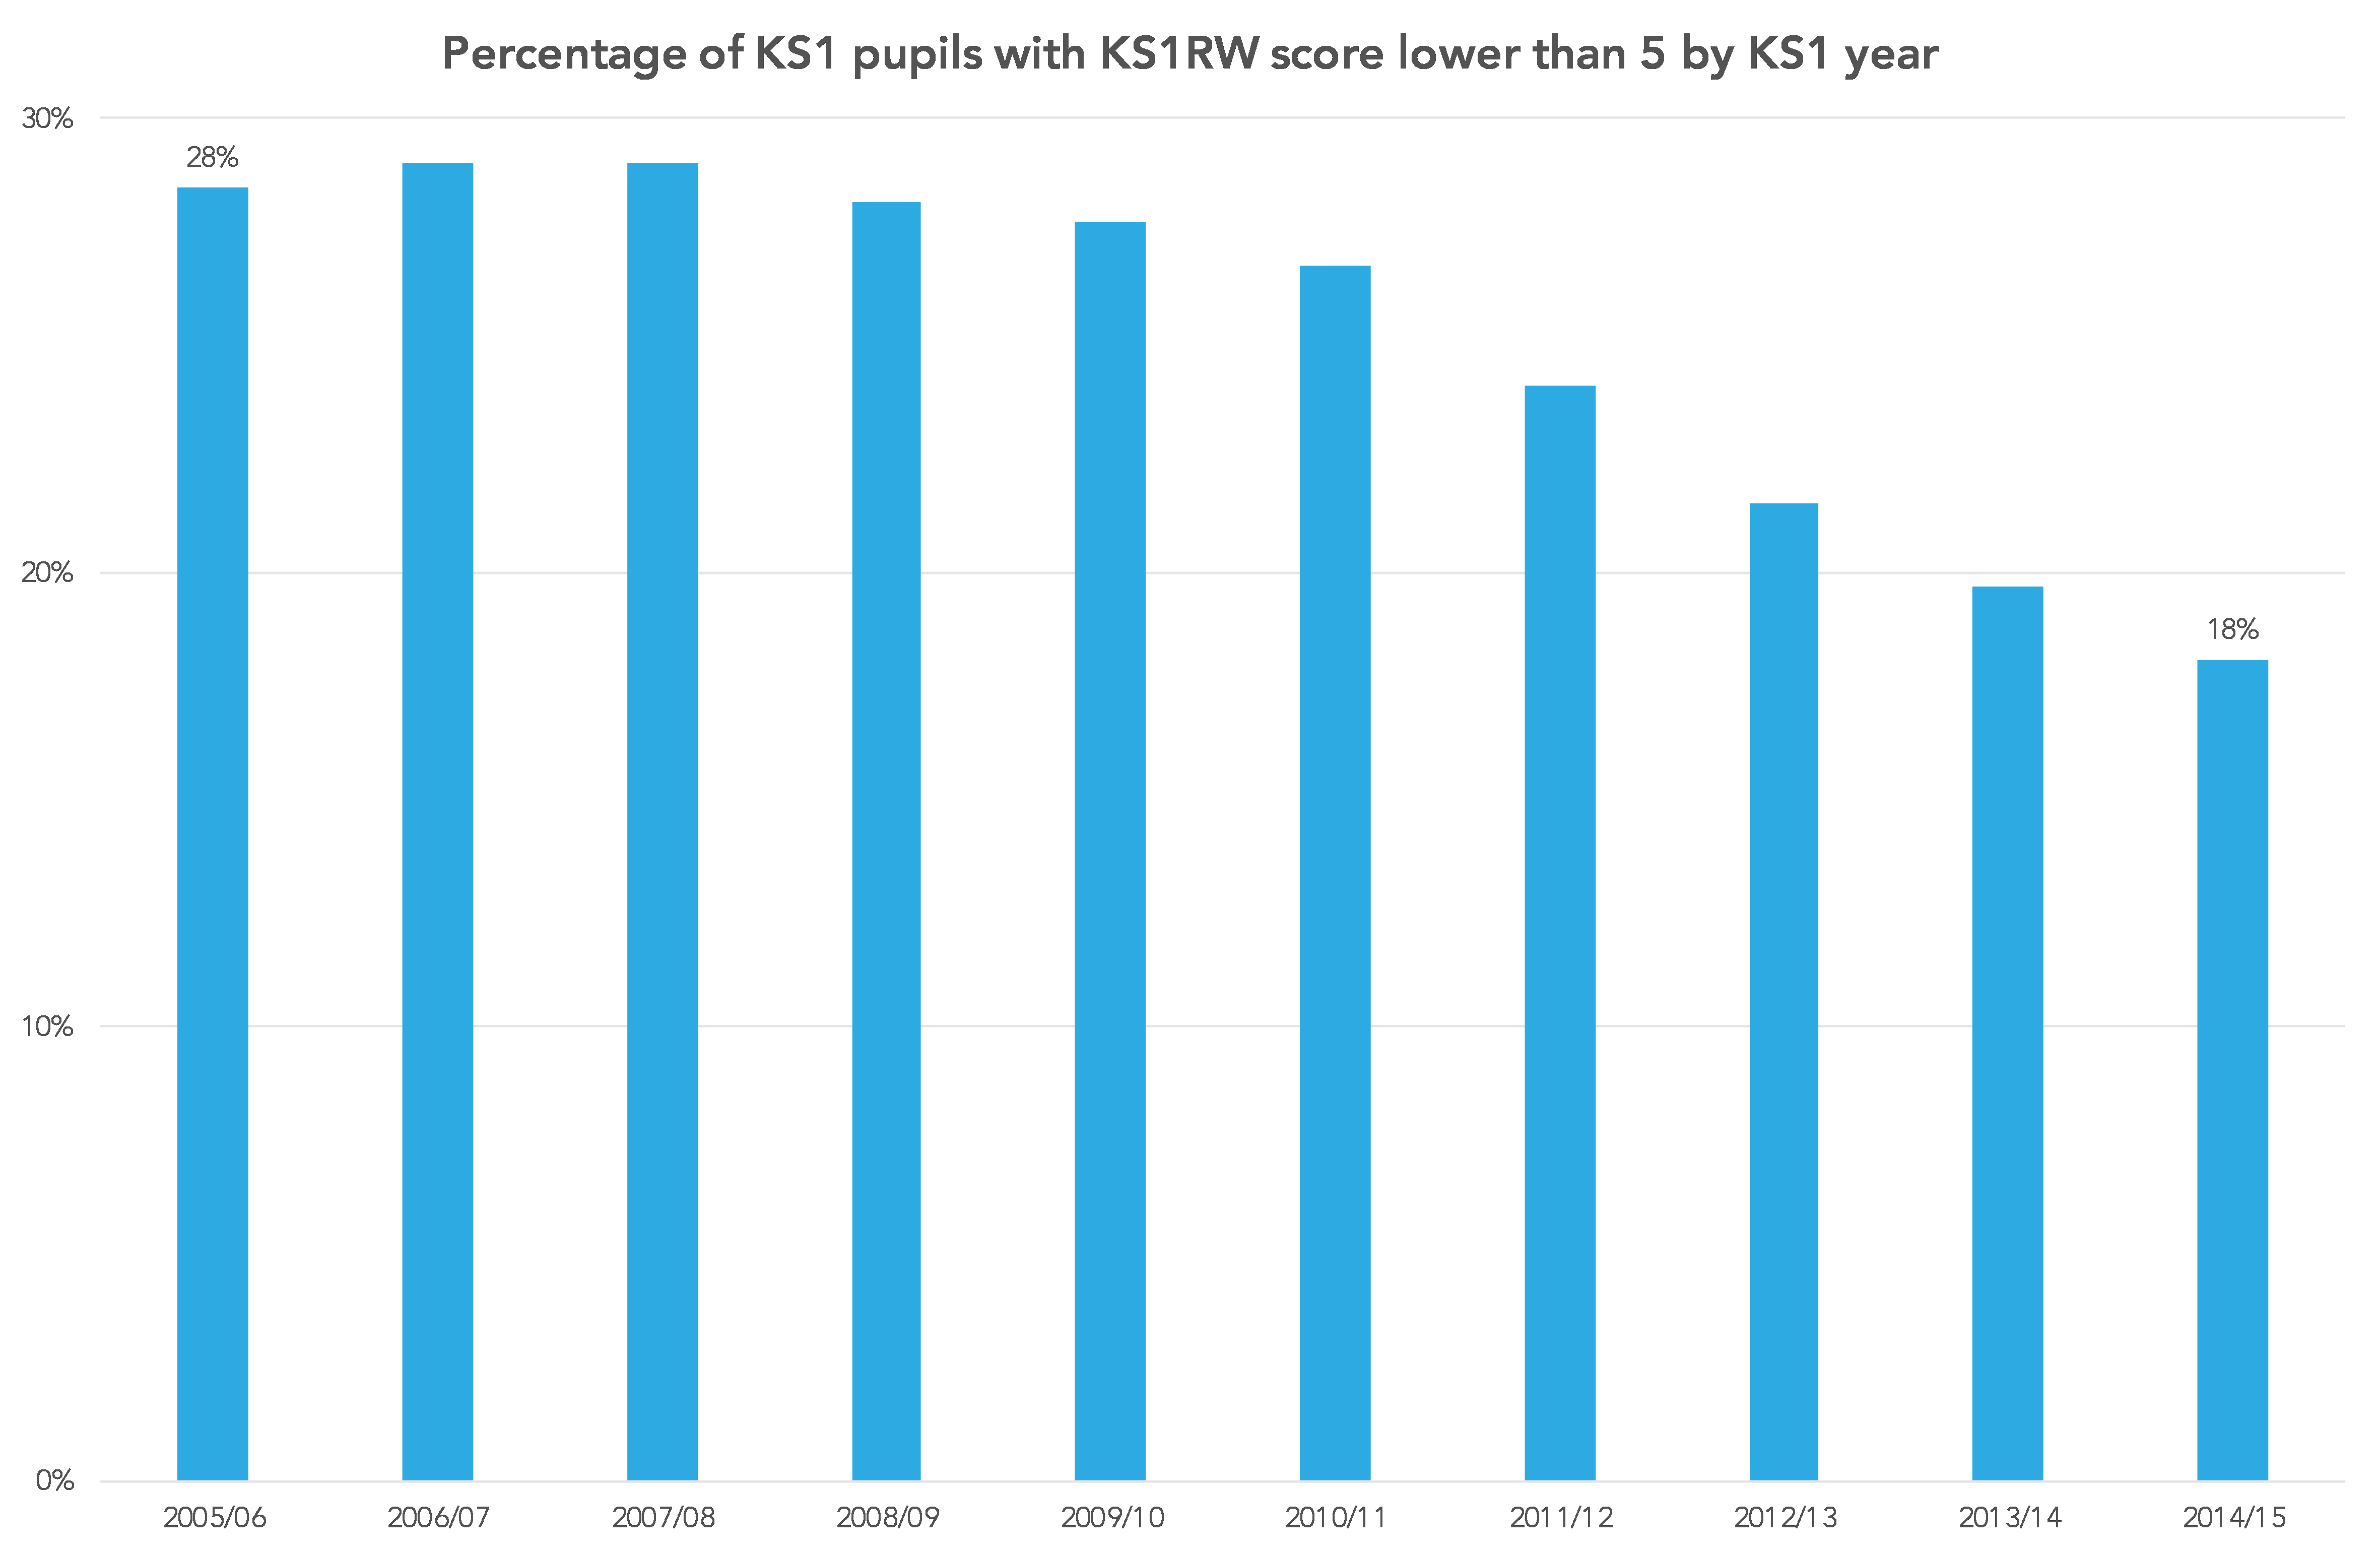
Initial analysis suggests that around half of the improvement in English at KS4 over the last ten years can be attributed to increases in KS1 attainment between 1997 and 2007.
How much change can we expect at KS4 on the basis of this further improvement at KS1? We’ll consider that and other factors such as Foundation Stage attainment in a second blogpost.
Now read the second post in the series.
Want to stay up-to-date with the latest research from Education Datalab? Sign up to our mailing list to get notifications about new blogposts, or to receive our half-termly newsletter.
1. The dataset used for the analysis – a total of 977,353 pupils – links attainment at KS4 in 2015 and 2016 to KS1 data for 2006 and 2007. Pupils in special and independent schools are not included.
2. The full scoring is as follows:
- working towards Level 1 (W): 0
- Level 1: 1
- Level 2c: 2
- Level 2b: 3
- Level 2c: 4
- Level 3: 5


There are some interesting stats in that detailed report, and what looks like some bizarre examples of Simpson’s Paradox.
eg: 52% of pupils with FSM_low are high risk … but 49% of boys with FSM_low and 35% of girls with FSM_low are at high risk, which looks mathematically impossible! (I’m not saying I doubt your maths, but it is a really counter-intuitive result)
Also interesting to see that summer-born children are likely to do better at GCSE than autumn-born children with the same KS1 results – not the narrative that we usually get, but fairly logical when you think about it.
Hi Stephen,
Agree that some of the figures do look counter-intuitive but they are correct – checked them because they did look odd. The important thing about summer-born vs. autumn-born is that we are comparing pupils with the same KS1 attainment. As pupils progress through school the autumn / summer difference decreases – roughly in proportion to how much the difference in age is compared to the length of time in schools – so the difference at age 7 is less than at age 16.
Mike.
« This is not surprising – many EAL pupils will be at a lower stage of language development at age 7 than other pupils »
Their language development overall is likely to be higher than that of monolingual English pupils. However, their vocabulary and syntax in English is likely to be lower than those of monolingual English children as they will have had relatively less exposure (input) to English.