This is the second of two posts in a series of blogposts looking at the relationship between Key Stage 1 attainment and Key Stage 4 outcomes. The first post can be found here.
In part one of this series we looked at progress from Key Stage 1 to Key Stage 4, and showed that attainment at age seven is a significant factor in the chances of ‘success’ (as defined by attainment of grade C or higher) in GCSE English at age 16.
We also found that, for the same KS1 attainment, there were substantial differences associated with pupil characteristics such as gender, first language and free school meals status.
This blogpost looks in more detail at trends over time to consider:
- How much of the improvement in KS4 attainment over the last 10 years can be attributed to improvement at KS1?
- Are improvements at KS1 based on better progress from Foundation Stage (FS) and, if so, is this the case for all pupils?
An update
Before answering these questions let’s extend the analyses in part one a little.
Although part one included a section highlighting that there was variation around the average, this only looked at pupils who were working towards Level 1 at KS1. The PDF file has been revised to include charts showing the GCSE grade distribution for each KS1 score.
Some readers also asked if we could do an equivalent calculation for mathematics. Data in this PDF file is in the same format as for the earlier analysis but shows attainment in GCSE mathematics linked to KS1 attainment – with KS1 data being reading and mathematics scores combined.
Improvement
Back to our central questions.
Over the past 10 years, attainment at grade C or higher in GCSE English has risen from 60% in 2007 to 71% in 2016 (based on KS4 pupils who have been matched to KS1 data).
Can any of this be attributed to improvements in attainment at KS1?
The below chart shows both actual GCSE English attainment at grade C, together with an estimate calculated by using the relationship between KS4 in 2007 and KS1 in 1998.
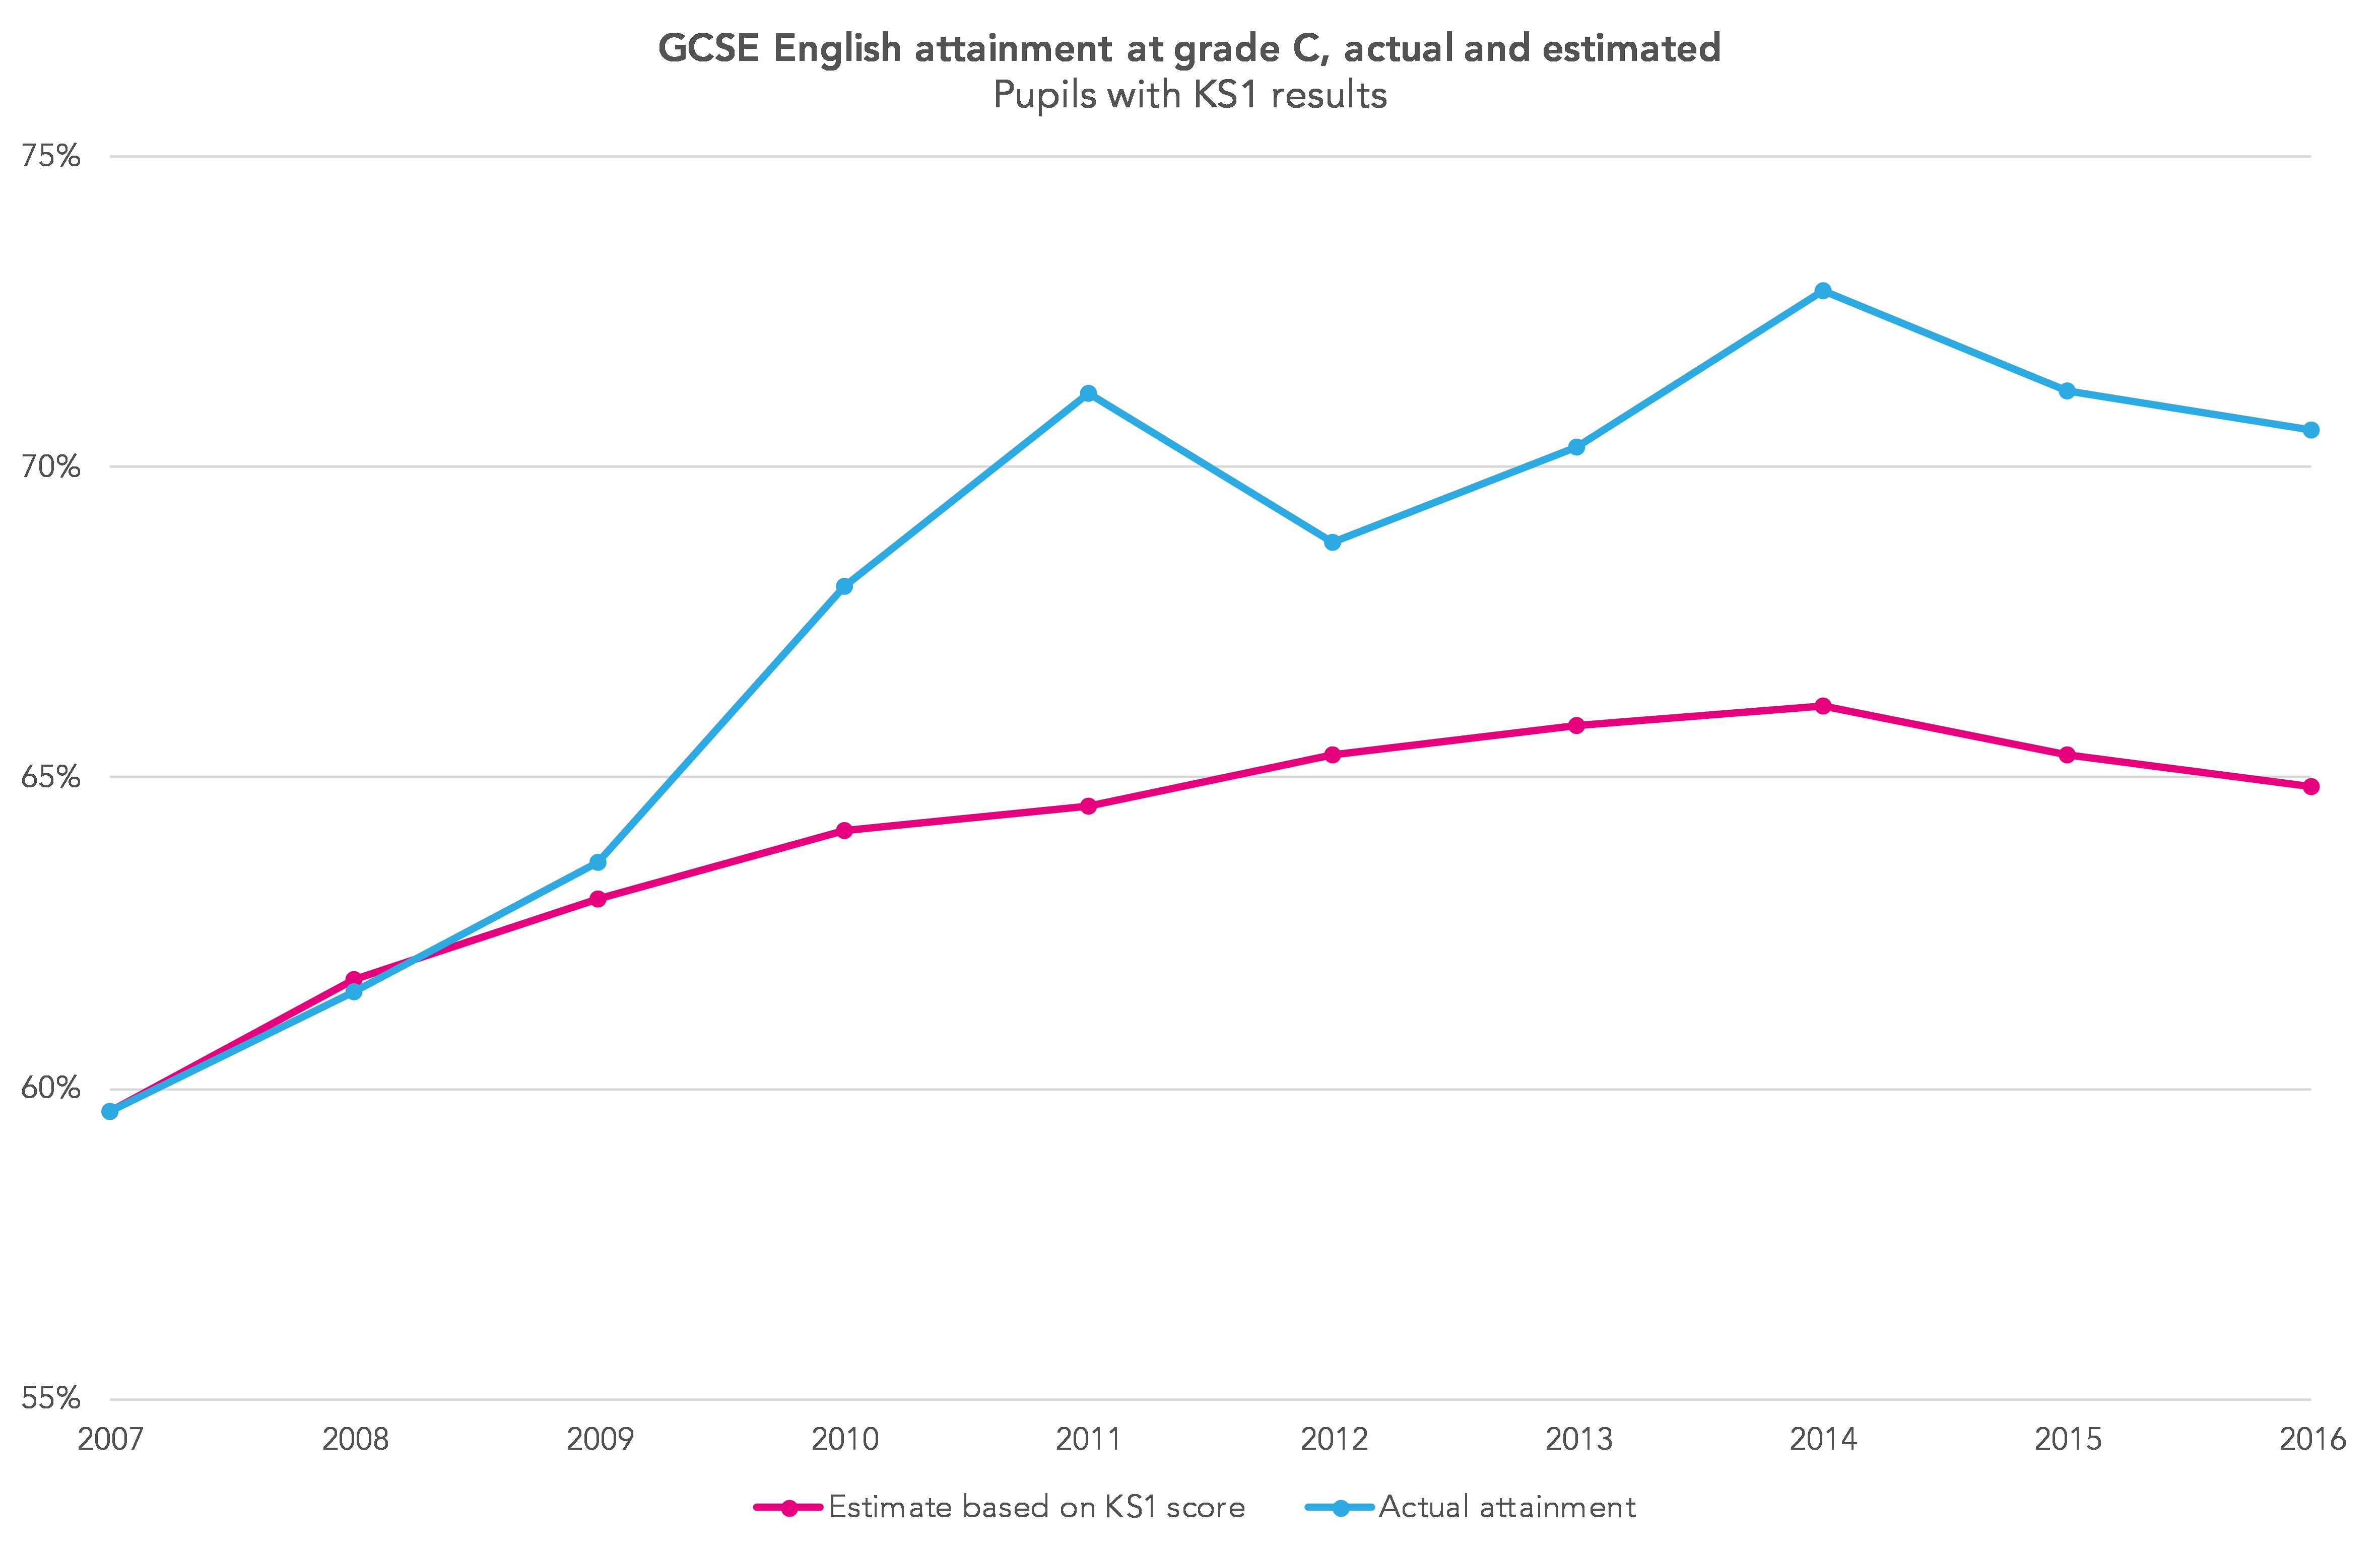
In the first blogpost in this series we defined a combined KS1 reading and writing score that we referred to as KS1RW. This is used to calculate the percentage of pupils attaining grade C or higher in GCSE English in 2007 for each KS1RW score in 1998. This calculation is then applied to subsequent years – providing an estimate of the changes at KS4 that we might expect based on changes in KS1 attainment from 1999 onwards.
The period from 2010 to 2014 showed KS4 increasing by much more than we might expect from KS1. Part of this arises from the increase in multiple entry for GCSE English during this period.
It is best, therefore, to compare KS4 outcomes in 2007, 2008 and 2009 (when multiple entry was small) with those in 2015 and 2016 (when only first entries counted).
Using this as a basis for comparison, changes in attainment at KS1 account for around 45% of the improvement in KS4 attainment. A more detailed approach which takes into account pupil characteristics as well as KS1 attainment suggests a slightly lower figure of around 40%.
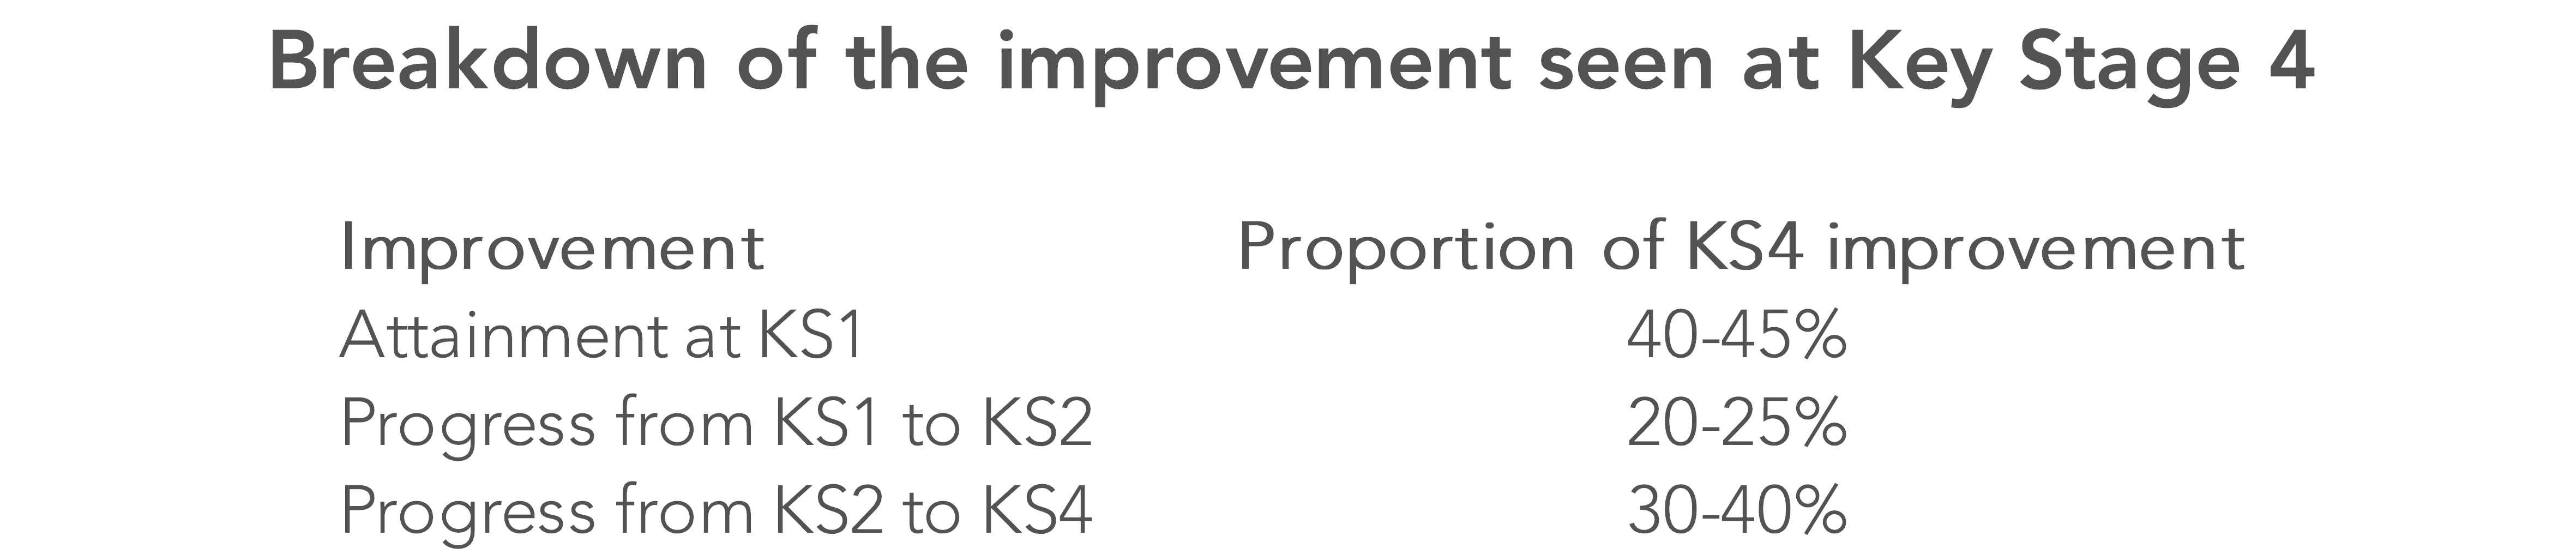
Similar calculations for KS2 to KS4 would suggest that, overall, changes in attainment at KS4 can be apportioned as shown in the below table – with a caveat that the moderation of KS4 outcomes by examination boards uses, in part, estimates based on KS2 attainment.
What might happen if we look further into the future?
The chart below shows the estimated KS4 attainment at grade C or higher (equivalent to grade 4 or higher from 2017 onwards).
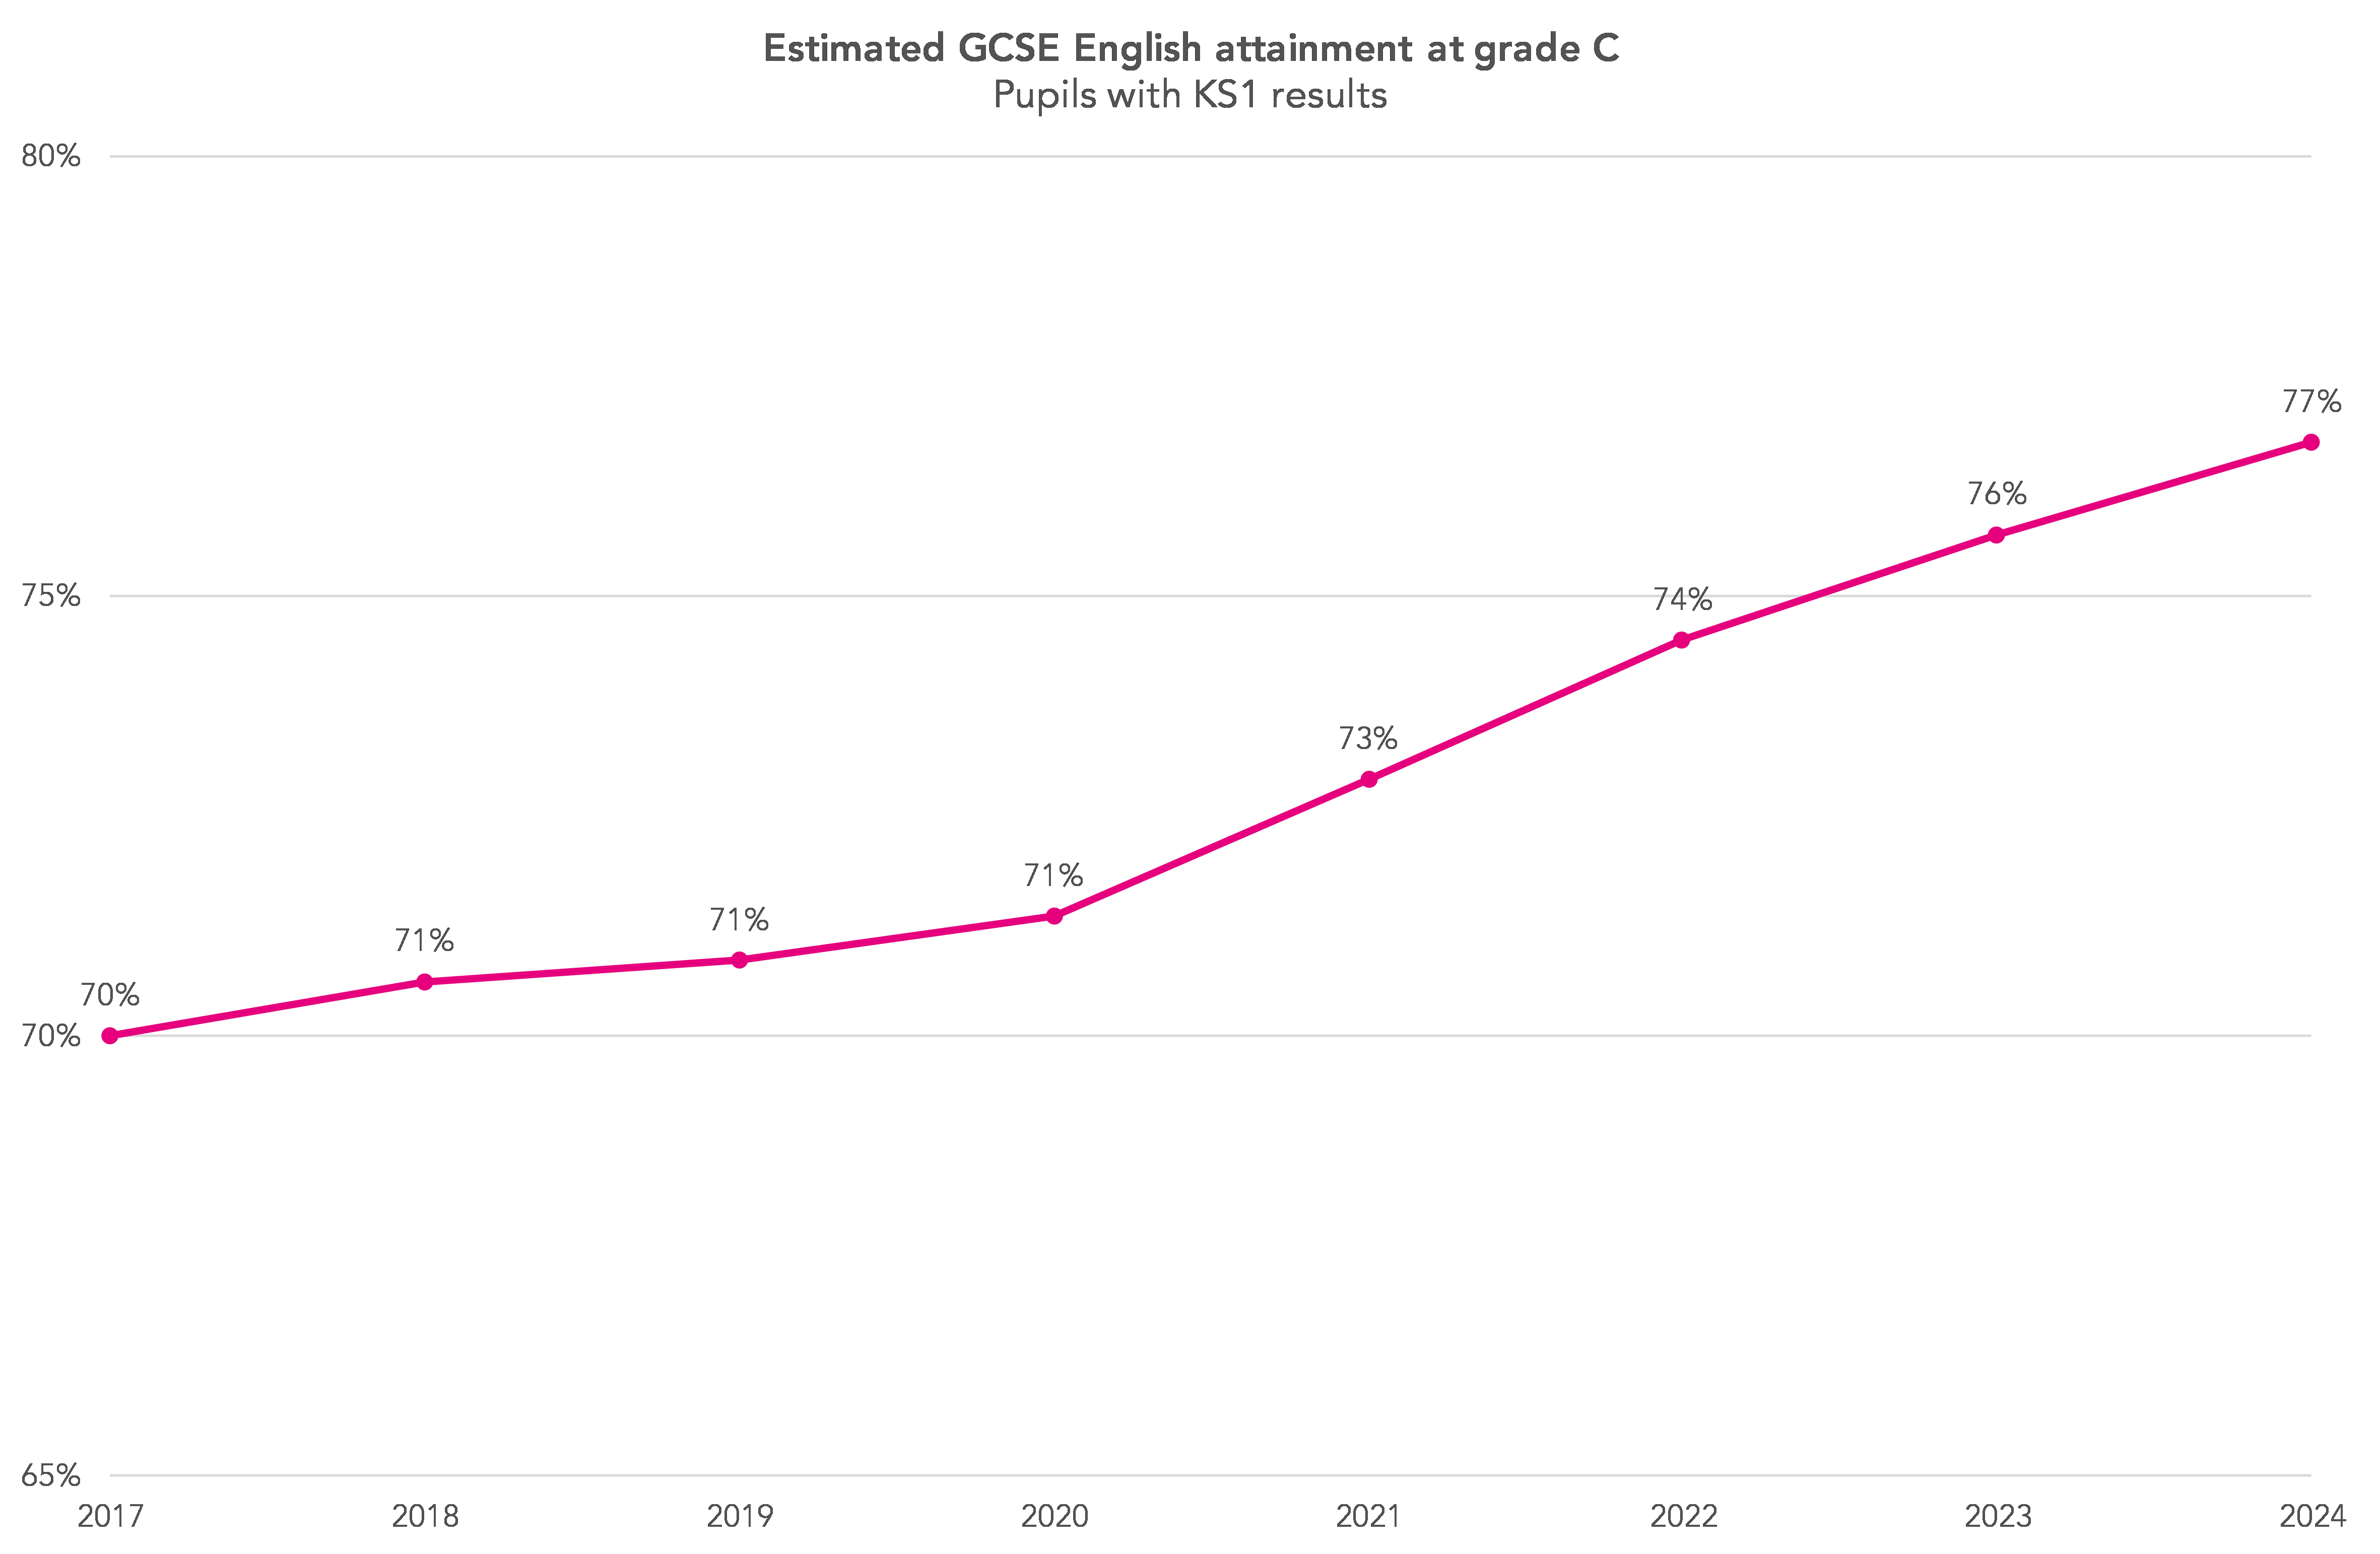
These estimates are calculated by setting again the relationship between KS1 and KS4 results using 2006 and 2007 (KS1)/2015 and 2016 data (KS4), and also reflect increases in KS1 attainment from 2008 to 2016. They do not assume any increase in progress from KS1 to KS2 or from KS2 to KS4. If we assume that increases in progress continue post-KS1 then we arrive at an estimate of around 85% for English grade 4 or higher in 2024.
How likely are we to see such an increase and, if it were to happen, would we once again see headlines saying that GCSEs were getting easier? Comparable outcomes – the approach used by Ofqual to maintain comparability of standards over time – is based on an assumption that “if the ability of students stays the same, and nothing else that could affect their performance changes, results should be stable over time“.
Ofsted annual reports show a trend for improvement, with an increase in the percentage of schools rated as good or outstanding. If this were to continue then might we expect outcomes to be higher than that predicted from a comparable outcomes approach?
Other factors
There are, though, some other factors to consider. Let’s look first at progress from FS to KS1. The chart below shows estimated and actual KS1 reading and writing scores from 2009 to 2014. (Estimated scores are calculated by using the 2009 data as a baseline i.e. the estimated scores for 2010 onwards are calculated using each pupil’s FS score and the average KS1 attainment in 2009 for that FS score.)

Overall, increases in FS attainment account for around 45% of the increase at KS1 – which means that just over half of the improvement at KS1 relates to better progress between the ages of five and seven. However, if we look in more detail, there are some important variations. The chart below shows value added scores from FS to KS1 for pupils grouped into four bands.

This shows that improvements in FS-to-KS1 progress have been for pupils with the top 75% of FS scores. For pupils with the lowest 25% of FS scores there has been a slight decline, suggesting that the strategies leading to overall improvement are not having an impact on the lowest attainers.
This pattern of lowest attainers improving much less rapidly than others was something we also noticed when we looked at long-term disadvantage. The attainment of pupils eligible for free school meals for over 90% of their time at school improved slightly but at a slower rate than that of other disadvantaged pupils.
We also know that the lowest attainers at KS1 – those with a KS1 reading and writing score below five, are around three times more likely to be in the long-term disadvantage group by the time they reach the end of KS4.
In conclusion
In conclusion, our calculations suggest that improvements at KS1 might, if reflected in KS4 attainment nine years later, lead to a substantial increase in KS4 attainment – perhaps as high as 85% by 2024. If we find ways of extending improvements at KS1 to the lowest 25% of attainers and also enable them to build on this in subsequent Key Stages then we would see further increases after that.
This raises some challenges relating to the moderation of KS4 examinations:
- For how long will the ‘comparable outcomes’ approach be applied at KS4?
- What is the impact of using KS2 outcomes to ‘moderate’ KS4 attainment?
- Will the new national reference test reflect improvements at KS1 and improvements in subsequent progress?
Want to stay up-to-date with the latest research from FFT Education Datalab? Sign up to our mailing list to get notifications about new blogposts, or to receive our half-termly newsletter.


Leave A Comment