Up and down the country, the final few GCSE exams are being taken for another year.
Around half a million pupils will be sitting their exams in England’s secondary schools.
But another group of pupils exists – those who had been on the rolls of mainstream schools, but are there no longer.
This is a group who receive much less attention than their contemporaries who stay in mainstream schools – but who as a group are more vulnerable, and less likely to have positive outcomes.
In this series of posts we’d like to talk about who’s left – both who’s left on mainstream secondary school rolls, but also who’s left the system.
The big picture
There were around 553,000 pupils who reached the end of their secondary education in 2017, having spent at least some of that time at a mainstream school.
The vast majority of this cohort – around 516,000 – finished their secondary schooling in a mainstream school. Others will have finished Year 11 elsewhere in the state system: in special schools and alternative provision, or in university technical colleges and studio schools.
The chart below shows, for this cohort, the numbers of pupils who left mainstream secondary schools at some point before the end of their secondary education.
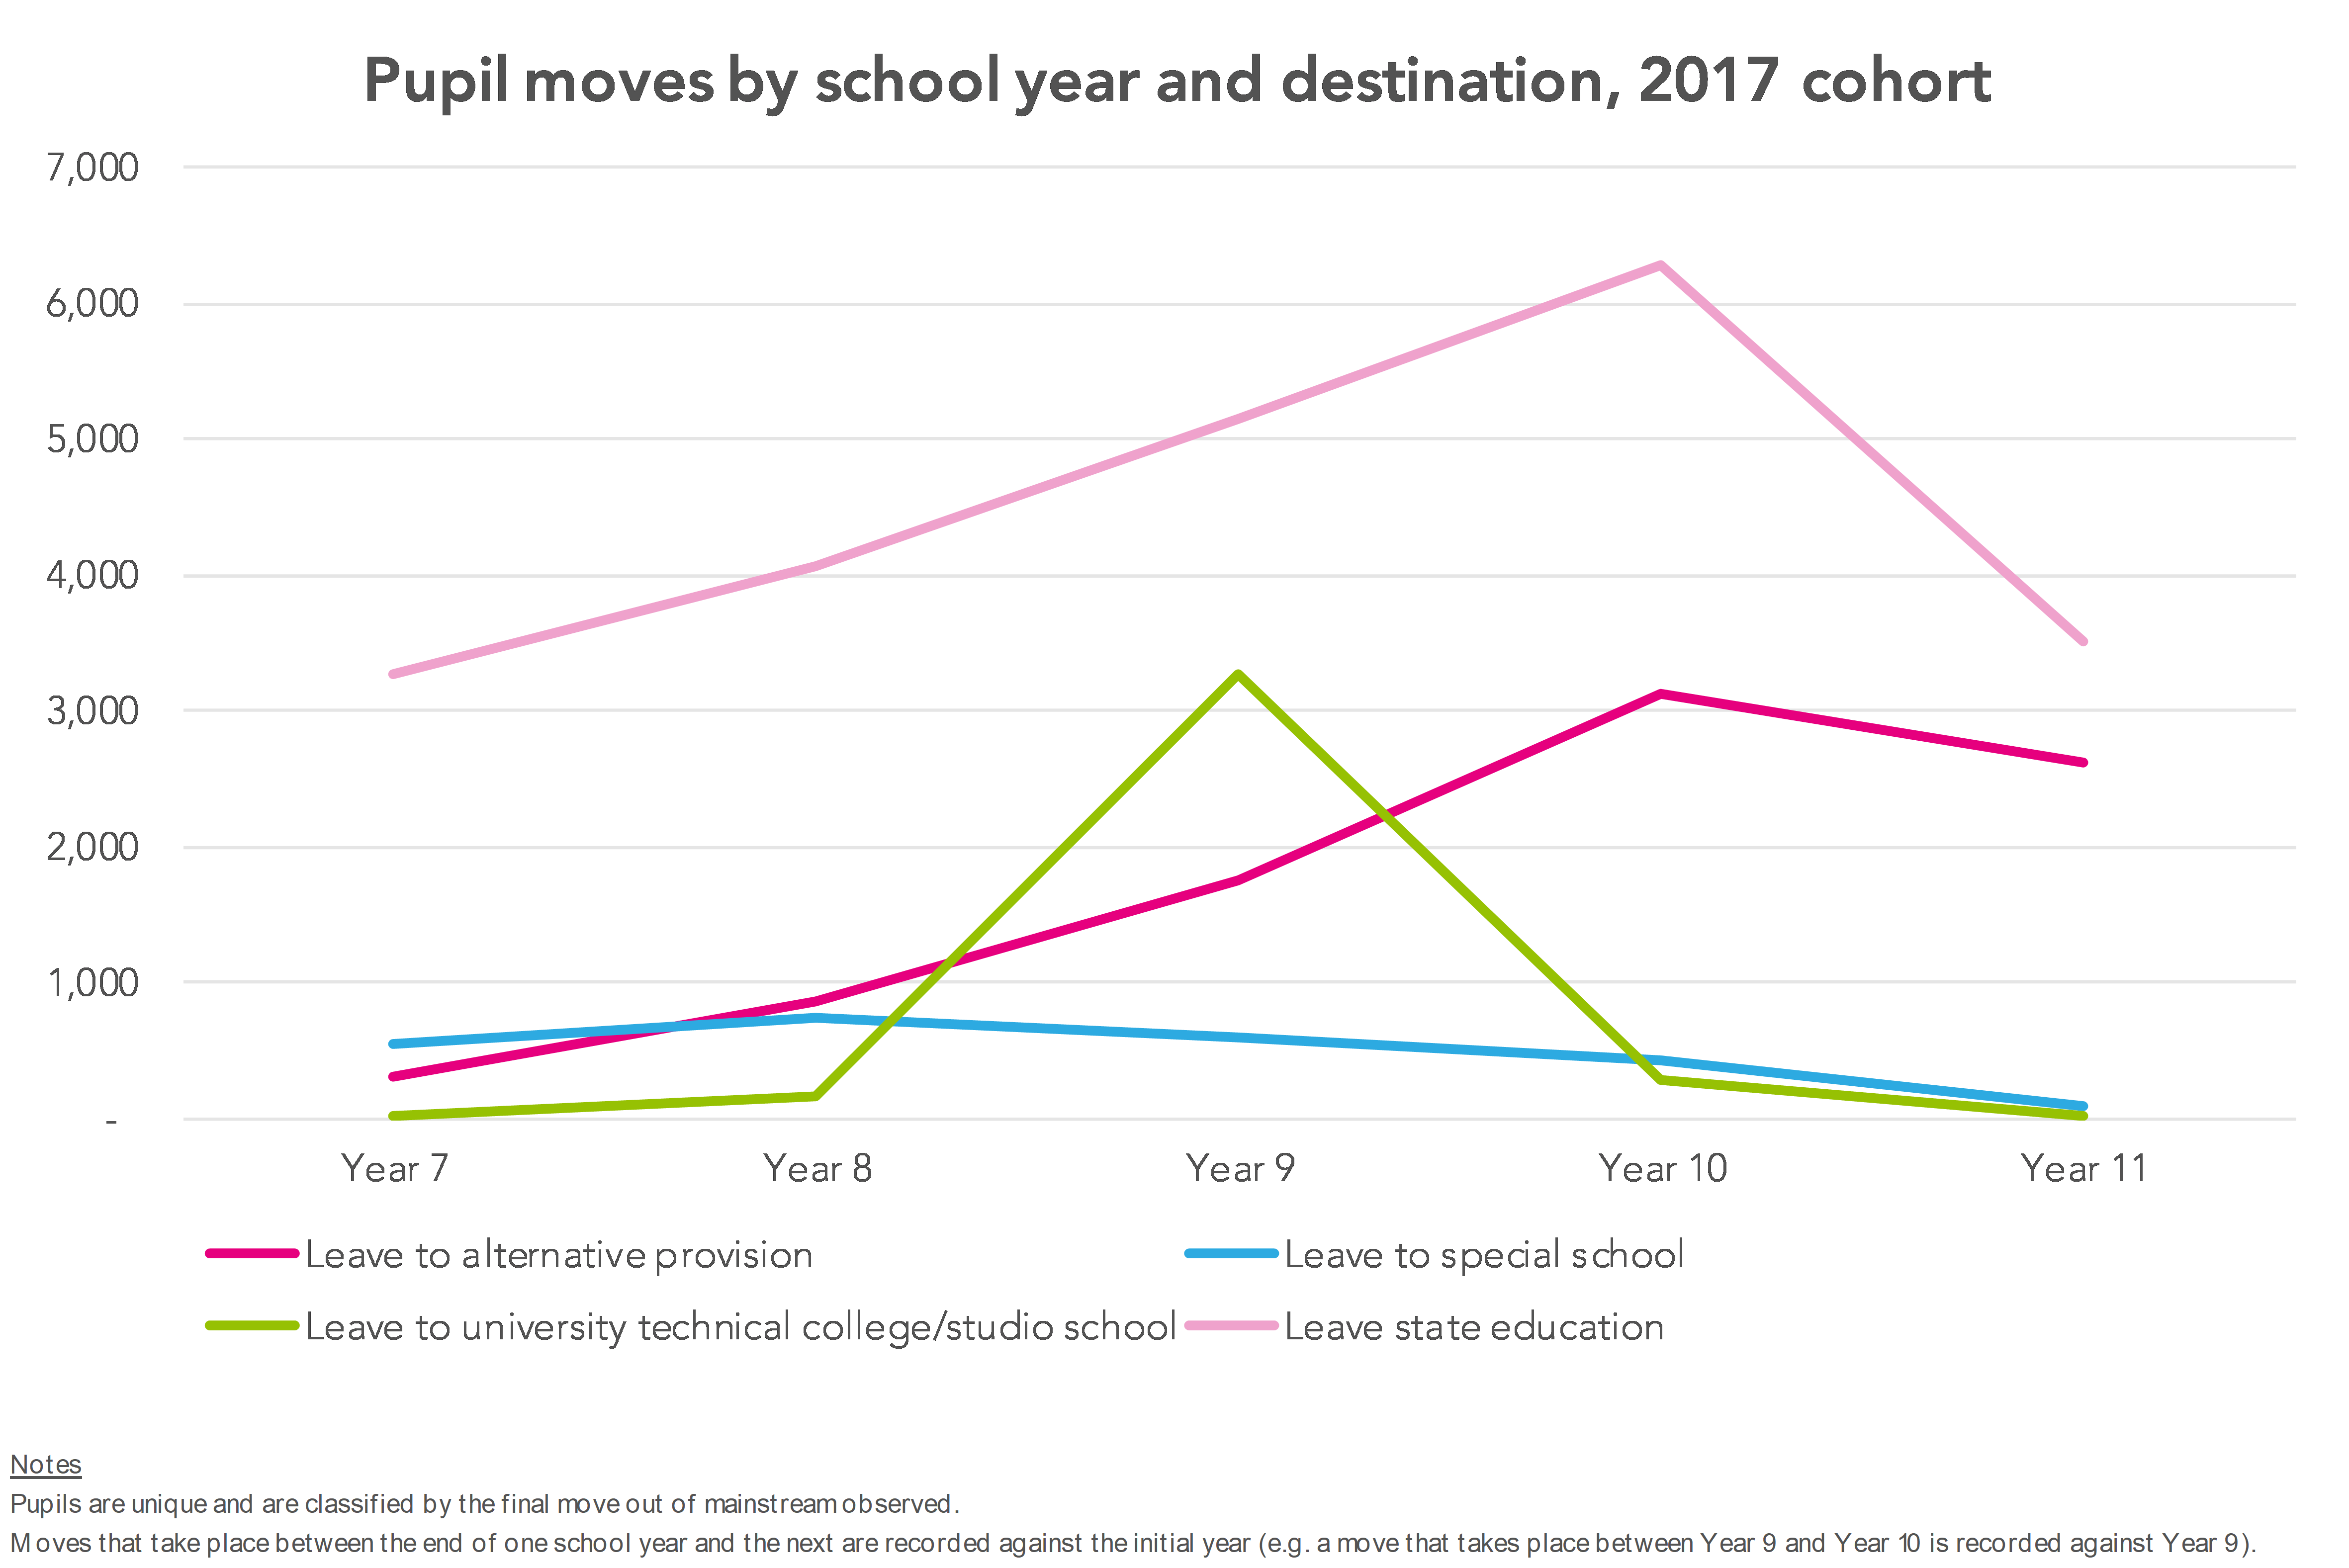
Around 8,700 pupils moved into state alternative provision. It’s worth noting here that this is some way greater than the roughly 3,900-5,400 permanent exclusions from secondary schools that have been recorded in recent years – though, of course, permanent exclusion is not the sole reason for which a pupil can enter alternative provision.
The chart also shows that another, much larger, group exists. This is the group who leave mainstream state schools at some point between Year 7 and Year 11 and are not recorded in state education again.
For the 2017 cohort, this group numbered more than 22,000 pupils in total. And this number was a sharp increase on that seen in previous cohorts. As the chart below shows, for those completing secondary school in each of 2014, 2015 and 2016, around 20,000 pupils left state education – meaning an increase of more than 10%.
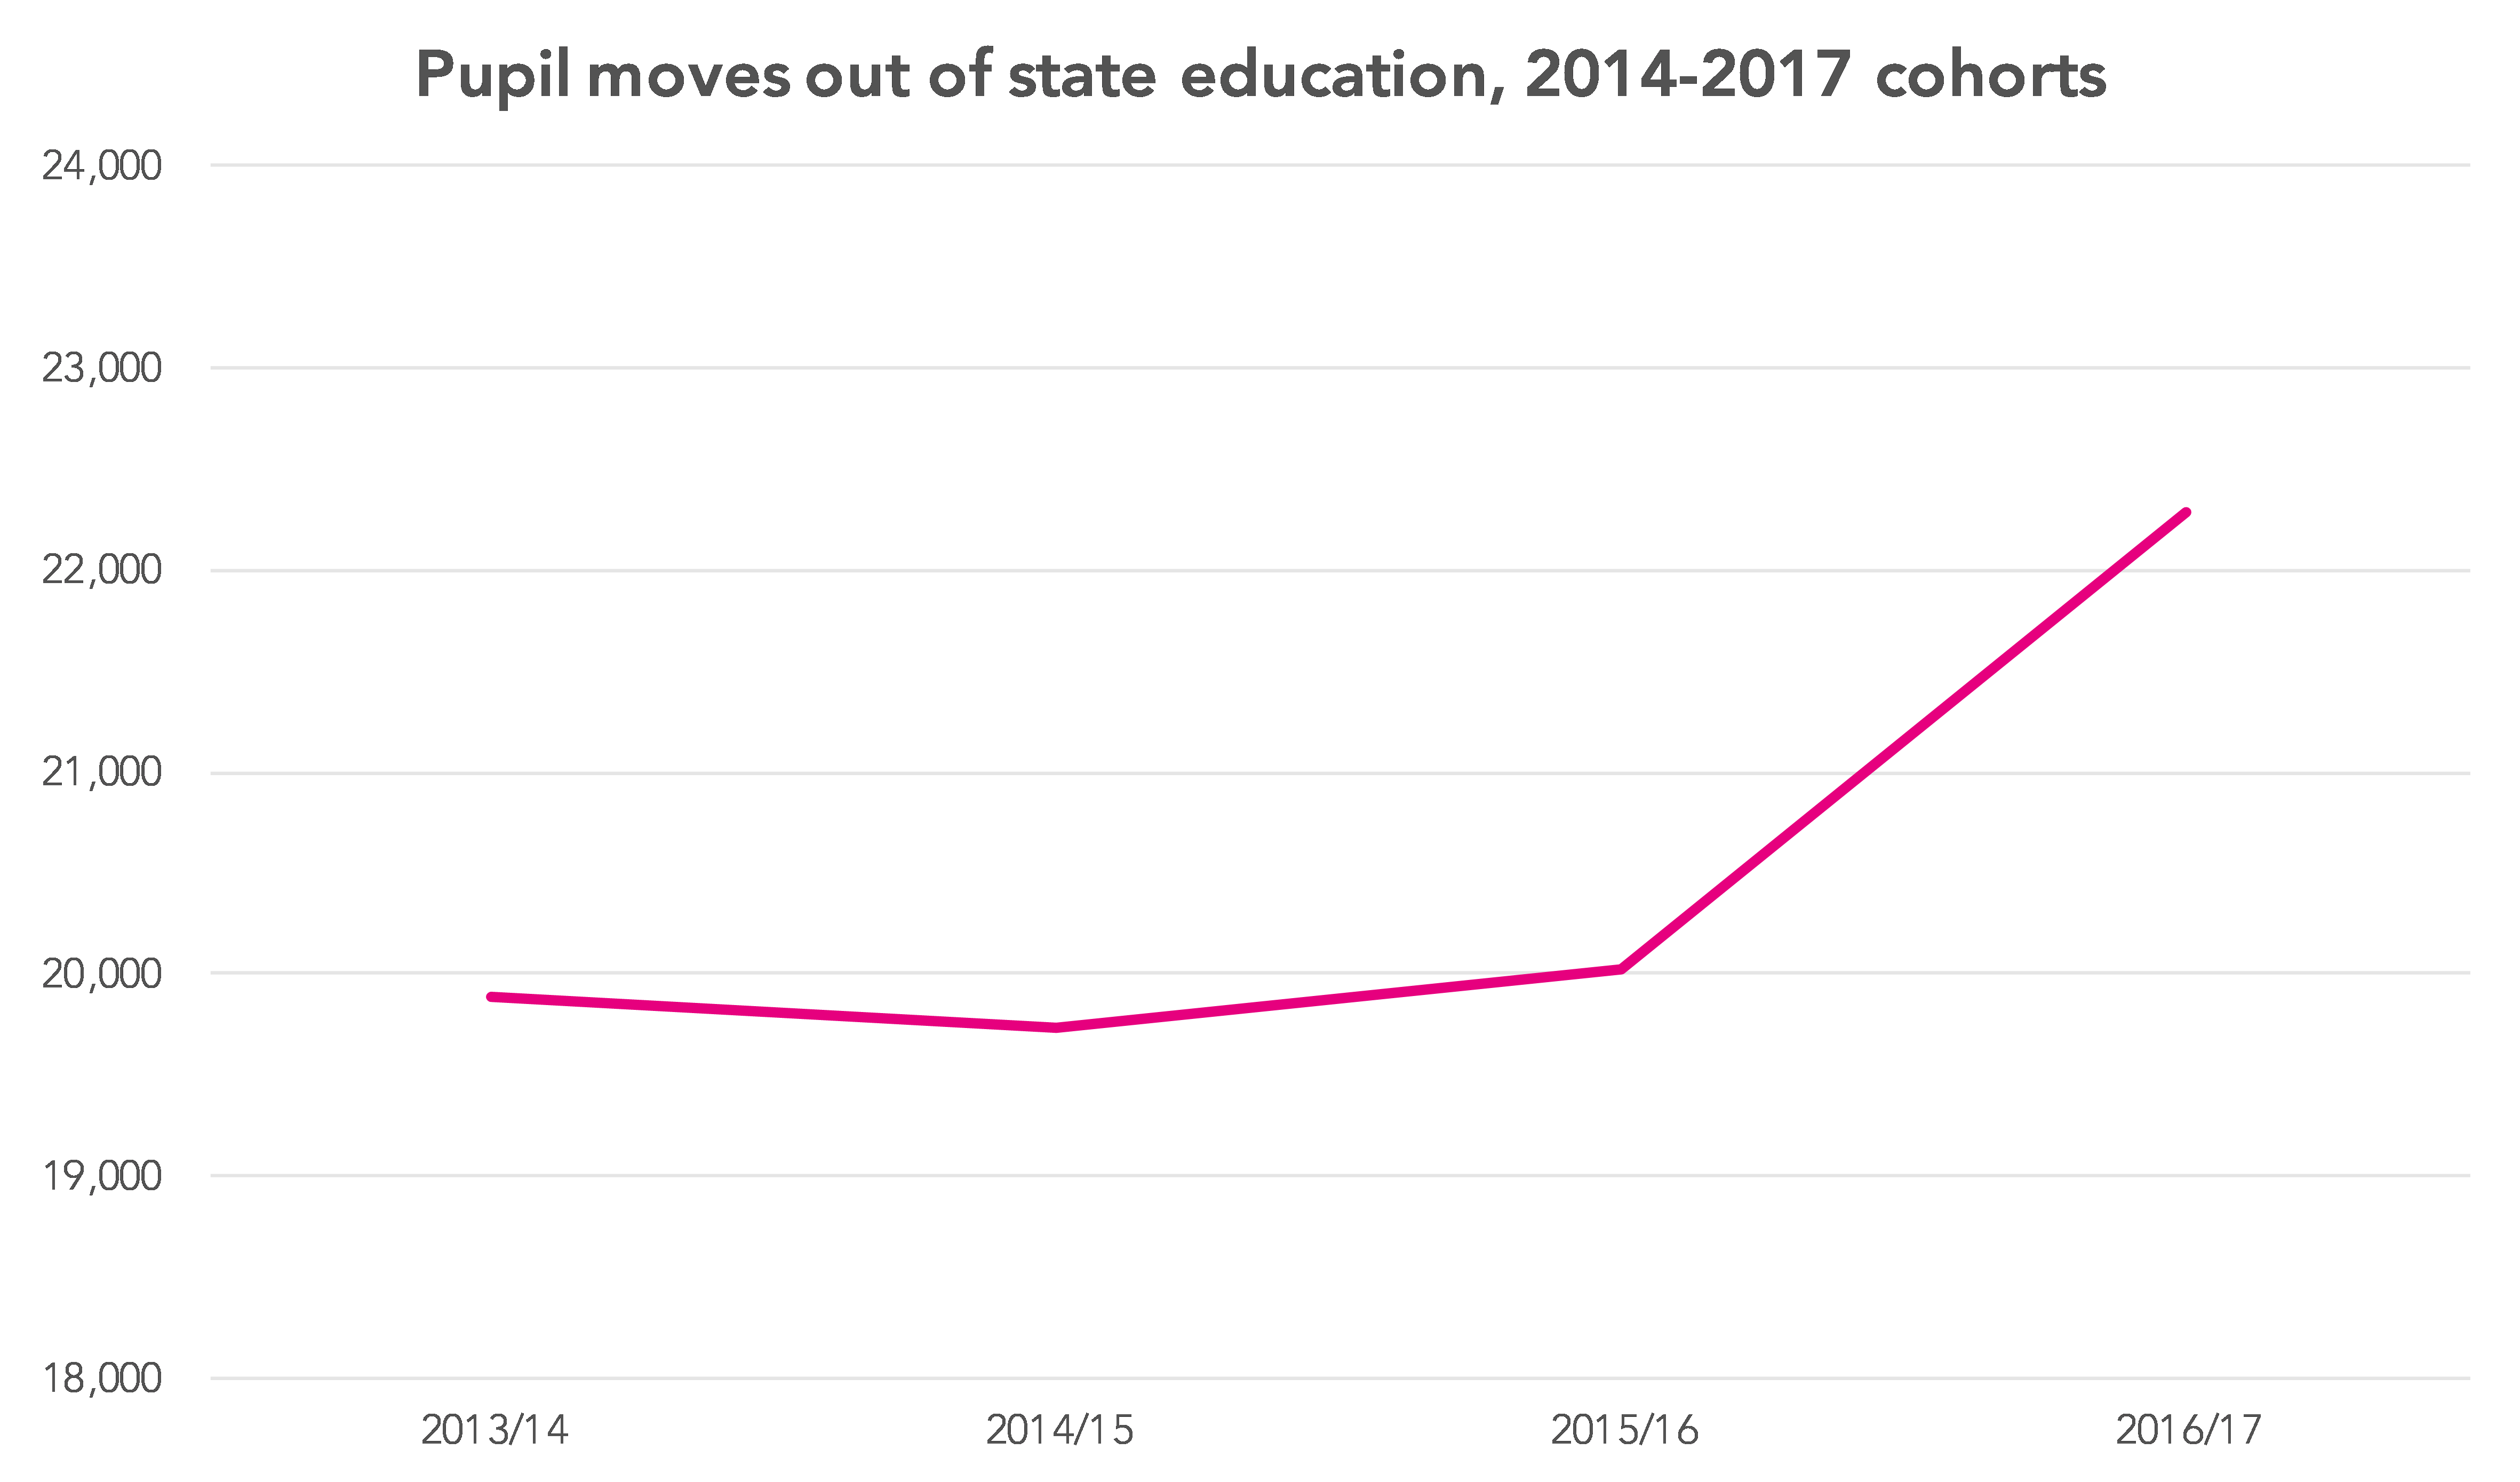
It’s also worth noting that this increase has come at a time when the secondary school population has been in a periodic phase of contraction, from around 579,000 for those completing Year 11 in 2014 to 553,000 for those completing Year 11 in 2017.
There are more than one possible explanation for why the number of pupils leaving the state system entirely has increased – something we’ll return to shortly in this post.
On the move
In our Who’s Left work last year we raised concerns about this group of pupils who leave state education at some point between Year 7 and Year 11.
Looked at as a whole, this is a vulnerable group of pupils. Compared to those who complete secondary education in a mainstream school, pupils in this group are more likely to have been eligible for free schools meals, have special educational needs, and have had lower attainment at primary school, as shown in the table below.

It is worth saying that, even when compared to groups of pupils who move to other, known destinations, this group who leave state education are likely to be particularly heterogeneous, and not all pupils in this group warrant our concern – some will have moved to independent schools, and others will be receiving a broad, effective education through home-schooling.
The table below shows, for this 2017 cohort, where this group of children who leave state education show up in school league tables, together with two measures of attainment – achieving a grade 4 or higher in English and maths qualifications, and the score achieved in the government’s Attainment 8 measure.
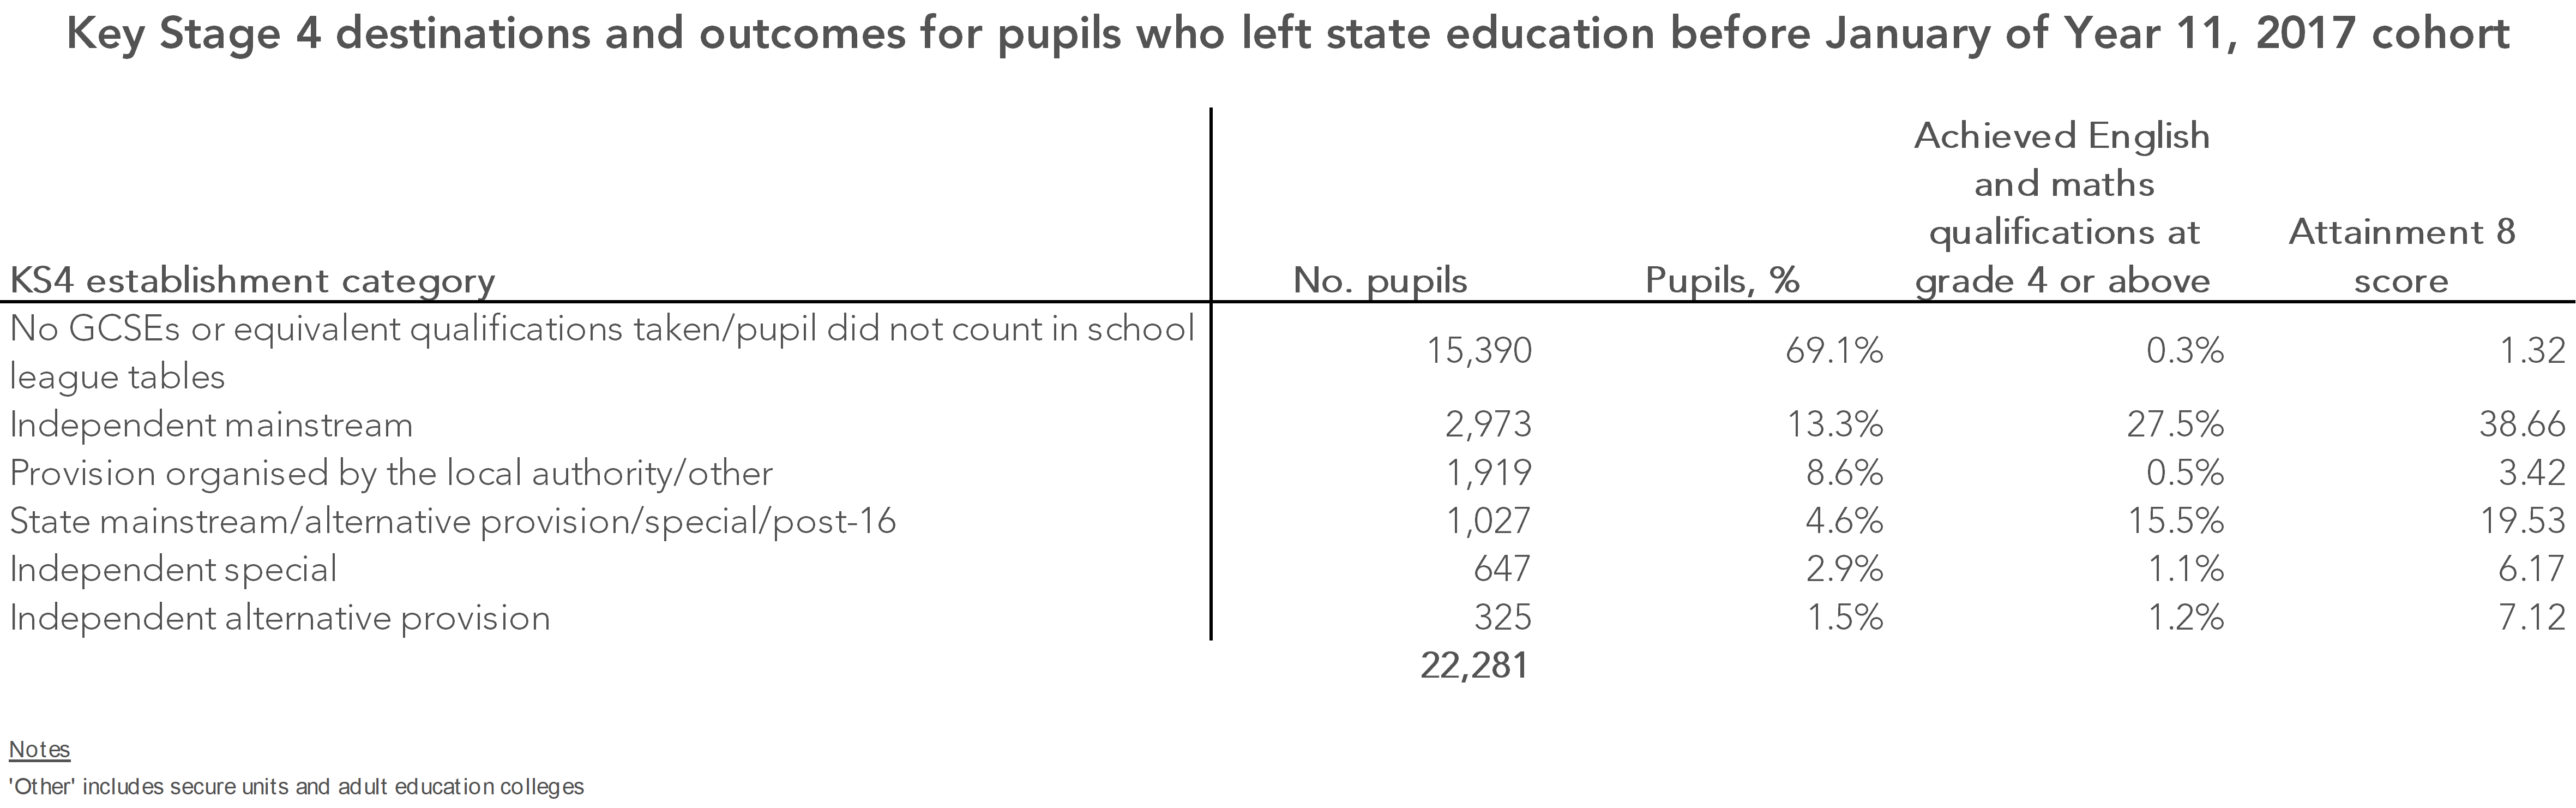
The largest group – consisting of around 15,400 pupils – were either not recorded as having taken any GCSEs or equivalent qualifications, or, if they did, whose results did not count towards any establishment.
We estimate that between 50% and 60% of this group – between around 7,700 and 9,200 pupils – will have left the English school system by having moved to one of the other home nations, having emigrated, or, in a small number of sad cases, died.[1]
We think the other 6,200-7,700 pupils remain in the country.
The second largest group, of slightly fewer than 3,000 pupils, are recorded as sitting exams in mainstream independent schools. The results of others are recorded against provision organised by the local authority; state establishments (mostly further education that admits at age 14); independent special schools and independent alternative provision.
We are particularly concerned about this group of 6,200-7,700 pupils who we think remain in the country, but do not have results for GCSE or equivalent qualifications, or do not have results that counted towards any establishment.
As the above table shows, the group of 15,400 pupils who do not have results for GCSE or equivalent qualifications, only 0.3% – one in 300 – is recorded as having achieved a grade 4 or higher in an English and maths qualification. Even if we take the figure at the top end of our range for the share of these pupils who we think are no longer in the country, that implies that at most 0.7% – around one in every 150 – of these 6,200-7,700 pupils achieved a grade 4 or higher in an English and maths qualification.
As mentioned above, it’s worth briefly considering the sharp increase in the number of pupils observed leaving state education altogether when the 2017 cohort is compared to the three previous cohorts, from around 20,000 pupils to more than 22,000.
On the face of it this is a concerning increase. We don’t, however, think that it’s possible to say whether this increase stems from greater emigration, or from more children leaving the state education system but remaining in the country.
Off-rolling
We remain concerned that in some cases, pupils seen leaving school rolls will have been off-rolled – encouraged off the roll of a mainstream school in an informal exclusion in which the school’s best interests have trumped the pupil’s.
School league tables, broadly speaking, only measure those who remain on the school roll in January of Year 11, giving schools a perverse incentive to lose pupils who would bring results down. (Full details of how pupils count in school league tables are given in this post.)
Pupils who have been off-rolled are likely to be among the 22,000 pupils observed leaving the state system, but also in other types of pupil moves, that see pupils ending up in a different mainstream secondary school, a university technical college or studio school, for example.
In the case of any particular pupil, we don’t think it’s possible to say that something is an example of off-rolling from data alone. Therefore we do not think it’s possible to put a figure on the amount of off-rolling that has taken place.
To be clear, though, we think that only a small minority of heads will have been inclined to behave in this way.
The outcomes for the group identified above, who were either not recorded as having taken any GCSEs or equivalent qualifications, or, if they did, whose results did not count towards any establishment, reinforce the concerns that we have about off-rolling.
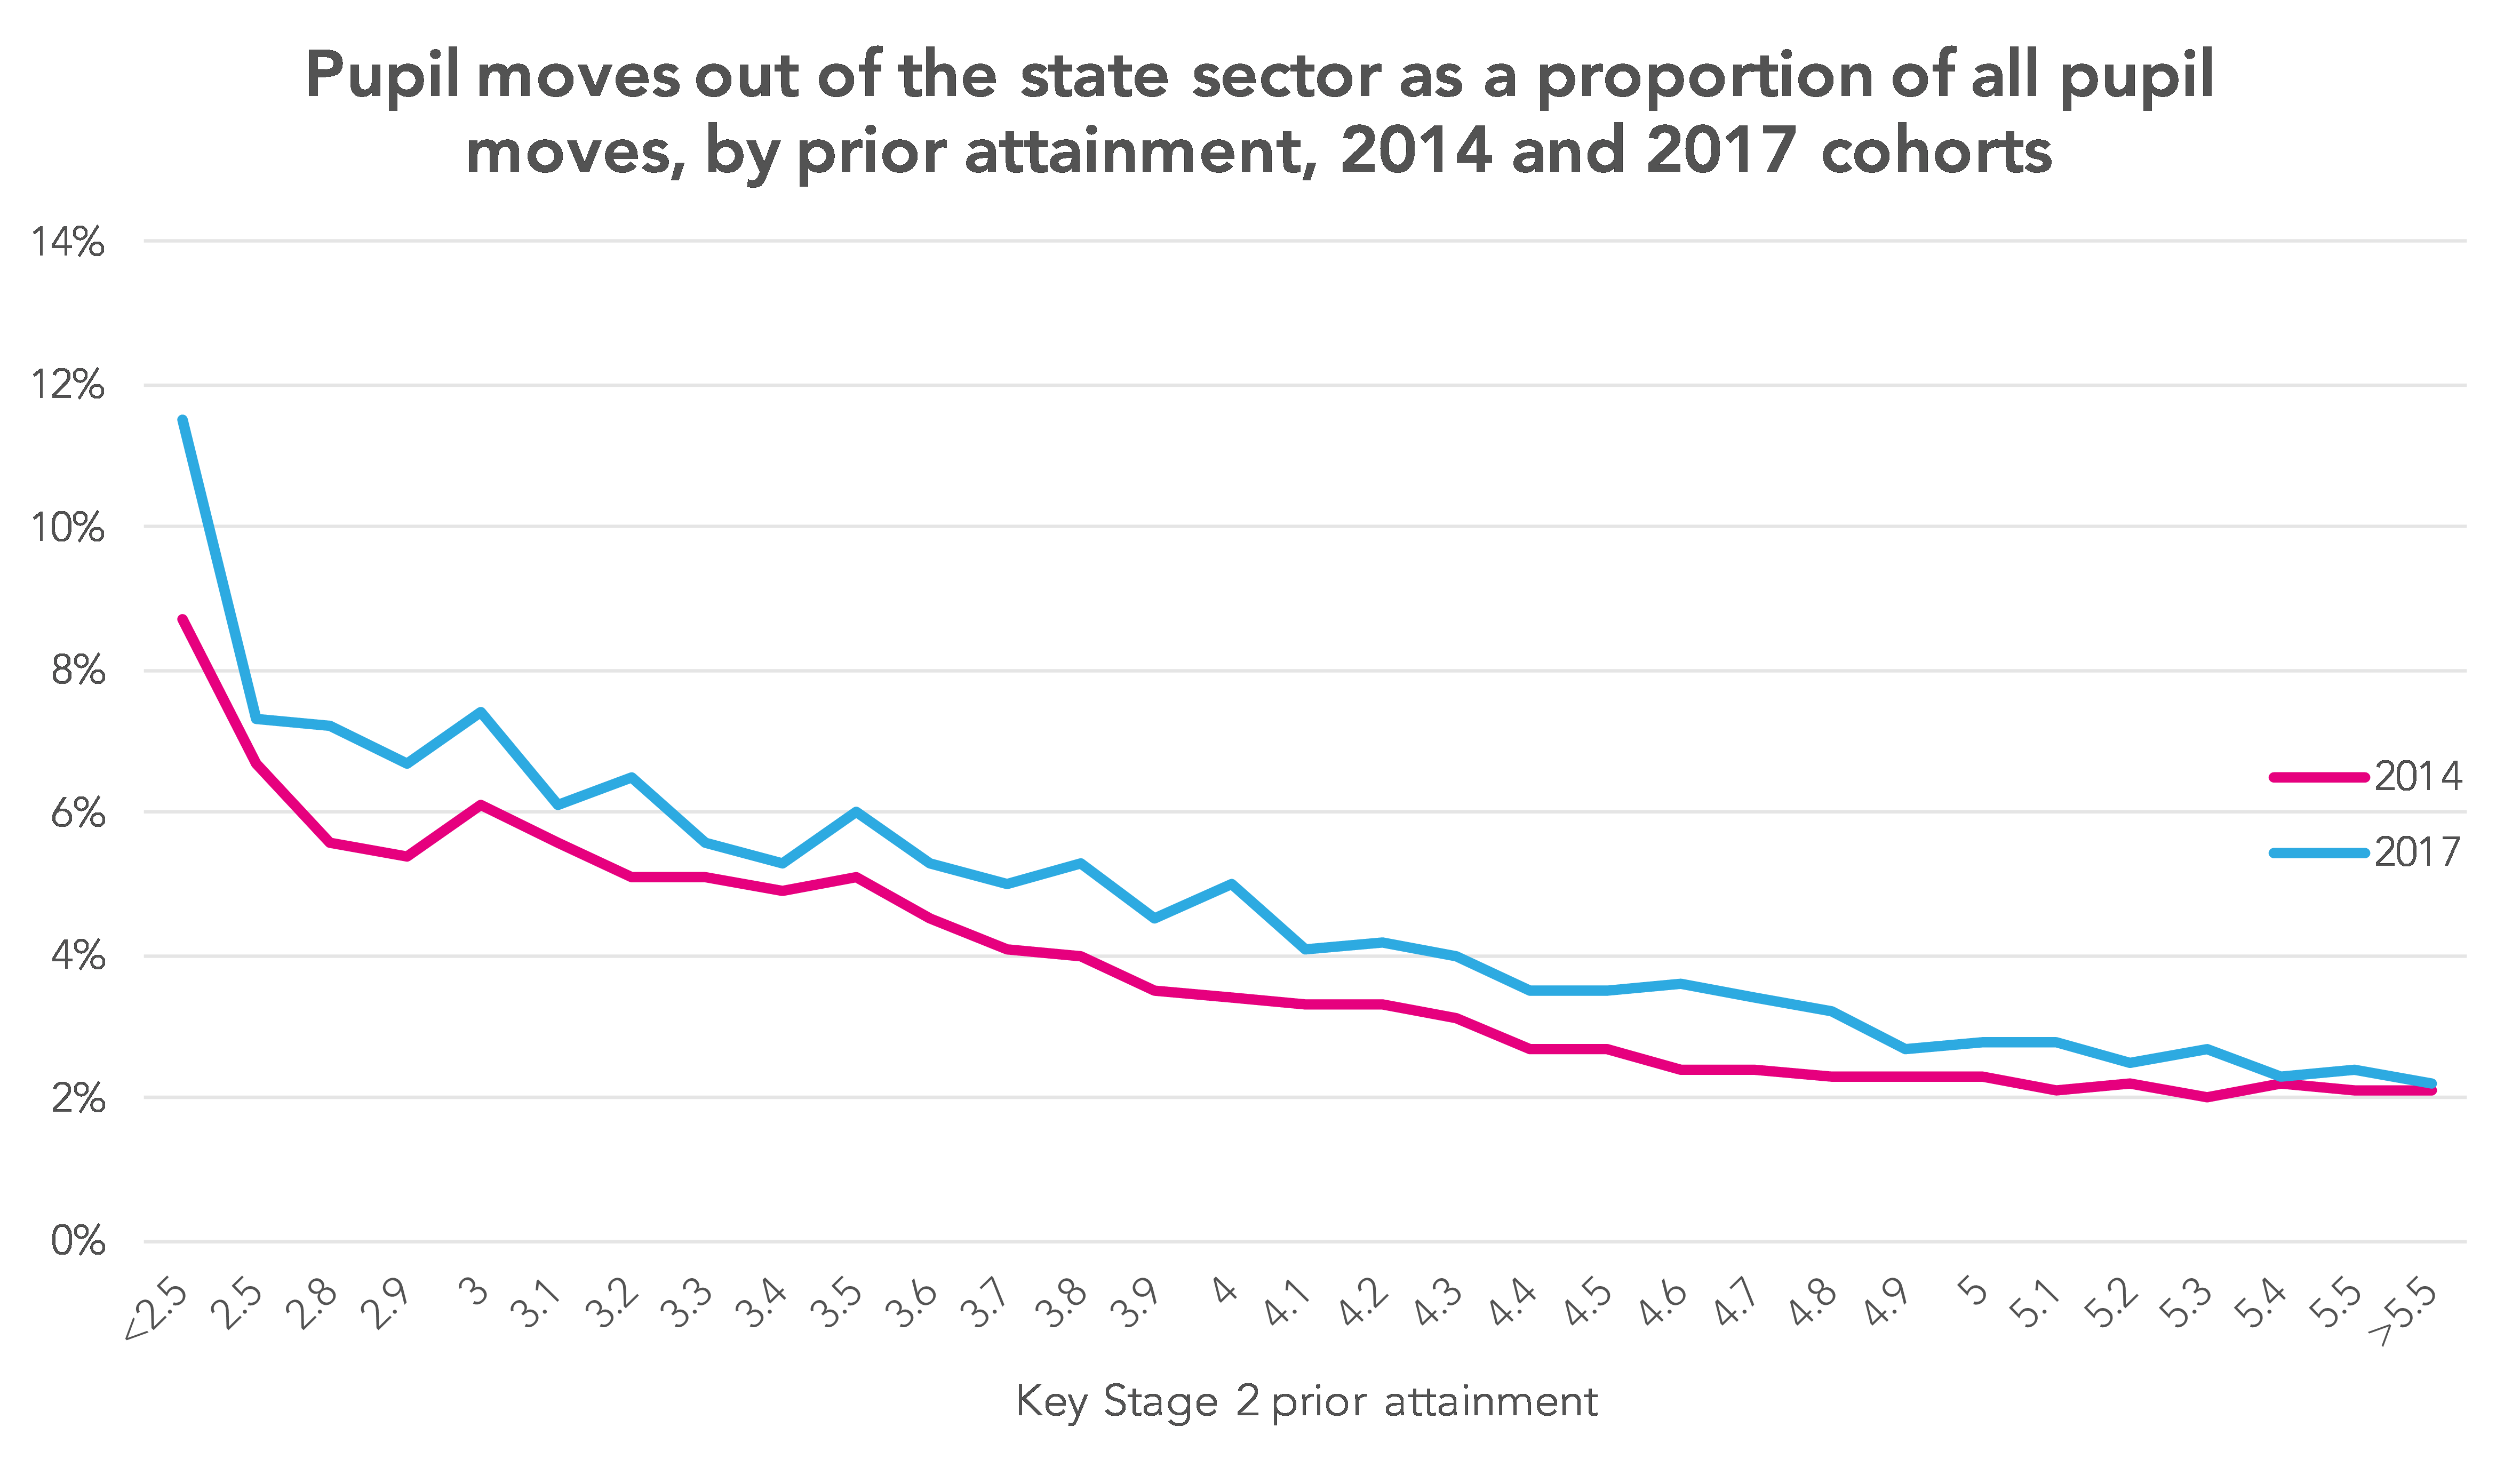
One observation which it is worth making is that there doesn’t seem to have been a large shift in the prior attainment of the group who were either not recorded as having taken any GCSEs or equivalent qualifications, or whose results did not count towards any establishment between earlier cohorts and the 2017 cohort – contrary to what we might have expected.
The chart below shows the proportion of those leaving state mainstream schools who leave the state sector entirely, for the 2014 cohort and the 2017 cohort.[2] A greater proportion of pupils across the prior attainment spectrum have left the state sector, but it is children with lower prior attainment who remain the most likely to leave in this way.
Reweighting
A policy proposal that we made last year was for the Department for Education to consider reweighting school league tables in proportion to the amount of time that a child had spent on-roll at each establishment – so, a pupil who had spent all of Years 7 to Year 11 at a school would count more than a pupil who had left in, say, Year 10, or one who had joined in Year 9. Unlike how school league tables work currently, in a reweighted approach all three pupils would contribute something to the school’s results.
In 2015, the government said that it planned to change the operation of school league tables so that mainstream schools would retain accountability for pupils they send to alternative provision or exclude [PDF]. The government’s recent paper setting out its vision for reforming alternative provision made mention of this, but stopped short of saying that the changes would go ahead [PDF].
Our concern is that this does not go far enough – not capturing off-rolling, and in fact increasing the incentive to off-roll among those who would be inclined to do so.
We remain of the view that adopting a reweighted approach would help reset some of the incentives that exist in school league tables, and have modelled the effect at regional and multi-academy trust-level. Details of the impact are given in these posts:
- Who’s Left 2018, part two: What impact would reweighting school league tables have for multi-academy trusts?
- Who’s Left 2018, part three: The impact of reweighting on London and the regions
Questions for the Department for Education
We have a pair of questions arising from this work that we would ask the Department for Education to consider:
1. In 2016 it was proposed that mainstream schools would retain accountability for pupils they send to alternative provision or exclude. Will this be enacted, and given the large numbers of pupils who leave in alternative ways and to alternative destinations, will they consider adopting our reweighted approach?
2. As our work shows, pupils can end up in one of a number of destinations, including the independent sector and unregistered provision. Can the Department for Education say that they are satisfied that all pupils who leave the rolls of mainstream schools are receiving a suitable education? And are they satisfied that local authorities have the resources they need to follow up cases where pupils leave the roll of a mainstream school?
Now read the next post in the Who’s Left 2018 series.
Want to stay up-to-date with the latest research from FFT Education Datalab? Sign up to Datalab’s mailing list to get notifications about new blogposts, or to receive the team’s half-termly newsletter.
1. Our estimate is based on Office for National Statistics internal migration statistics, Eurostat emigration statistics and ONS mortality statistics.
2. The 2017 cohort is looked at, as the most recent for which data is available. The 2014 cohort is looked at, as a year pre-dating the introduction of Progress 8 (2015 prior attainment data is not used as it is affected by the SATs boycott of 2010).


Do you have data on how these drop out rates looked like among BME students???
Hi Dom. We only had chance to carry out reasonably limited analysis by pupil characteristics, thought that showed that, within the group who leave the state sector altogether, pupils of non-white British ethnicity are over-represented. But of course we think a decent portion of this group are emigrating, which could provide one explanation – and as we don’t know which pupils it is who are emigrating, we’re not able to look at an ethnicity breakdown that accounts for this.