There’s no doubt that pupils who complete secondary education in independent schools go on to have better long-term outcomes.
But is there anything to suggest that they would have achieved worse outcomes if they had gone to a state school?
Comparing apples and Doritos
If we look at those who turned 16 in 2001/02, the long-term outcomes of individuals who went to independent schools were much higher.
The table below shows this for a number of measures: among other things, they were more than twice as likely to have achieved a degree by age 30, and were earning over 50% more.

Of course, at the moment we’re comparing apples and Doritos.
So let’s do what economists do and pretend to answer a much bigger question by answering a more limited question (spoiler alert: I can’t really answer this definitively either).
Comparing apples and things that look a bit like apples
Each year, we see a number of pupils move to independent schools having completed Year 6 in a state-funded primary school.
How do their long-term outcomes compare to similar pupils from the same primary school?
Looking at the three cohorts of pupils who were assessed at Key Stage 2 in state-funded, mainstream primary schools[1] between 2002 and 2004, roughly 41,000 pupils subsequently go on to complete Key Stage 4 in independent schools; just under 14,000 each year.
Of these, 30,000 leave the state-funded sector in England straight after Year 6. For the purposes of this analysis, we’ll assume that they moved into the independent sector at Year 7, but some may have spent time outside England before returning.
These pupils are matched to pupils from the same primary school with similar characteristics – including KS2 results – who remain in the state sector after Year 6.[2]
Of course, the pupils who move to the independent sector and their statistical matches may differ in other important ways which will affect subsequent outcomes. They may vary in resources and aspirations, for example. But we’ll come back to this when we see the results.
Results
The table below shows a set of outcomes for both groups of pupils up to the end of 2015/16 (the most recent year for which we have all of the data we need). By then the three cohorts are aged 23 to 25.
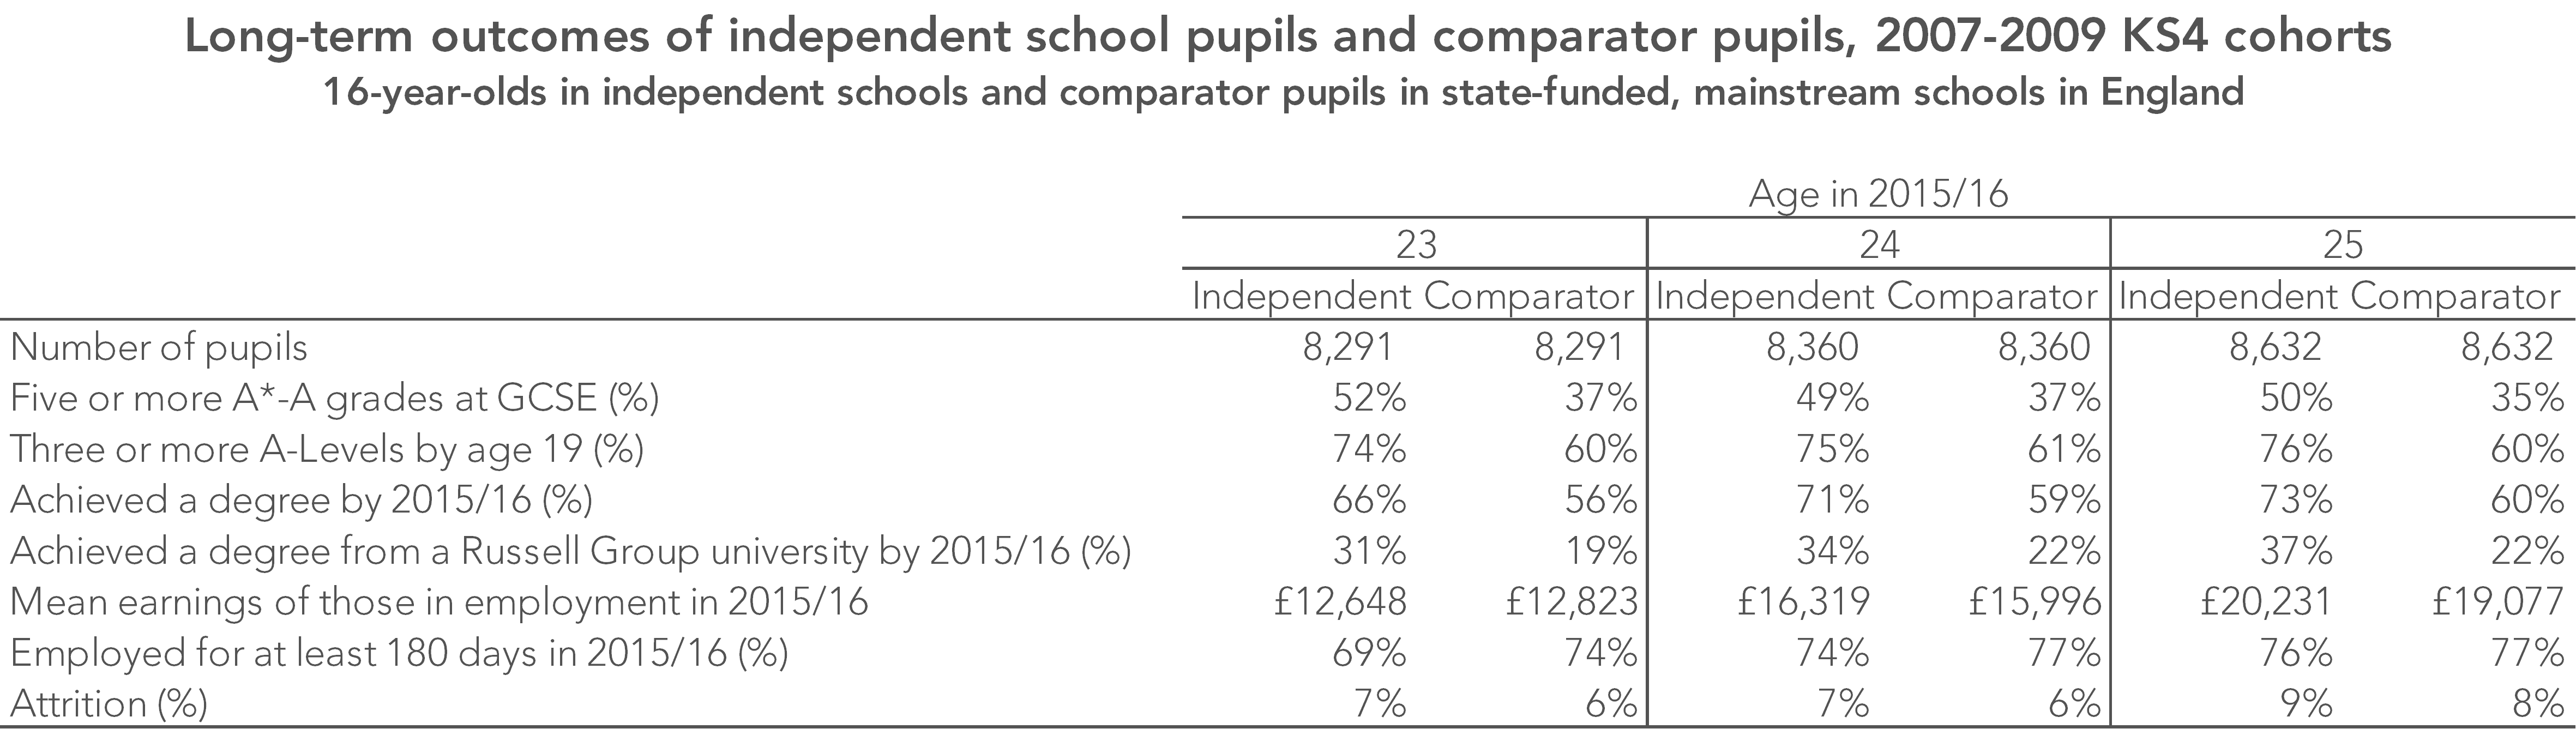
The outcomes of those who went to independent schools tend to be higher. On average, the 25-year-olds were earning £1,000 more than the comparison group and were almost twice as likely to have achieved a degree from a Russell Group university, for example.
That said, the differences in outcomes between those who went to independent schools and the matched set of pupils are nowhere near are as wide as those between all pupils who went to independent schools and all pupils who went to state schools, as shown in the first table above.
Do independent schools make a difference?
So do independent schools make a difference?
I can’t really answer that. The most we can say from this piece of work is that differences in outcomes between pupils who attended independent and state-funded secondary schools are due to more than prior attainment and basic pupil characteristics.
Whether these differences are due to the effectiveness of independent schools, or differences in family background, including resources, remains unanswered.
We would need access to data from the parallel universe in which the pupils who went to independent schools remained in the state-funded sector to answer it fully.
Of course, this isn’t an issue that just affects comparisons of independent and state schools. We can take account of differences between schools in terms of pupil prior attainment (value added) and demographics (contextual value added) when analysing school performance, but we can never really be sure whether the results we are left with are down to the school or to unobserved pupil background factors.
Want to stay up-to-date with the latest research from FFT Education Datalab? Sign up to Datalab’s mailing list to get notifications about new blogposts, or to receive the team’s half-termly newsletter.
The support of the Economic and Social Research Council is gratefully acknowledged.
![]()
- Including junior and middle schools.
- Matches are produced by finding a pupil from the same primary school with similar Key Stage 2 results. We also match exactly on Year 6 free school meals eligibility and whether the pupil’s first language is English or not. We find 25,000 good matches – that is to say, matches we think are sufficiently similar. Each pair of matched KS2 results is within 0.2 standard deviations. The groups are also reasonably well-balanced on a measure of neighbourhood deprivation (IDACI) even though that is not used in the matching.

Or the difference could be down to positive pr in favour of the independently educated e.g. for acceptance at Russell Group Universities?