A recent blogpost from the EAL Academy asks a very pertinent question: why does the number of pupils with English as an additional language drop between Year 6 and Year 7?
The chart below looks at pupils in Year 7 in state-funded schools in England between 2009 and 2018. It compares the first language recorded in the school census in Year 7 (English/other than English) with that recorded the previous year. The majority of pupils would have transferred from primary to secondary school in the intervening period.

Looking at 2018, for example, 83,000 pupils nationally (14%) were classified as EAL both in Year 6 and Year 7. But 29,000 (5%) were observed to have English as their first language in Year 7 having been recorded as EAL the previous year. Around 6,000 (1%) of Year 7 pupils nationally were identified as EAL in Year 7 having not been so in Year 6.
As the chart shows, pupils changing EAL status between Year 6 and Year 7 is not a new phenomenon, but it appears to have increased as the total proportion of EAL pupils has increased. Among the 2009 Year 7 cohort, 17% of pupils classified as EAL in Year 6 were classified as non-EAL in Year 7.[1] This figure increased to 25% among the 2018 cohort.
Ethnic background
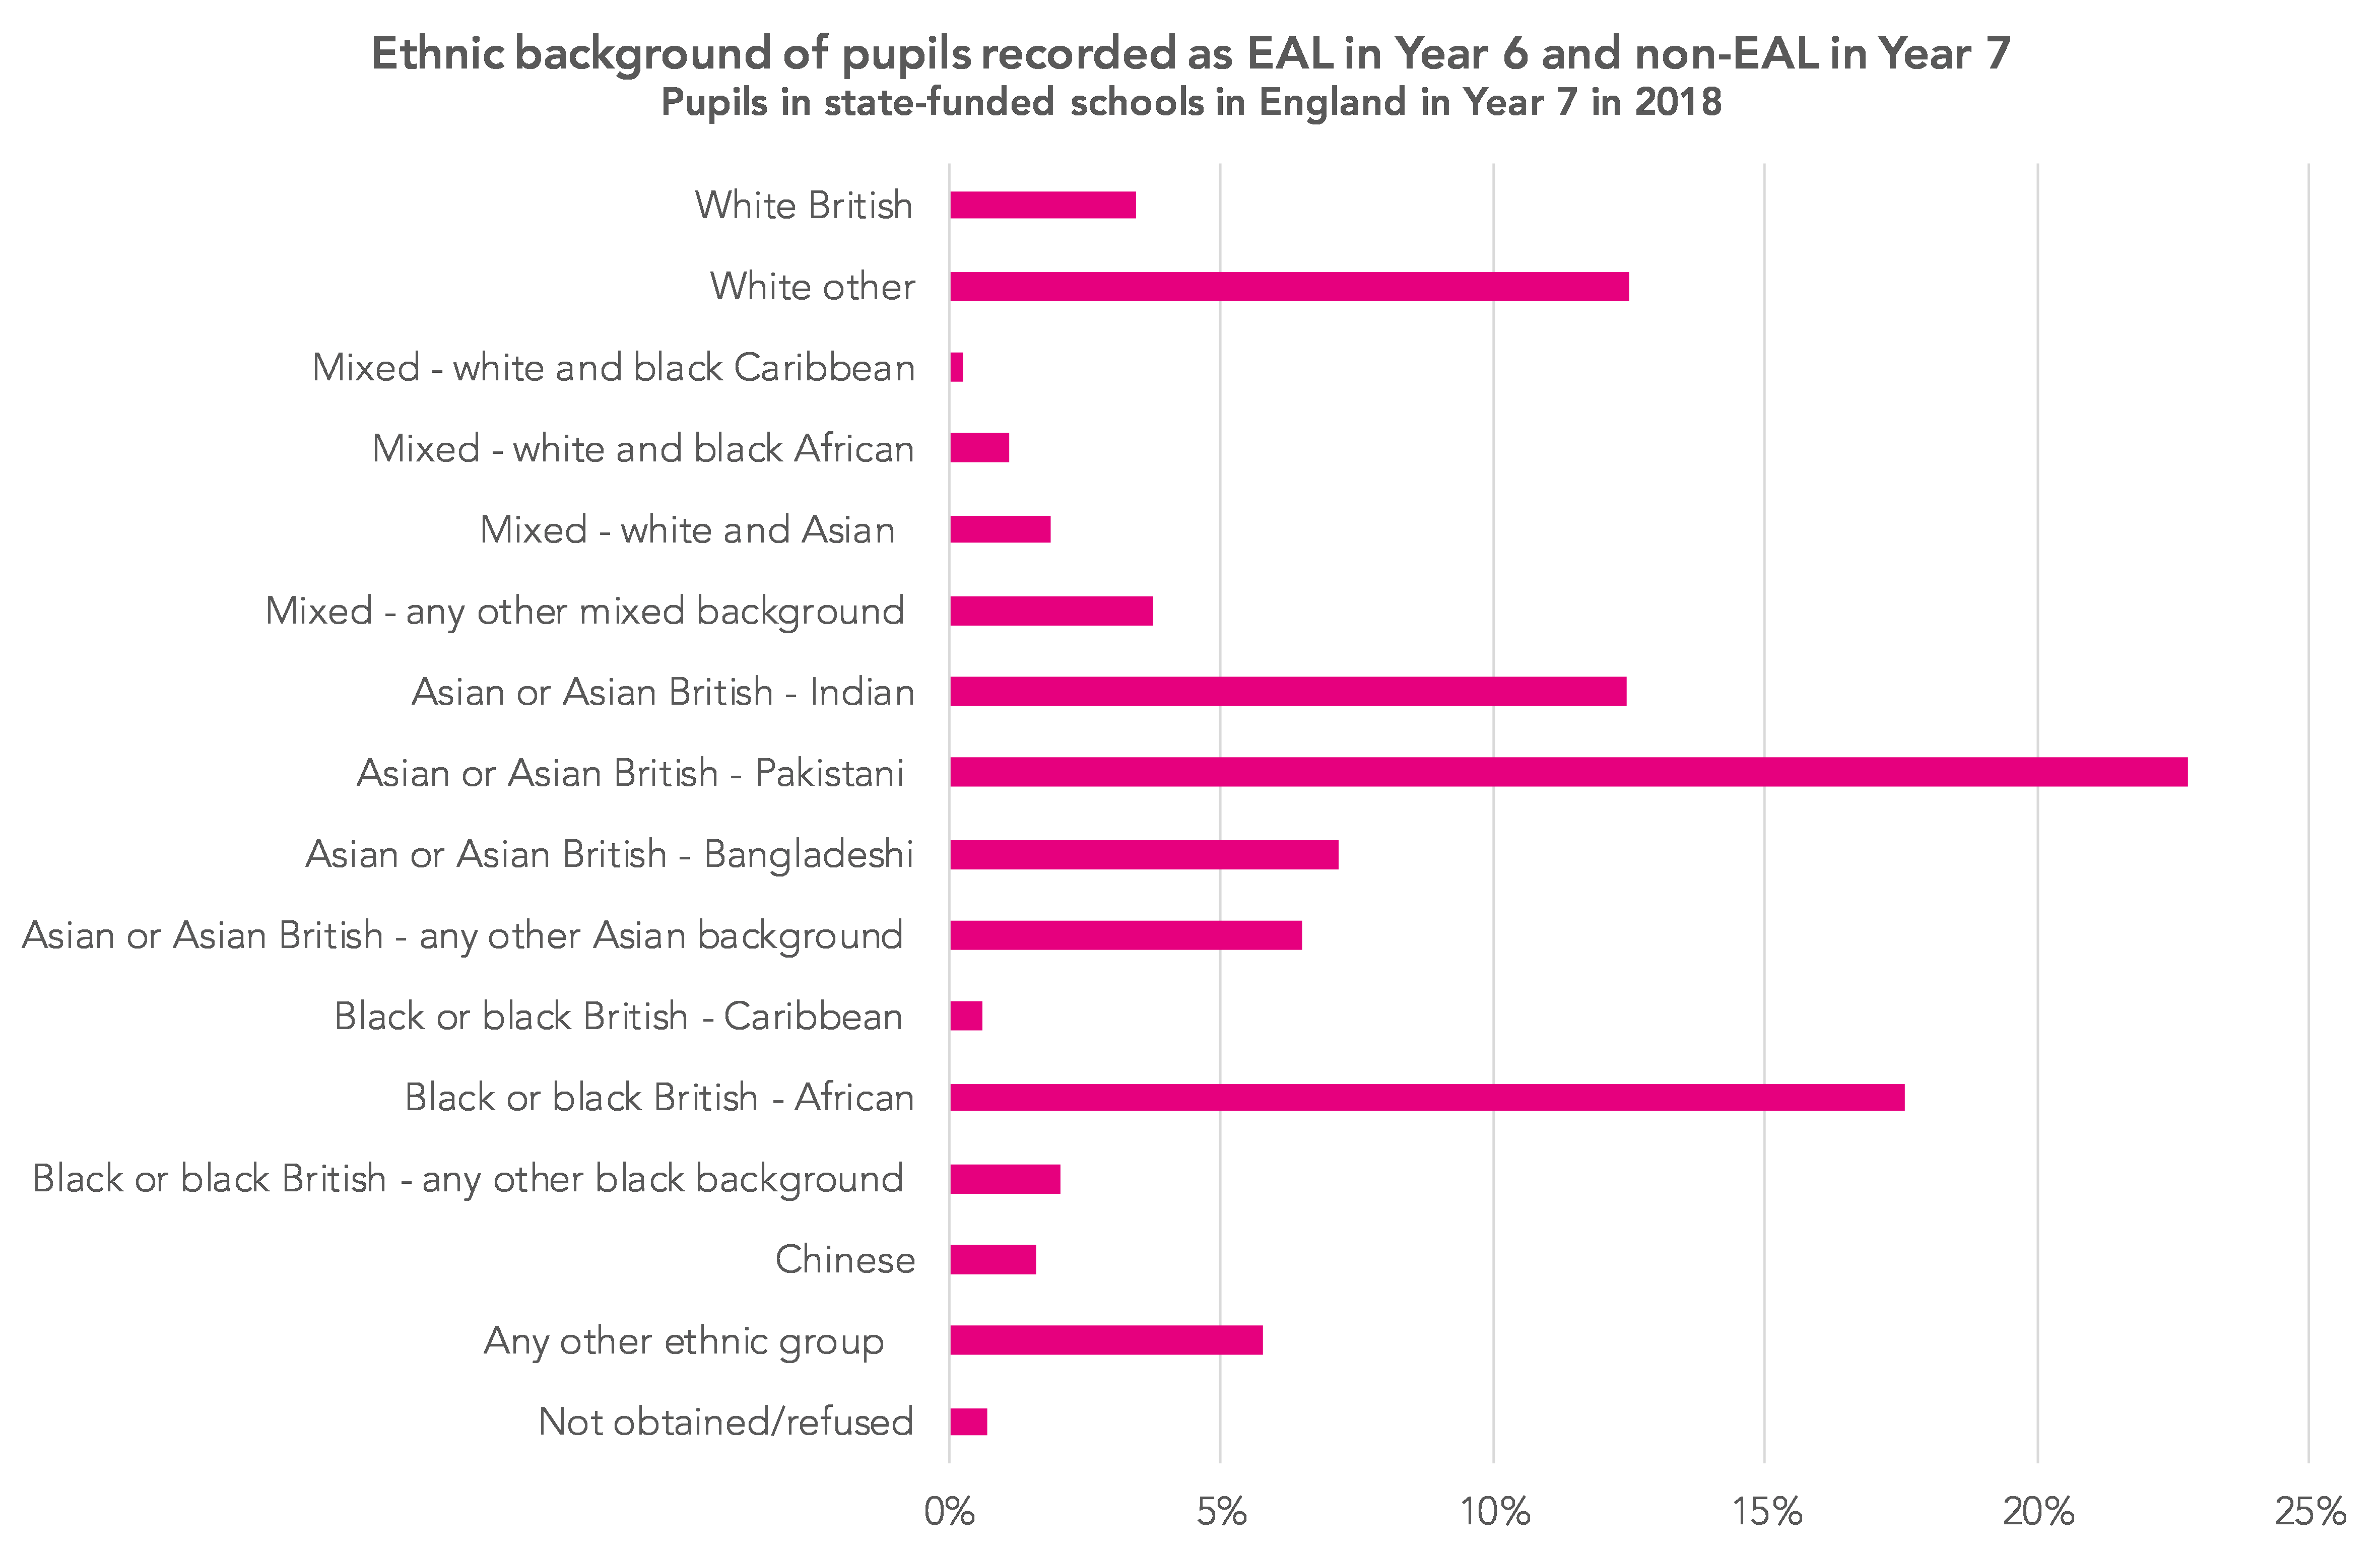
Next, let’s take a look at the ethnic backgrounds of the 29,000 pupils who were recorded as EAL in Year 6 and non-EAL in Year 7 in the most recent cohort looked at.
The chart below reports the ethnic background recorded in Year 6. In total, 85% of these pupils are from groups that are predominantly EAL: Asian, black African, white other and any other ethnic group.
Going back in time
For older cohorts, we can look at the subsequent attainment at the end of Key Stage 4 of pupils who lose their EAL status.
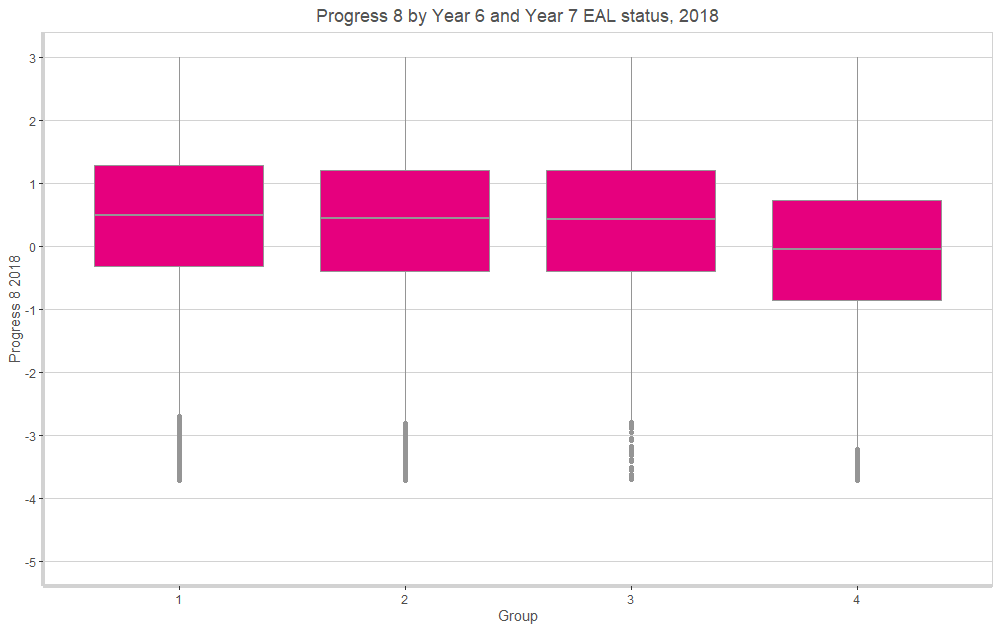
The table below takes the Year 7 cohort from 2014 and compares the Progress 8 scores of groups of pupils defined by their Year 6 and Year 11 EAL status.

On average, the P8 score of pupils classified as EAL in Year 6 but not in Year 11 is closer to that of pupils classified as EAL in both years than it is to that of pupils classified as non-EAL in both years. This is particularly the case if we remove pupils who were recently arrived in the English education system at the time they took Key Stage 2 tests.[2] This reduces the P8 score for Group 1 to 0.43 and for Group 2 to 0.38. That said, there is a fair amount of variation within each group as the box plot below shows.
How to interpret a box plot
The charts used here are box plots, a type of chart which most people are likely to recognise – but the details of which we may not all remember.
The line across the middle of the box is the median – the value which exactly half of results fall below, and the other half fall above. The box itself shows the range between the lower quartile – the value below which exactly a quarter of results fall – and the upper quartile – the value above which exactly a quarter of results fall. This definition means that exactly 50% of results are within the range of values covered by the box.
The difference between the lower quartile and the upper quartile is the inter-quartile range. The whiskers stretching out from the box reach to the maximum and minimum values, excluding outliers, which are shown as dots. Outliers are defined as results more than 1.5 times the inter-quartile range away from either the lower or upper quartile.
Conclusions
This cursory analysis suggests that the group of pupils whose recorded first language changes when they move from primary to secondary are probably mostly pupils with a first language other than English, and therefore the percentage of EAL pupils in the secondary sector is underreported.
Would we really expect EAL status to change between primary and secondary school? The expectation is that data on pupils transfers from primary to secondary via a common transfer file.
Schools are also recommended to write to parents and carers to check the data held about pupils in their management information systems. The definition of first language is a bit of a mouthful but it is the same for both primary and secondary schools.[3]
This begs the question about why changes occur.
Are there differences in the way primary schools and secondary schools elicit information about first languages? Are parents or carers more likely to report English if their child has reached proficiency? Are there just more recording errors in secondary schools?
Want to stay up-to-date with the latest research from FFT Education Datalab? Sign up to Datalab’s mailing list to get notifications about new blogposts, or to receive the team’s half-termly newsletter.
1. This is the size of the blue bar divided by the size of the pink and blue bars combined.
2. Pupils first registered in 2008/09 or later.
3. “Where the pupil has been exposed to a language other than English during early development and continues to be exposed to this language in the home or in the community.”


Could it be that primary schools simply know their families better? In primary schools parents come into the school office far more frequently than they do in a secondary school. They are more likely to talk to the office staff to pay in dinner money, pay for a trip, or to hand a form in. And so office staff are more likely to know which parents don’t speak English as a first language. The person inputting language data into a school’s MIS is probably also the person who first talks to parents when they come into school. Secondary schools are bigger, with more of a disconnect between the office staff who input this data, and both pupils and their parents. So if a form requesting first language doesn’t get returned by a Year 7 parent, would the staff member be more likely to put ‘not yet obtained’ in the language field, whereas in a primary school office staff are more likely to know the language spoken in the home? This is just speculation on my part, but I am certain that in my children’s primary school (admittedly one form entry, with a fairly stable pupil population) the office manager who puts this information in SIMS knows families as well as the headteacher!
The issues about how the data are collected are very important. See https://www.theealacademy.co.uk/eal-proficiency-scales-gone-not-forgotten-part-1/.
The observation that it happens, and the effect it has, is more important than the reason it happens. EAL pupils in general have higher P8 scores. If loss of EAL status is uniformly distributed across EAL intake, school performance analysis by CVA, means that schools with high {and conversely low) proportions of EAL pupils will appear to be performing better (and conversely worse) as a result of a school effect, whereas the difference in performance is actually a consequence of different (but hidden) difference in pupil charactaristics.