With the much publicised change in this year’s grading process for A-levels and GCSEs, a lot of focus has rightly fallen on whether the impact has been felt more strongly by certain groups of students than others (here, for example).
The problem with using raw results to answer this question is that it’s hard to tell how much of the difference in outcomes between two groups of students is related to the characteristic of interest (for example, disadvantage) and how much is related to their other characteristics (for example, prior attainment.)
Within their main A-level results release yesterday, Ofqual published a report designed to do exactly this.
They looked at changes in gaps between different groups of students in three metrics: average grade, proportion of entries awarded at least an A grade, and proportion of entries awarded at least a C grade. The type of models they used took into account the differences in students’ other characteristics, as well as the fact that results tend to be more similar within schools and subjects than between.
They define as “notable” any gaps which have grown or shrunk by more than we’d expect in a normal year, and by at least a tenth of a grade for the average grade measure or at least one percentage point for the two proportion of entries measures.
So what did they find?
By pupil group
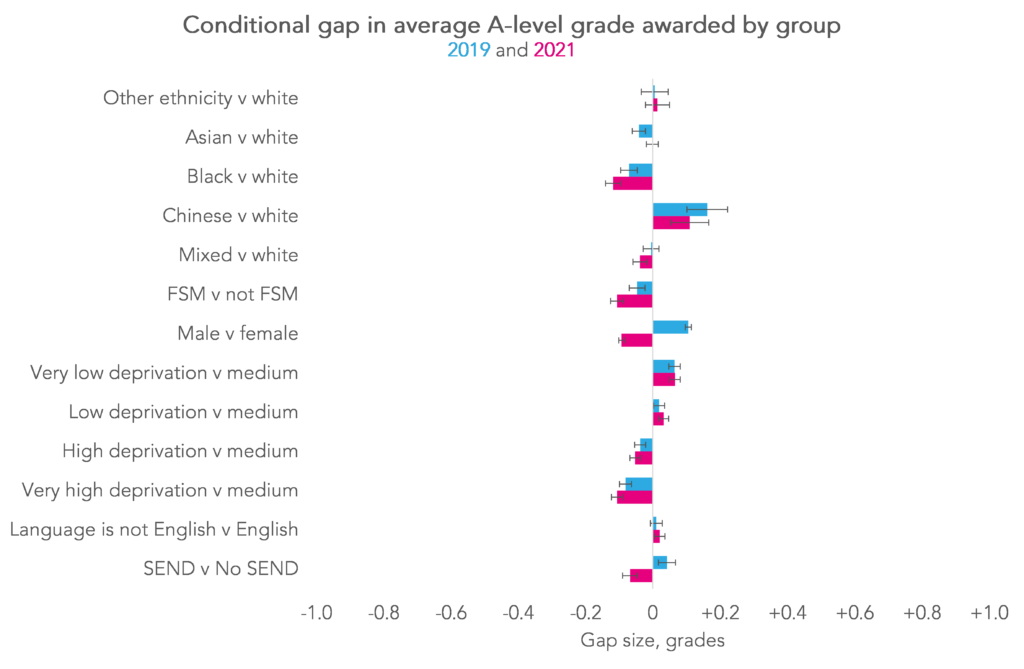
Well, in terms of average grades by pupil group, not much. All groups of students have seen their grades increase this year (compared with 2019 and with 2020) and the increase has been dealt out pretty evenly.
The only “notable” changes in gaps for any student groups are small: between 2019 and 2021, there was a shift from males to females of 0.2 grade, and from students with SEND to without of 0.1 grade.
When they looked at the proportion of entries awarded at least an A , there were more “notable” changes to highlight. In particular, although all groups of students saw a greater proportion of entries awarded the top grades, black students, those eligible for FSM, and those from areas of high deprivation saw smaller increases than their peers (with the same prior attainment). As a result, the gap widened slightly by around 1.4 percentage points for all three groups between 2019 and 2021.
It’s worth pointing out that we would expect to see this even in a scenario where all groups of students saw all of their grades increase by exactly the same amount: those with lower outcomes in 2019 would have been better represented in the grade distribution at lower grades, and those with higher outcomes at higher grades.
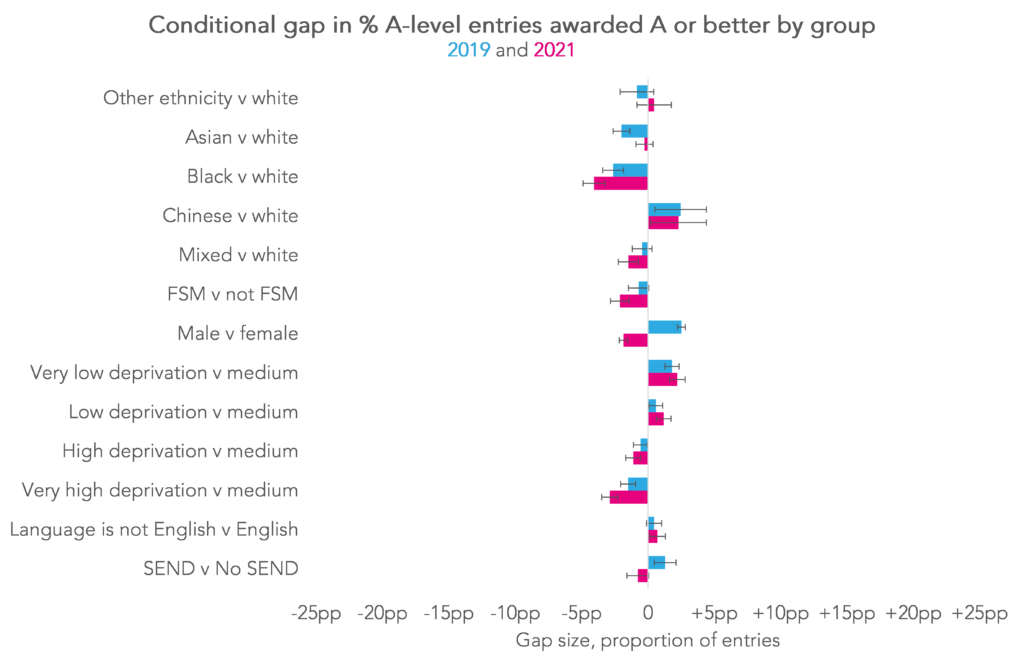
For the proportion of entries awarded at least a C grade: the gap between black and white students, and between those from areas of high deprivation and lower stayed the same from 2019 to 2021, while that between those eligible for FSM and not grew by one percentage point.
As we’d expect given the changes in average grade gaps, between 2019 and 2021 there was a shift towards female students and those without SEND on both the proportion of entries awarded at least an A grade and at least a C grade: 4.4 and 4.8 percentage points towards female students on the A grade and C grade measures, respectively, and 2.1 and 2.6 percentage points towards students without SEND.
FFT 2021 Secondary Results Service
Aspire schools can access a full national analysis of this year’s KS4 and KS5 results as well as future KS5 estimates for Y12 students. Simply upload your grades to Aspire before 3 September.
Not an FFT Aspire user?
Subscribe now
By centre type and region
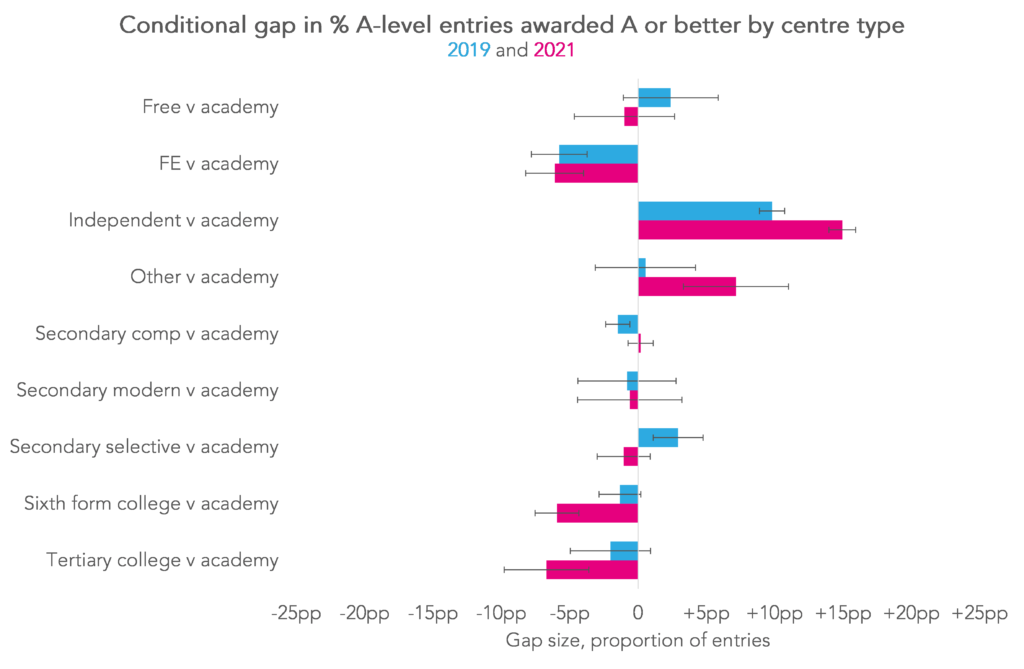
As well as pupil groups, Ofqual also provided the same analysis for centre type and region. They used a slightly different model here, reducing the number of student-level characteristics included to just prior attainment. It may be important to note here too that in the report’s data, any centres who changed type between 2018 and 2021 are excluded completely.
They found that, between 2019 and 2021, the longstanding gap between independent schools and academies (the reference group in this report) widened by 0.1 grade and 5.1 percentage points in entries gaining at least an A grade.
For sixth and tertiary colleges where outcomes tend to be lower for students with the same prior attainment, the gap has widened by around 0.1 grade and around 4.6 percentage points at A grade or above.
The report highlights something interesting for selective secondaries: in 2018 and 2019 students in these schools had better outcomes than those in academies (with the same prior attainment), but this year the gaps in all three metrics of interest has closed. The 2019 to 2021 swing towards academies is 0.18 grade, on average, and around 4 percentage points in entries awarded at least an A and at least a C. We believe, though it is not stated, that “selective secondaries” excludes those who are also academies (see section “A plea”, below!).

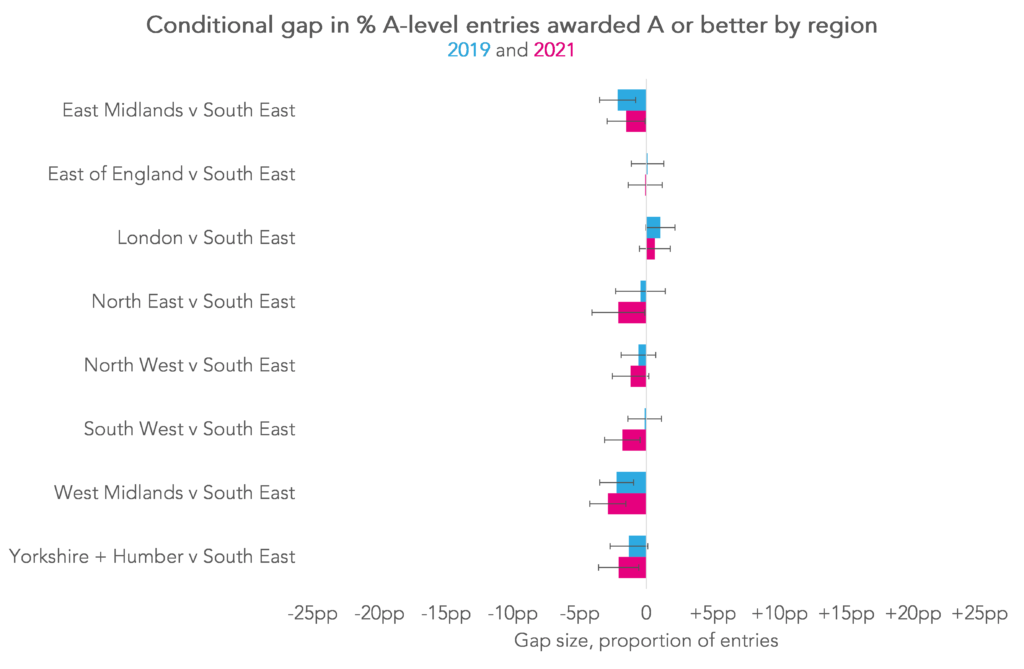
In the regions, there were no “notable” changes in gaps from 2019 to 2021 in terms of the average grades achieved by students, but a widening of the gap at A grade and above of around 1.7 percentage points for the North East and the South West compared with the slightly higher outcomes of candidates in the South East (the reference group).

Summing up
We’ve seen a lot of focus on potential inequalities in this year’s grading system, with commentators (us included) observing gaps between groups of students in results growing and shrinking compared with previous years.
The modelling approach used in Ofqual’s equalities report goes some way towards allowing us to disentangle the factors at play. For example, it corroborates the much publicised boost for students in independent schools (compared with academies), but explains most of the changes in regional gaps by differences in centre-type and prior attainment.
What this report does not address (and, indeed, this is stressed in its introduction) is how far the changes we’ve seen from 2019 to 2021 are due to the grading processes, and far they are due to the impact of COVID. It’s unclear whether this is something we’ll ever be able to know for certain.
A plea
It would be helpful if other research teams were given access to the underlying data to replicate Ofqual’s findings.
This isn’t to call into question Ofqual’s competence, rather to test the sensitivity of the results to other modelling choices. For instance, using school fixed effects rather than random effects, modelling binary outcomes (e.g. grade A or above) using a logistic (or probit) regression specification rather than linear probability models, and classifying centres differently.
It might well be that the conclusions would be the same. But it would give greater public confidence in the analysis. Ofqual and DfE recently announced that data from 2020 will be made available to researchers and we hope this will be extended to include 2021.
Sign up to receive our blogposts by email to make sure you don’t miss any coverage.
And don’t forget to visit our dedicated results day microsite for more on the trends in entries and results by subject.


Leave A Comment