A-Levels results are out. Students will now have received their results and national figures have been published.
So, after another year without public exams, what do this year’s results show?
Results have increased again
Across all A-Level subjects, results have increased again this year.
The proportion of A or A* grades has gone up to 44.3% from 38.1% last year. And the percentage graded C or above increased from 87.5% to 88.2%. [1]
The largest increase in attainment at any part of the grade distribution was at A*, which was up nearly five percentage points from 14.3% to 19.1%
But, as we’re all painfully aware, last year was a very unusual year.
If we compare this year’s results to the years before the pandemic we get a better sense of how extraordinary they are.

From 2017 to 2019, results were on a slight downward trend. The percentage of entries awarded A or A* decreased from 26.2% in 2017 to 25.2% in 2019.
This trend was sharply reversed in 2020.
There have been higher increases in some subjects
Last year, we pointed out that grades in small entry subjects – like languages and music – had increased even more than the average.
This year we also see a lot of variation at the subject level. The percentage of entries receiving an A or above in further maths, for example, has changed very little, up just 4.0%. While in music the figure is 13.1%.
But again, it’s actually useful to compare this year’s results to 2019. This shows how some subjects have tended to do better out of CAGs and TAGs than others.
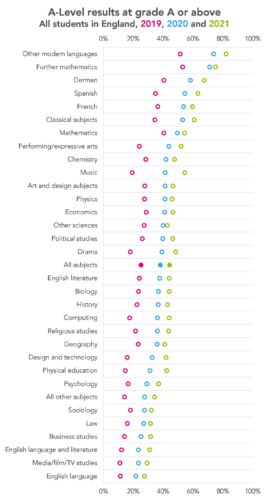
The smallest change is in maths. The percentage achieving an A or above has gone up from 40.5% in 2019 to 54.4% this year, a 13.9 percentage point increase.
The largest change, in music, is an increase from 19.3% in 2019 to 54.5% this year, a huge 35.3 percentage point increase. Languages, drama and performing arts and physical education have all seen large increases as well.
The chart below allows you to explore how the grade distribution has changed from 2019 – 2021 for all of the subjects for which data is available.
Entries are down in English and up in STEM (and geography)
FFT 2021 Secondary Results Service
Aspire schools can access a full national analysis of this year’s KS4 and KS5 results as well as future KS5 estimates for Y12 students. Simply upload your grades to Aspire before 3 September.
Not an FFT Aspire user?
Subscribe now
As we predicted on Monday, entries in English have fallen this year. They’ve been on a downward trend for some years but saw a slight recovery in 2020.
But this year they’re down by 5.3% in English literature and 3.7% in English language.
Entries in biology, chemistry and physics increased by 6.6%, 6.3% and 6.4% respectively, but the real winner in the STEM category was computing. Entries in the subject increased by 11.4%, following an increase of 11% last year.
Geography saw the biggest increase of all at 16.4%, although this follows a fall of 14% last year.
Finally, entries in other modern languages fell sharply again this year, down by 8.2%. They fell by 40.9% last year and there are now just under 5,000 entries.
Independent schools got more top grades than ever
Independent schools have done very well again. The percentage of entries achieving an A or above has gone up from 44.0% in 2019 to 70.1% in 2021.

One theory put forward to explain this, for instance in Ofqual's analysis on the awarding of CAGs, is that students with higher prior attainment in all types of schools have tended to achieve higher results relative to other students under both CAGs and TAGs. There are disproportionately more of these students in independent schools.
Further education colleges also saw a large increase - the percentage of A/A* entries more than doubled between 2019 and 2021, from 12.2% to 28.8%. Although we suspect this is a feature of having a lower rate to begin with.
We don’t know much about the external quality assurance process
Ofqual and JCQ are being tight-lipped at the moment about the mechanics of the external quality assurance process undertaken by awarding bodies but are promising more detail in Ofqual’s annual report later in the year.
Some details have emerged, however. 1,101 centres (roughly one-in-five) had work scrutinised by awarding bodies although this total covers both GCSE and A-level. Centres were selected either by random sampling or by a “risk-based approach” (i.e. an algorithm).
For 85% of centres, the supporting evidence supplied was judged to support the TAGs awarded. Further scrutiny was undertaken on the remainder. In some cases, this led to schools changing their TAGs although this affected less than 1% of grades awarded.
Given the variation in evidence supplied by schools, with work being produced at different times under different conditions, it is hard to see how the awarding bodies could do anything other than sign off schools’ TAGs.
The question of how much money awarding bodies should return to schools is a live one, and the value for money of this stage of awarding process is something that ought to be considered.
Entries are up and there are large differences by region and gender
Overall, the number of entries has increased by 4.7% from last year. This is only partly explained by an increase in population.
The increase in entries may be linked to the pandemic - it may be that fewer students have dropped out of A-Levels this year than we'd usually expect.
There's no denying that this year's results look very different to the last set of results we had pre-pandemic. But have the changes this year benefitted some students more than others?
There are certainly some large regional differences. Ofqual have released data showing that the percentage of entries achieving an A or above ranges from 39% in the North East to 48% in London. Although regional differences in education are nothing new.
Differences by gender also persist. The percentage of entries from female students that are grade A or above stands at 46.4%, an increase of 17.6 percentage points from last year. But the percentage from male students is just 41.7%, an increase of 14.6 percentage points.
There'll be much more to say on this year's results, and we'll be posting more analysis throughout the day. Sign up to receive our blogposts by email to make sure you don’t miss any coverage.
And don’t forget to visit our dedicated results day microsite for more on the trends in entries and results by subject.
- The figures we’re reporting are all-age figures for England. If you see slightly different figures used elsewhere that might be because others have focused on 18-year-olds in England only.


I find the increase in Independent school results astonishing. While I believe all teachers and schools behave professionally, I find this difficult to believe there has been a level playing field. 25% of teachers in independent schools were lobbied by parents to give their child good grades. Independent schools lobby universities too. From 44% to 70% of independent students getting top grades is just too hard to take – state school children disadvantaged yet again.
44% to 70% is an increase of 59%.
But state comprehensives, secondary moderns and academies have seen increases of around 100%.
Not sure there’s any evidence of state school disadvantage here.
Picking a single statistic to justify anything is unhelpful and misleading. Another way to look at these results gives the opposite view: for every two kids in comprehensive schools getting As in 2019, there are now four getting As in 2021 (an increase from 20 to 40%) whereas in private schools, for every two kids who got As in 2019 it’s only three who got As in 2021 (an increase from 44 to 70%). Paints a different picture entirely.
Hi Jim. I take your point but I disagree. The more advantaged group is even larger in size as a result.
It’s not cumulative, it’s per student so the size of the group shouldn’t actually make a difference to the result. In fact it sort of argues against your point because it highlights the sheer number of state school students who are benefitted.