This is the second part of a two part blogpost. The first part can be found here.
In the first post in this series, we looked at the decline in entries to A-Level English. Now we turn to the arts.
First, a note on how we’ve defined ‘the arts’. We’ve included the same six subjects at GCSE and A-Level: art and design, design and technology, drama, music, performing/expressive arts and media / film / TV studies. In this post, we’ll be talking about how ‘the arts’ as a group of subjects have fared over the last five years and also about how the individual subjects compare.
The pipeline
We’ll look at A-Level entries in a moment, but the decline in the arts actually sets in earlier.
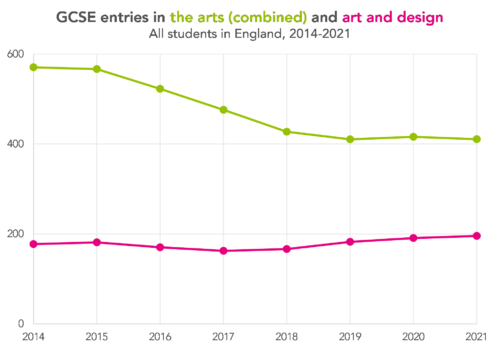
I should note that, despite my intention to look at trends over the last five years, I thought it worth going back a few more years for the graph above just to illustrate the longer term trend at GCSE.
Since 2014, entries to arts subjects have fallen by more than 150,000, a decrease of 28%. They fell every year from 2014 until 2019, although numbers do seem to have stabilised since then. [1]
Intriguingly, numbers actually increased in GCSE art and design over the same period. But the other five subjects that we included in ‘the arts’ have all seen decreases.
We’ve written before about whether the decline in the arts at GCSE can be blamed on the introduction of the EBacc. Our argument in the past has been that it probably can’t be because similar decreases have been seen in Wales, which doesn’t have the EBacc.

As shown above, this is still the case: entries to the arts in Wales were 20% lower in 2021 than in 2014, less than the decrease in England but still substantial.
The situation at A-Level
Entry numbers at GCSE may have stabilised over the last few years, but the same is not true of A-Levels.
In fact, entries to A-Levels in the arts have declined every year since 2017, falling by 13%. But, as at GCSE, this is not evenly distributed between subjects.
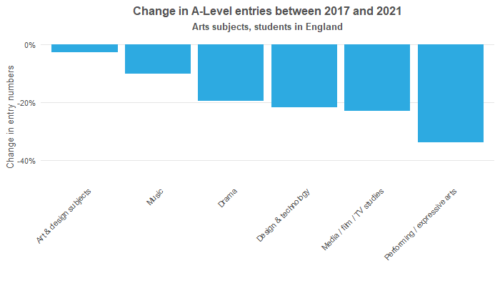
Performing / expressive arts is the subject that’s taken the biggest hit, with a decrease of 34%, although this was a subject with a relatively low number of entries to start with. Art and design has held fairly steady with a small decrease of 3% over the same period. Music has lost a tenth of their students, and media / film / TV studies, drama and design and technology around a fifth.
The effect of this is to push up the proportion of arts students who are studying art and design.
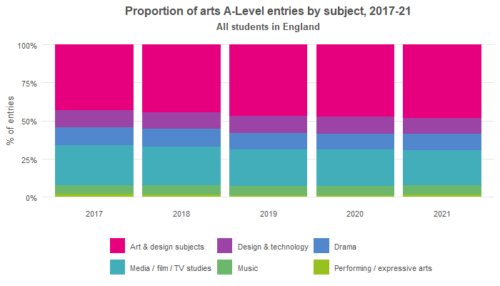
In 2017, 43% of A-Level arts entries were in art and design and by 2021 this had increased to 48%. So not only are fewer students choosing to study the arts; those who do choose to study it are selecting a narrower range of options, with more and more opting for art and design over, say, drama or music.
The demographics of arts students
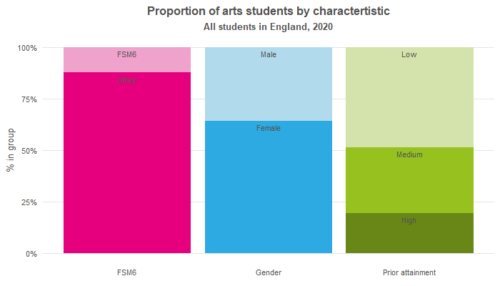
From this point onwards, we’ll be using data from the National Pupil Database (NPD) rather than publically available data from JCQ so that we can go into more detail. We’ll start by looking at the characteristics of arts students in 2020, the most recent year for which data is available from the NPD.
Taken as a group, arts students are more likely to be female than male (64% were female in 2020). 12% were disadvantaged – roughly the same as for the broader population of A-Level students. They were less likely to have high prior attainment at KS4 – just 19% were in the top third, based on their average points score, and 49% were in the lowest tercile.[2]
But looking at arts students as a group masks some big differences between subjects. D&T, for example, is disproportionately male (67% male in 2020), while music and media / film / TV studies are fairly well-balanced. Music has a high proportion of high prior attainers while media studies has a very low one – and so on.
It would be fair to say that A-Level arts students are not a homogenous group. This makes it more difficult to unpick which students are moving away from the arts, and why.
Have demographics changed as numbers have declined?
Not particularly, is the short answer, at least not over the last few years. Performing / expressive arts has changed the most; entries from male students – always low – have decreased more than for female students, and entries from low prior attainers have decreased more than other groups.

This has the effect of making increasing the proportion of female students – 93% of students were female in 2020 compared to 88% in 2017 – and pushing down the proportion of low prior attainers taking the subject, from nearly half (47%) in 2017 to 43% in 2020.
In other subjects, though, there’s very little change – media studies was 57% female in 2017 and 55% in 2020, for example. And while there are some small increases in the proportion of disadvantaged students, this reflects changes to the broader A-Level population.
So all in all, there’s not been much of a change in the demographics of A-Level arts students over the last few years. There doesn’t seem to be any particular group of students who are more likely to turn away from studying the arts than any other.
The upshot
It’s well known that the numbers studying the arts at GCSE and A-Level have fallen in recent years – although they have been making a bit of a recovery at GCSE. But some subjects have suffered far more than others.
We should remember that ‘the arts’ covers a diverse set of subjects that tend to attract very different students. Lumping them all in together (perhaps as “dead-end courses”) isn’t always helpful.
We need to look carefully at what’s going on at the subject level to understand why students are turning away from the arts. It might not be a question that quantitative researchers can answer.
- The population of 16 year olds has increased since 2018, but before that was decreasing every year. The fall in arts entries was far steeper than the fall in population but the stabilising of numbers in more recent years may have been helped by the increase in population.
- We excluded any pupils who took their GCSEs prior to 2017 from this part of the analysis. The low attainment tercile includes pupils with an average points score between 0 and 5.3, medium between 5.3 and 6.5, and high 6.5 or above.
Want to stay up-to-date with the latest research from FFT Education Datalab? Sign up to Datalab’s mailing list to get notifications about new blogposts, or to receive the team’s half-termly newsletter.


Thanks for both your blog posts. It makes me think of two things
1) no of A level choices gone down from 4 to 3 so that may have had an effect on the arts and English in particular. Was Eng a subject that was often a 4th or AS choice?
2)The subjects that you have grouped together as ‘the arts’ are just not getting the same curriculum time in KS3 as they once did some are cut altogether (particularly sad about DT) and then they are not getting chosen for GCSE and therefore not at A level
Hi Rachel. Thanks for your comments. Your first point is one that I wondered about. I think it would be really interesting to take a proper look at which subjects were most affected by the move away from AS. I’ve found that most people seem to think their own subject was particularly badly affected, but they can’t all be right! Your second point certainly sounds like a plausible explanation, and it’s not something that we can see in the data.