In January we looked at some alternative measures of persistent absence which aimed to account for the impact of pupils taking time off with COVID, namely:
- Increasing the threshold for persistent absence to 20% of sessions missed
- Discounting up to 10 days of every pupil’s longest spell of absence
- A hybrid method based on long-term absence and repeated spells of absence
For Autumn Term, these methods produced figures of 7 to 9% for primary and 12% to 19% for secondary. Much lower than the figures of 25% and 34% respectively produced by the existing persistent absence measure, and not too far from pre-pandemic levels either.
Now that we’ve got an extra term of data, let’s see if things have changed.
Aspire Attendance Tracker
Schools can track, analyse and compare their attendance data against 1,000s of other FFT schools using Aspire Attendance Tracker.
Log in to Aspire to access Attendance Tracker – log in here.
Not an FFT Aspire user? Learn more here.
What do we mean by a spell of absence?
A pupil has a “spell” of absence when they miss school for any reason[1]. The spell starts on their first day off and ends when they’re next marked as present. Weekends and other non-school days are ignored.
For example, a pupil who misses Friday morning because they’re ill, Friday afternoon because they’re at the doctor, and is only well enough to return on Wednesday morning will have recorded one spell of absence lasting three days (or six sessions – morning and afternoon registration on each day).
The data we’ll use in this post comes from the 2,800 secondary and 7,000 primary schools subscribed to Attendance Tracker and covers Autumn and Spring Terms of 2021/22.
Typical length of a spell
Below, we plot spells of absence by their length. We show the distribution among primary and secondary pupils, and separately for those in Year 11.

We see that 50% of absence spells at both primary and secondary lasted a day or two (two to four registration sessions). Among Year 11 pupils, the range is slightly wider, with 50% of spells lasting between half a day and two days. At primary, secondary and in Year 11, the median length of a spell was one day (note, in the chart, the median and lower quartile lines overlap for the primary and secondary boxplots).
We’ve chosen not to show outliers on this chart as the data contains a small number of very long spells of absence. Beyond the end of the “whiskers” on the plot, and therefore not shown are: 15% of spells for primary pupils, 12% for secondary and 8% for Year 11.
Numbers of spells
Below we plot the cumulative distribution of pupils by the number of spells of absence they had (for example, the percentage of pupils with up to two absence spells, up to three, etc.)
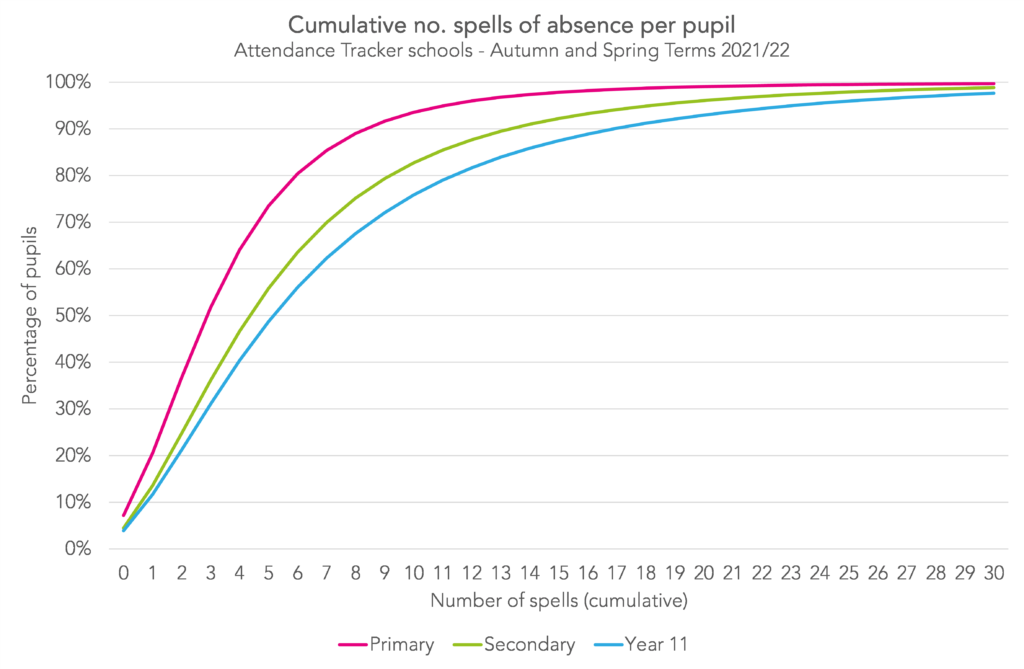
Some pupils had no spells of absence – 7% of primary pupils, and around 4% of secondary and Year 11 pupils. The median number of spells was three at primary, five at secondary, and six at Year 11. The 10% of pupils with the most spells had at least nine spells at primary, rising to at least 14 spells at secondary, and 17 at Year 11.
Since we’re interested in persistent absence, let’s split this plot by whether pupils are classed as persistent absentees or not (using the threshold of at least 10% of sessions missed.
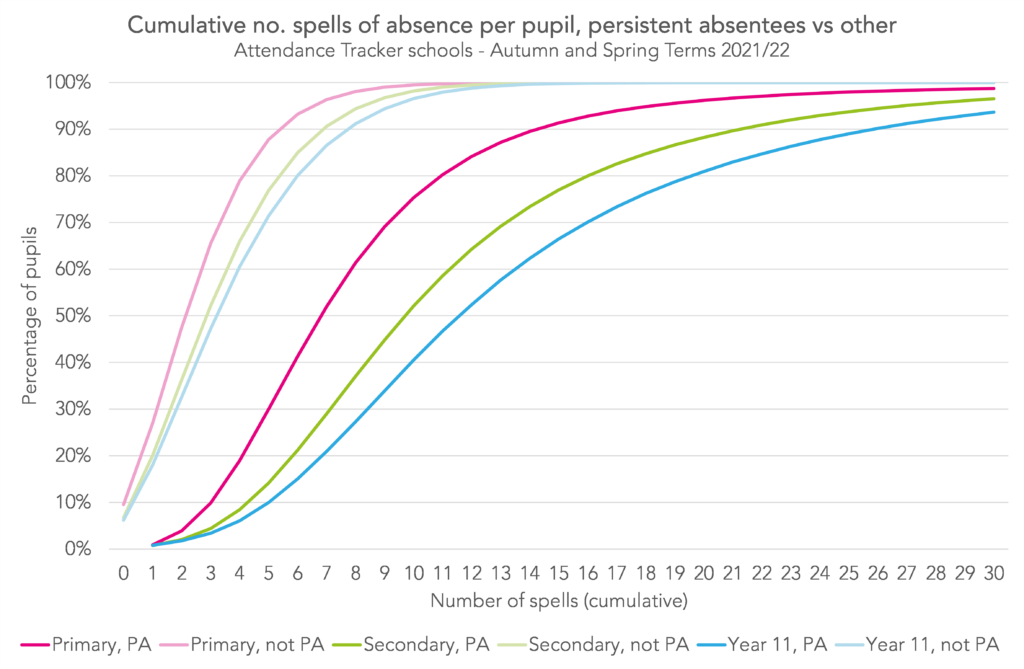
As expected, persistent absentees had more spells of absence than other pupils. Among persistent absentees, the median number of spells of absence was 7 at primary, 10 at secondary and 12 at Year 11 (compared with 3, 5 and 6, respectively, among non-persistent absentees.) The 10% of persistent absentees with the most spells had at least 14 at primary, 21 at secondary and 25 at Year 11.
Alternative measure 1: raising the threshold to 20% of sessions missed
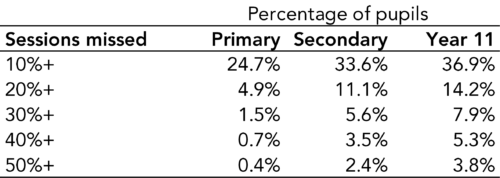
The table above show the percentage of pupils who missed at least 10%, 20%, …, 50% of sessions in Autumn and Spring terms combined.
Raising the threshold for a pupil to be classed as persistently absent to at least 20% of sessions missed would produce persistent absence rates of 4.9%, 11.1% and 14.2% for primary, secondary, and Year 11 pupils, respectively. These figures are slightly lower than those we calculated in Autumn.
Alternative measure 2: one spell discounted
The second of our alternative measures of persistent absence discounts the first 10 days of each pupil’s longest spell of absence. We don’t try to separate out whether those 10 days are recorded in registers as being missed due to COVID. Partly because the attendance codes designed for this purpose aren’t well used, and partly because there’s a lot of variation between different schools’ attendance reporting habits.
Let’s look at the results.

Rates of persistent absence do drop considerably – from 24.7% to 12.1% at primary, and from 33.6% to 20.8% at secondary. However, particularly at secondary, they’re still some way above pre-pandemic (primary is typically around 9% and secondary around 13%[2]).
This is in contrast to when we ran this in the Autumn – then, persistent absence rates dropped to 8% and 15% for primary and secondary, respectively.
Alternative measure 3: hybrid method
Finally, with the hybrid method, we take a different approach. We include pupils who are long-term absent and those who have a large number of spells of absence. So while the previous measure tried to remove the direct influence of COVID, this one is designed to be less sensitive to it.
As we did in Autumn, we define “long-term absent” pupils as those who had one spell of absence lasting at least 40 sessions – the equivalent of four full weeks off school. We take a similar approach to defining “a large number of spells of absence” as in Autumn – but we double the number of sessions, to reflect that we’re using two terms of data rather than one. Here are the results:
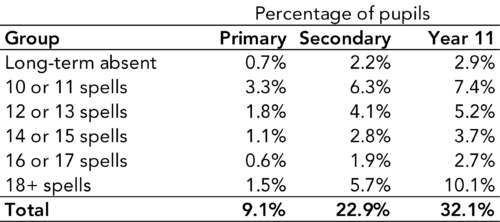
Under this method, persistent absence would reduce to 9.1%, 22.9% and 32.1% among primary, secondary, and Year 11 pupils, respectively. In Autumn, the figures were 9.3%, 19.8% and 24.9%.
Summing up
Across Autumn and Spring Terms this year, around 25% of primary and 34% of secondary pupils were persistently absent using the traditional threshold of at least 10% of sessions missed.
Discounting up to 10 days of each pupil’s longest spell, persistent absence reduces to 12.1% at primary and 20.8% at secondary.
And under the hybrid method – a mixture of long-term and frequent absentees – it reduces to 9.1% at primary and 22.9% at secondary.
We might have expected pupils taking time off because they’d tested positive for COVID to be the driving factor behind high rates of persistent absence. But if that were the case, we’d expect the adjusted rate with 10 days of pupils’ longest spell of absence discounted to be reasonably close to pre-pandemic rates. For secondary, the fact that it remains so much higher is a concern. Perhaps this could be explained by reinfections. Or perhaps there are other factors at play.
Want to stay up-to-date with the latest research from FFT Education Datalab? Sign up to Datalab’s mailing list to get notifications about new blogposts, or to receive the team’s half-termly newsletter.
[1] As usual, we’re including sessions missed for “X-coded” COVID isolation
[2] https://www.gov.uk/government/statistics/pupil-absence-in-schools-in-england-autumn-2018-and-spring-2019


Leave A Comment