Aspire Attendance Tracker
Schools can track, analyse and compare their attendance data against 1,000s of other FFT schools using Aspire Attendance Tracker.
Log in to Aspire to access Attendance Tracker – log in here.
Not an FFT Aspire user? Learn more here.
Back in December we had a look at persistent absence.
Unsurprisingly in the midst of a global pandemic, the percentage of pupils classified as persistent absentees (an absence rate of 10% or above) in primary and secondary schools had more than doubled compared to 2019.
We offered a few thoughts about how persistent absence could be redefined to reflect the current times. This involved a) using thresholds higher than 10% and b) making changes to which types of absence to include.
In this blogpost we extend this work by examining the number of spells of absence pupils had in the Autumn term 2021.
Spells of absence
A spell of absence is a continuous period of time during which pupils were absent from school for any reason.
A simple example would be a pupil having a single day off school. This would be a single spell with a duration of two sessions (morning and afternoon registration on the day of absence).
A slightly more complicated example is a pupil who was continuously off from Monday 8th November to Tuesday 16th November inclusive. This is again a single spell of absence with a duration of 14 sessions. The weekend is ignored.
However, if a pupil was dual-registered and due to spend Thursday and Friday at another school, we would ignore those days in the calculation. We would still identify a single spell of absence but with a duration of ten sessions.
The boxplot below summarises the distribution of spell durations, measured in numbers of absent sessions.
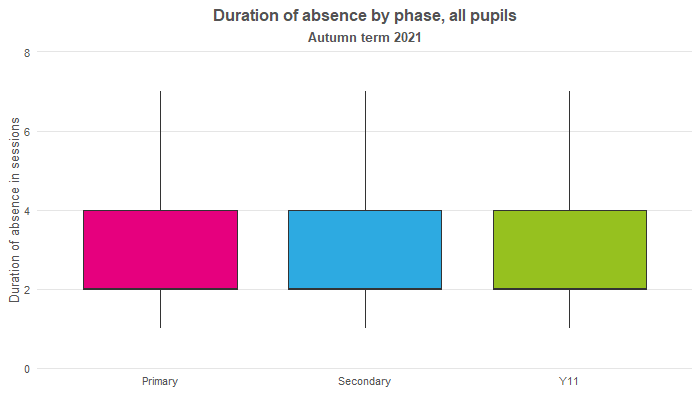
Half of absence spells are between 2 and 4 sessions long (1 to 2 days). This is the same in both primary and secondary phases and among Year 11 pupils.
We have truncated the vertical axis in the chart above. 12% of spells in the primary phase and 13% of spells in the secondary phase (including Year 11) last for more than 7 sessions.
How many spells of absence did pupils have?
The chart below shows the cumulative distribution of spells of absence in the Autumn term separately for a) primary schools b) secondary schools and c) Year 11 pupils. We only include pupils on roll at their schools for at least 12 weeks in the Autumn term.

21% of primary age and 15% of secondary age pupils (and 13% of Year 11 pupils) had no spells at all. The median number of absence spells was two (although three among Year 11 pupils).
11% of primary age and 21% of secondary age pupils had five or more spells of absence. 6% of Year 11 pupils had ten or more spells.
How many spells of absence did persistent absentees have?
Below I repeat the cumulative frequency chart for pupils who missed 10% or more of sessions. By definition they all have at least one spell.

Among persistent absentees, the median number of absence spells is four among primary age pupils and five among secondary age pupils although three is the modal number for both. 36% of primary age pupils and 52% of secondary age pupils had five or more absence spells.
Redefining persistent absence 1: one spell discounted
Now let’s think about alternative measures of persistent absence.
Some pupils will have missed school due to either catching COVID or having to isolate pending a test result.
We therefore produce a version of a persistent absence measure that tries to give some allowance for COVID. We do this by identifying a pupil’s longest spell of absence (for any reason). We discount the first ten days of this spell in the calculation of persistent absence.
We have included all types of absence, not just those related to COVID illness (attendance code I02) or isolation (attendance code X) largely because the former is barely used. Most pupils with COVID are marked as code I (illness). In addition, absence reasons for some spells towards the end of term may not yet have been established. However, a version of this method using just illness and isolation codes could be produced.
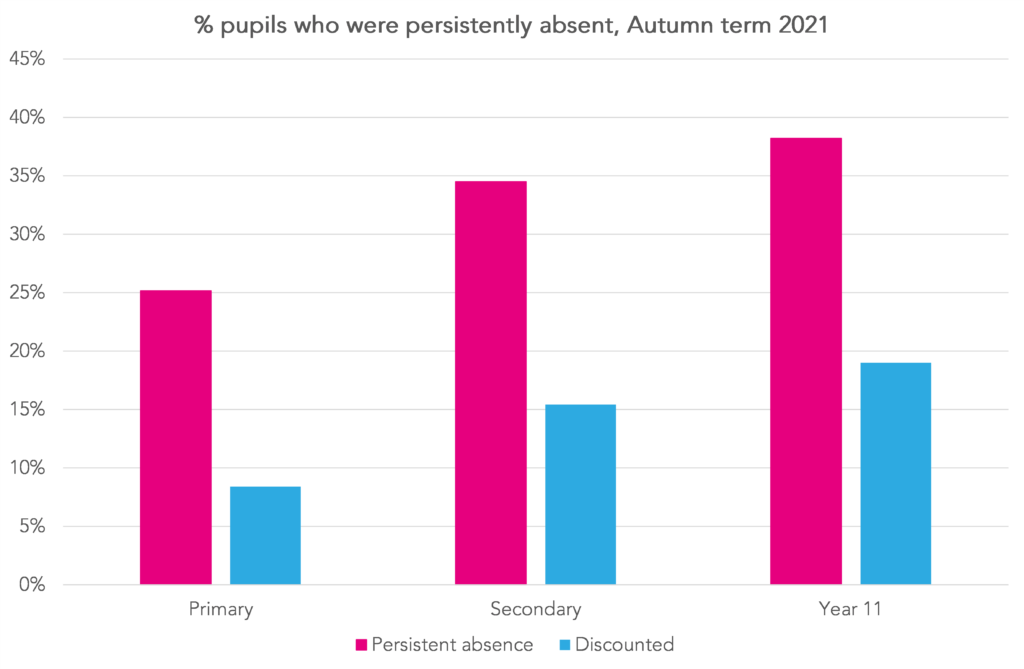
In secondary schools, 34% of pupils missed at least 10% of sessions in the Autumn term. However, this falls to 15% using the discounted method. Equivalent figures for Year 11 pupils were 38% and 19% respectively.
In primary schools, 25% of pupils missed at least 10% of sessions in the Autumn term. This falls to 8% using the discounted method.
Redefining persistent absence 2: hybrid method
For this version of a persistent absence measure we use a hybrid of number of absent sessions and number of absent spells.
This measure is somewhat different to other persistent absence measures in that it identifies pupils who are a) long-term absentees and b) repeatedly absent.
Firstly, we classify pupils with a single spell of absence of 40 sessions or more as long-term absent.
These pupils are relatively small in number: 0.3% of primary age pupils and 1.0% of secondary age pupils. Scaled up to the national population these proportions would equate to around 10,000 pupils and 30,000 pupils respectively.
Secondly, we identify pupils who are repeatedly absent. These are pupils with at least five spells of absence during the term.
What this means is that pupils who may have missed, for example, more than 10% of sessions but spread across fewer than four spells are not included in this measure.
The table below shows the percentage of pupils who would be classified as persistently absent based on long-term absence or repeated spells.

Under this method, 9% of pupils in primary schools and 20% of pupils in secondary schools would be classified as persistent absentees.
Summing up
Clearly COVID has affected school absence.
Plenty of attention is given to school absence rates from week to week and how many pupils are off at any given time due to COVID.
But less attention is given to how much school some pupils are missing. However, this requires good data on absence that takes into account the effects of COVID.
In this blogpost and a previous post we have looked at different ways of identifying pupils who have missed a lot of school for reasons other than being ill with COVID or due to isolating pending a test result.
These methods are
- Increasing the threshold for persistent absence to 20%
- Discounting up to 10 days of every pupil’s first absence spell
- A hybrid method based on long-term absence and repeated spells of absence
The results of these methods range from 7% to 9% for primary schools and from 12% to 19% secondary schools. Much lower than the figures of 25% and 34% respectively compared to the existing definition based on pupils missing at least 10% of sessions.
Want to stay up-to-date with the latest research from FFT Education Datalab? Sign up to Datalab’s mailing list to get notifications about new blogposts, or to receive the team’s half-termly newsletter.


Leave A Comment