Today sees the release of the first set of A level results awarded by public examination since before the start of the pandemic. Both JCQ and Ofqual have produced high-level national statistics summarising attainment overall and in different subjects.
In this post, we pick out some key highlights from the published statistics. More thorough analysis will emerge as more data becomes available.
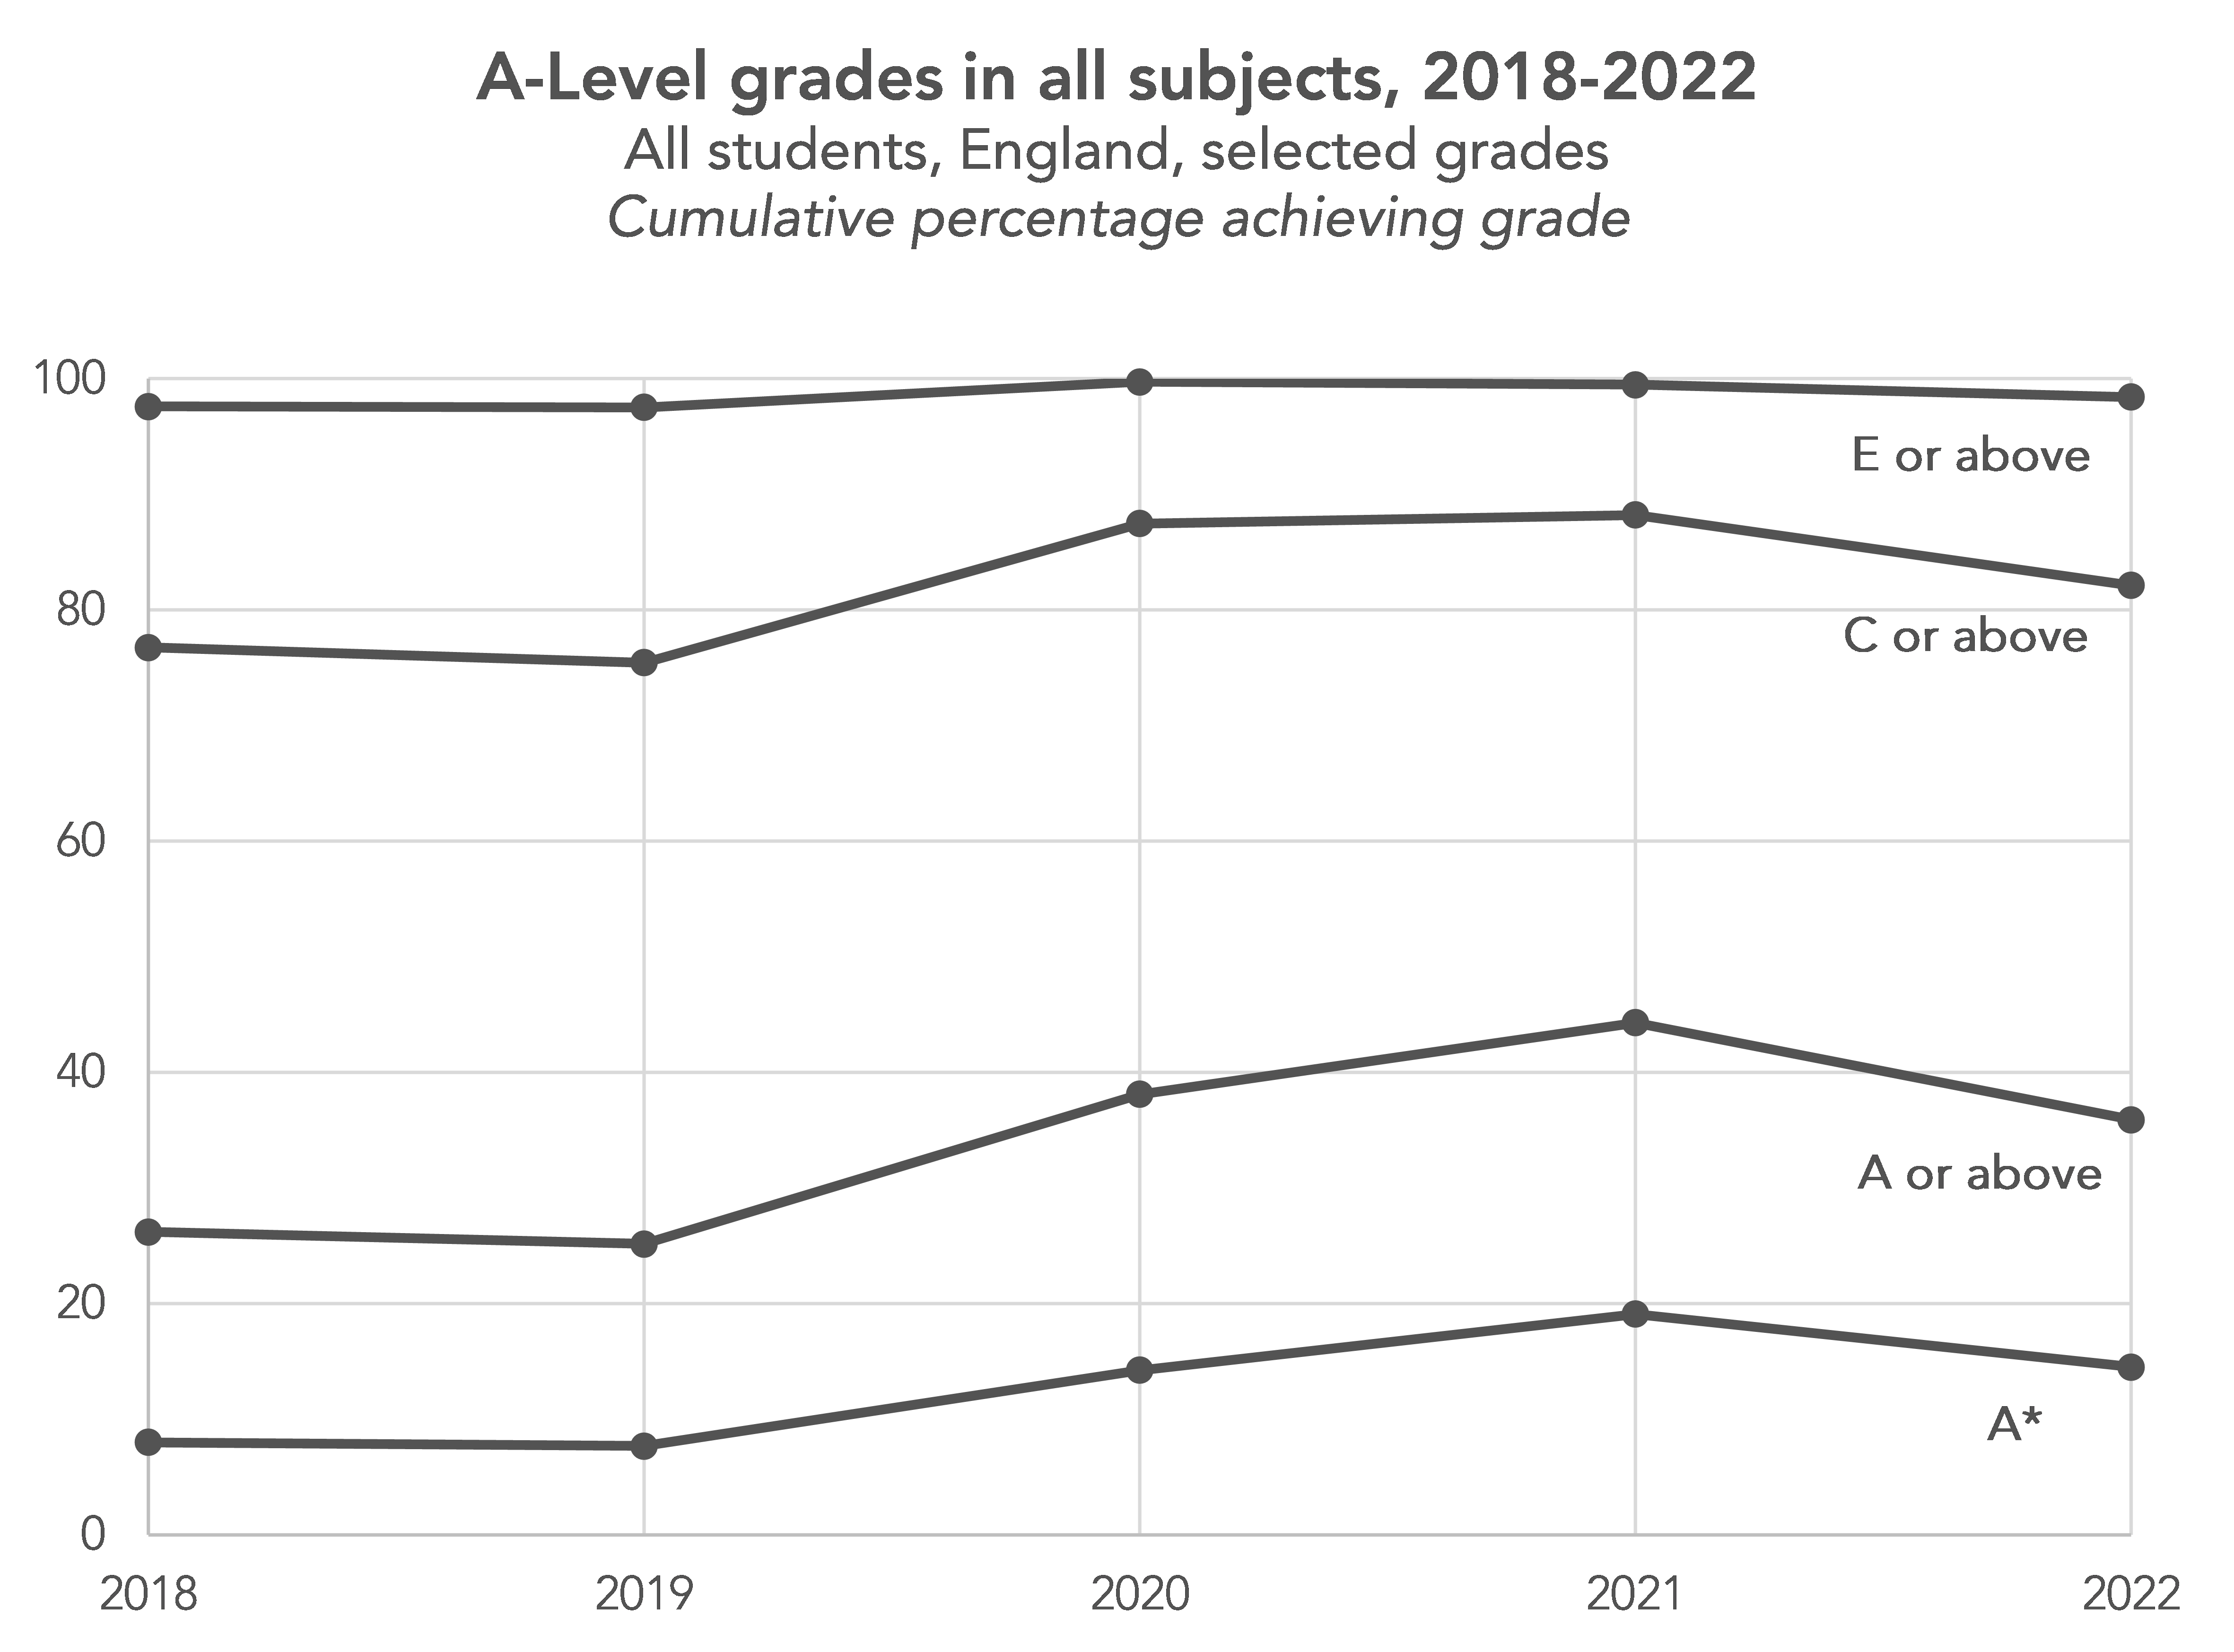
Grades have started to be brought in line with those from 2019
Ofqual planned to start to bring grades more in line with those from 2019, the last time exams were sat. Unsurprisingly, this is exactly what has happened.
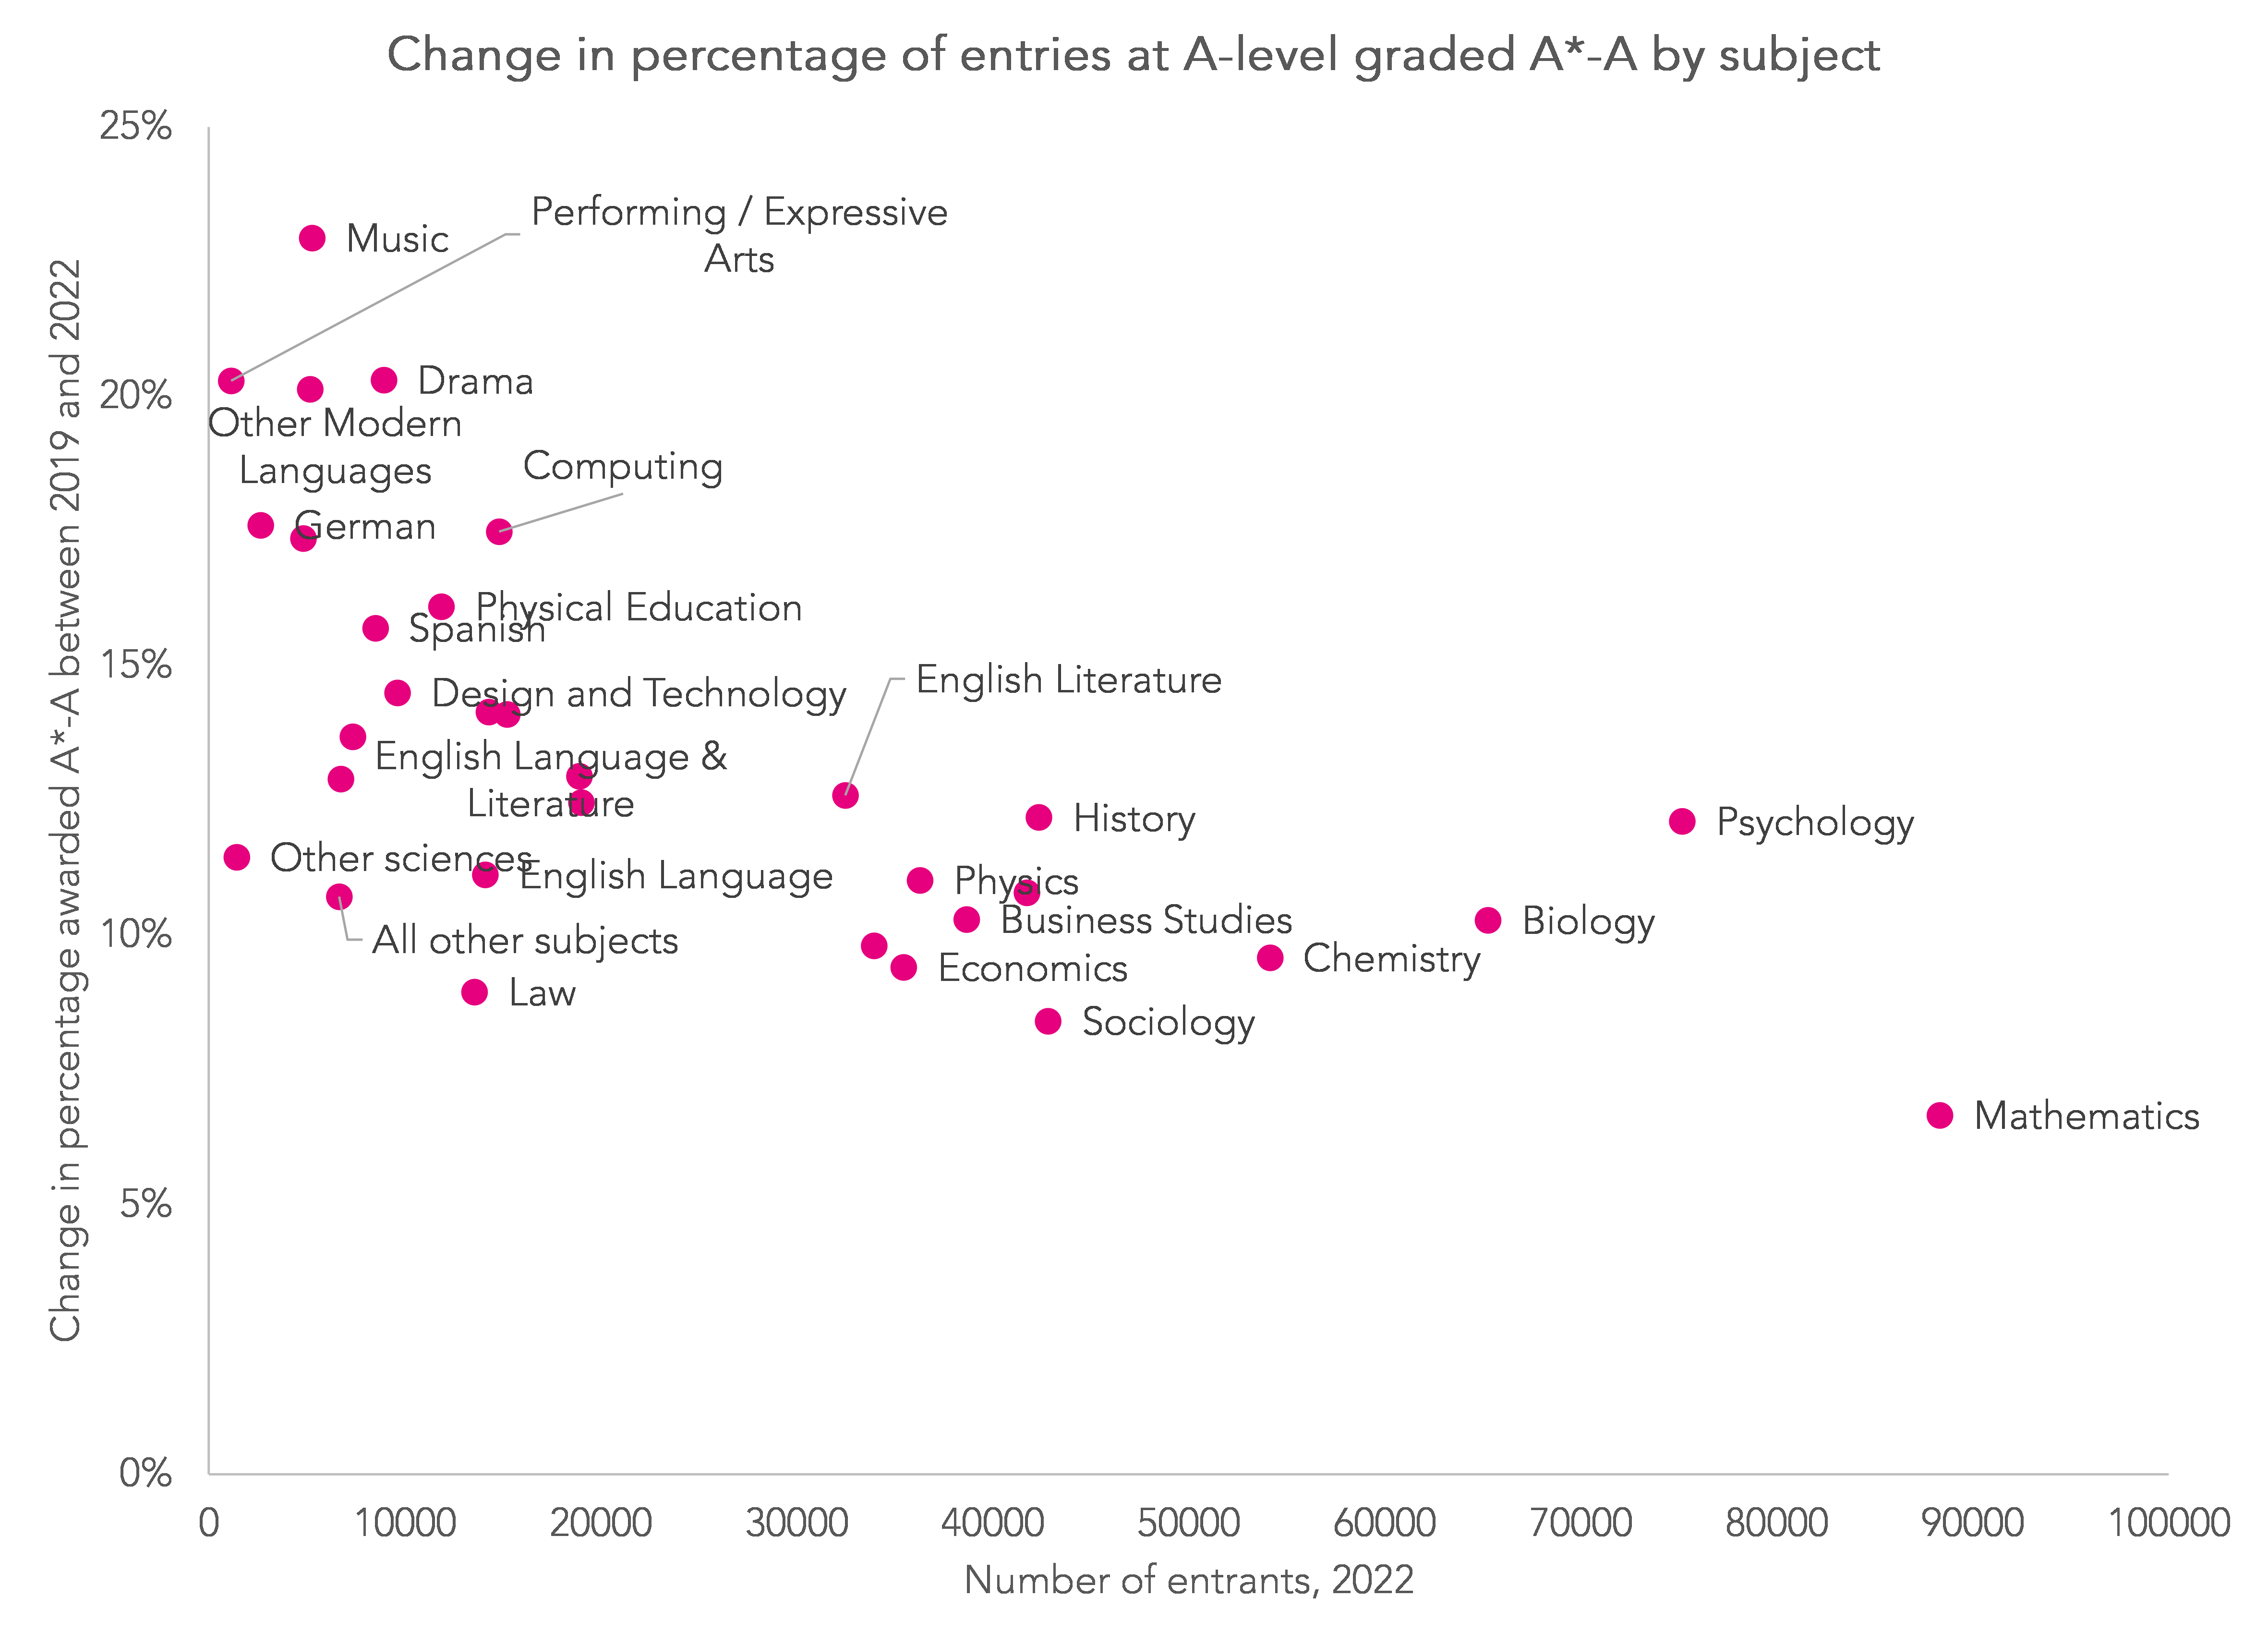
In almost all subjects, A*-A awards are above the midpoint between 2019 and 2021
In almost all cases, the percentage of entries graded A*-A in 2022 is above the midpoint of the percentages for 2019 and 2021. Exceptions were biology, chemistry and maths but these were only very slightly lower than the midpoint.

As a result, the percentage of entries graded A*-A in some subjects in 2022 remains far higher than in 2019. This includes subjects with small numbers of entries such as music and performing arts. We might expect subjects with smaller numbers of entrants to be more susceptible to changes in the prior attainment profile of students from year to year.
However, this might mean that these students taking these subjects next year might face tougher grading than those years if Ofqual continues with its plan to bring 2023 grades in line with 2019.
The chart below allows you to explore how the grade distribution has changed from 2019 – 2022 for all of the subjects for which data is available.
Entry numbers have increased, but not in every subject
Entry numbers are up overall, from just over 750,000 last year to nearly 780,000, but some subjects have seen their entry numbers fall.
This includes several STEM subjects, in which entries have been on the increase over the last few years: entries in physics, chemistry, maths, further maths and other science subjects are all down. But entries in biology and computing have increased.

Entries to English, including English literature, English language and English literature and language are all down. English literature, which last year was the tenth most popular A-Level subject, has this year lost its place in the top ten.
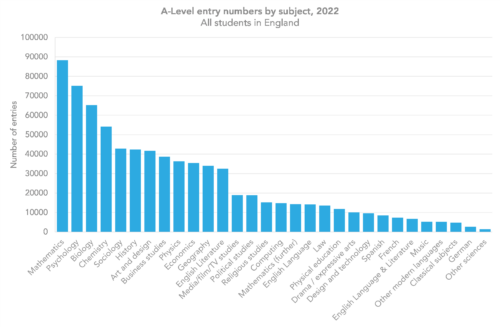
Other subjects that have seen falls in entries include religious studies and French.
Meanwhile, some subjects have seen particularly sharp increases, including geography, which also had a sharp increase last year, art and design and psychology.
You can explore the trends in entries from 2001 right up until this year in more detail here.
The gap between independent schools and state selective schools has begun to return to pre-pandemic levels
The arrangements for awarding GCSEs and A levels in 2020 and 2021 saw the gap in attainment between independent schools and state schools widen as we’ve written about previously (see here and here).
The return to exams has seen this gap close. The difference in entries graded A*-A between independent schools and state selective schools has returned to around 8 percentage points having reached almost 14 percentage points in 2021.
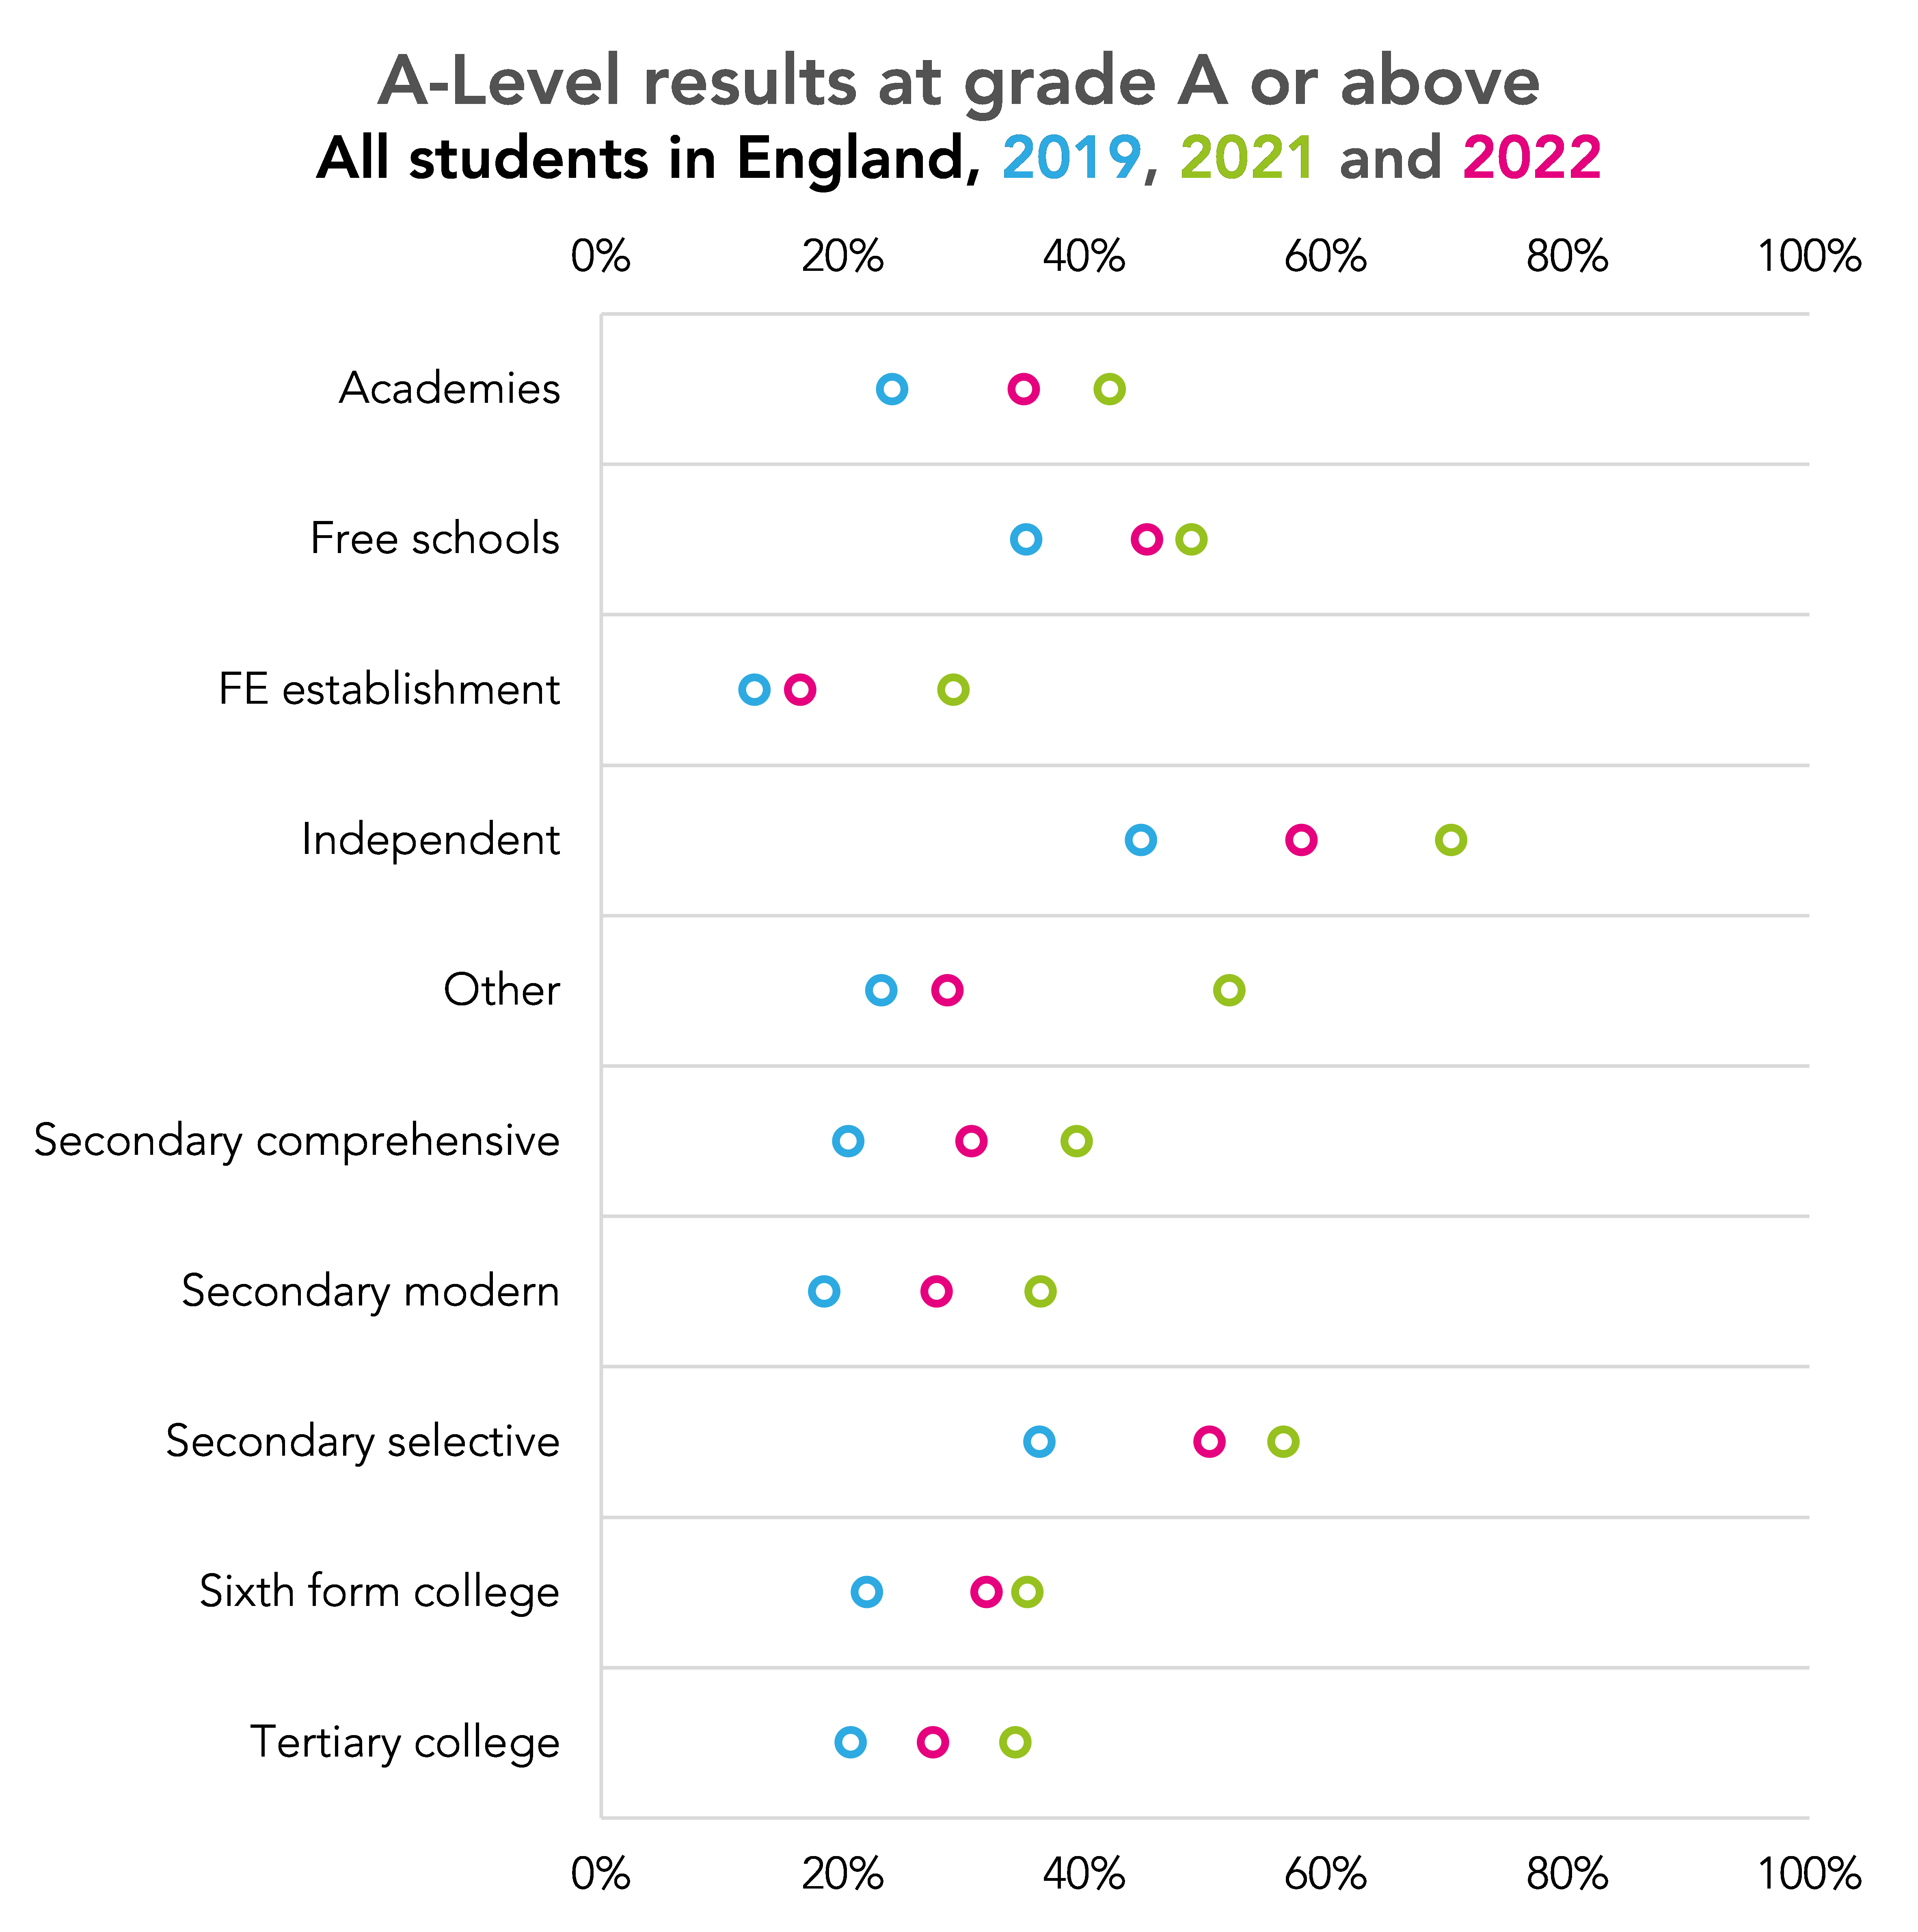
That said, Ofqual only appear to have counted 76 secondary selective schools in their figures. There are 143 wholly selective schools in England, which suggests that the remainder have been classified as academies.
But a gender gap remains
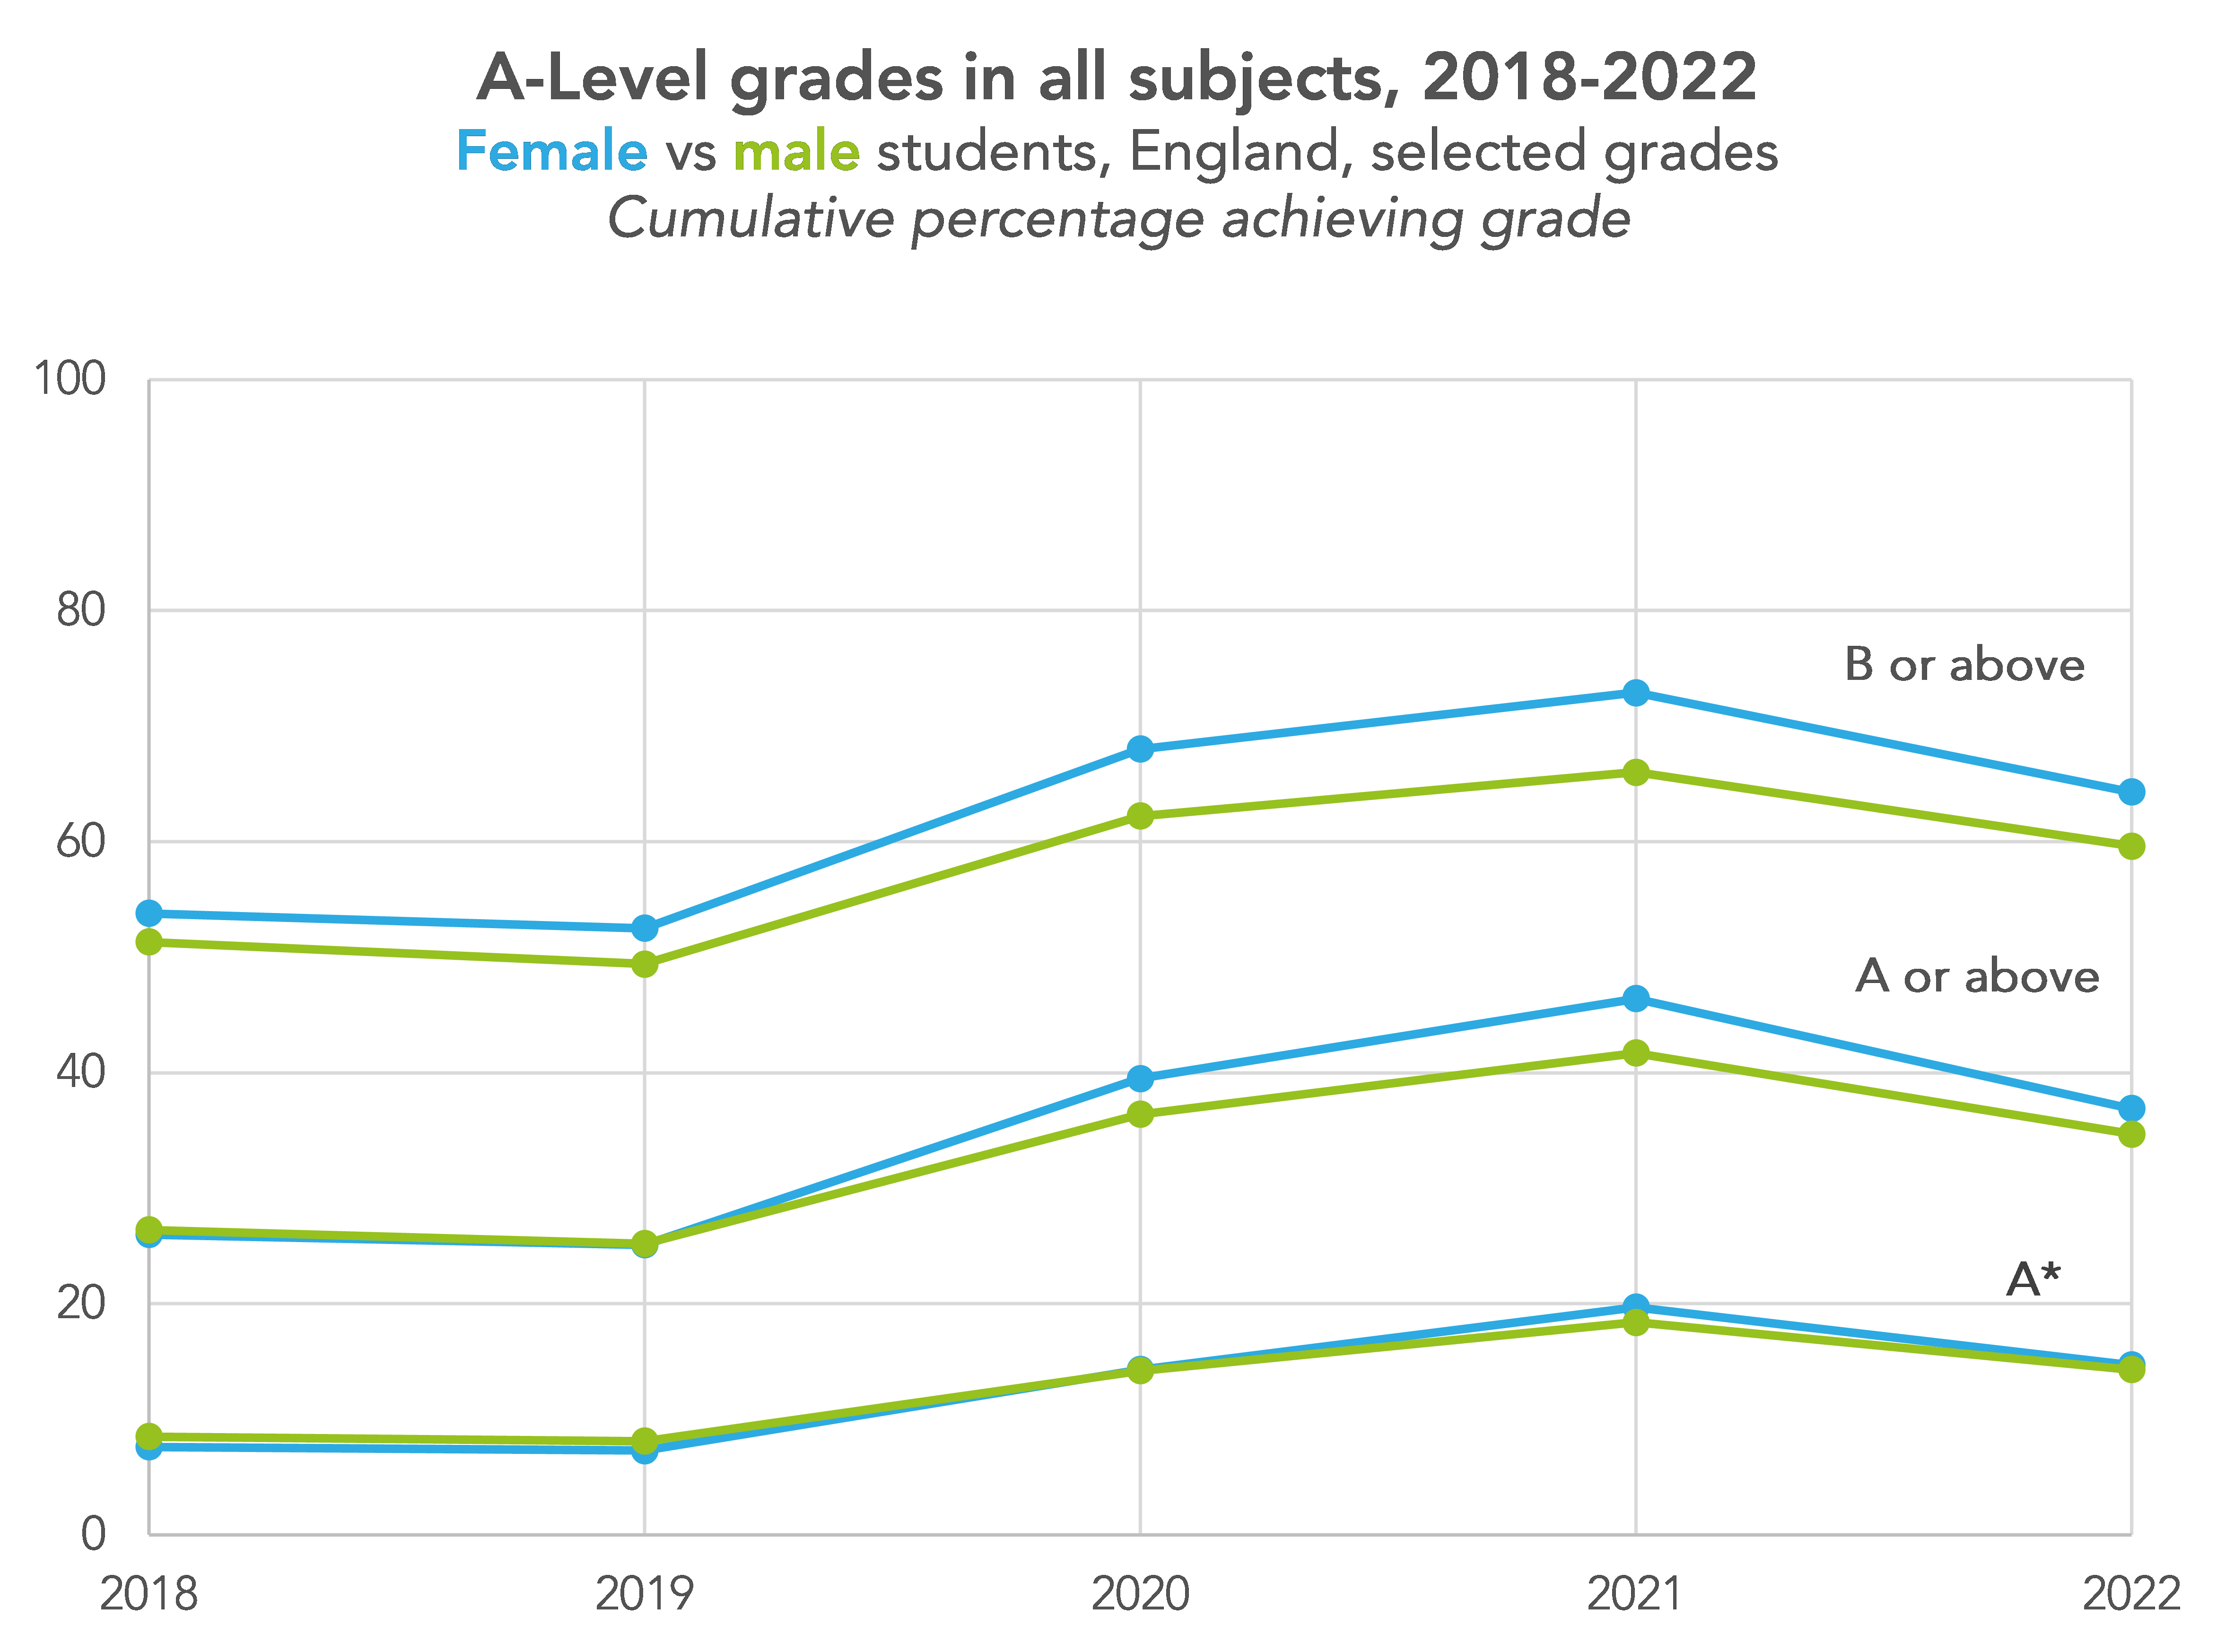
In 2018 and 2019, male and female students tended to achieve around the same percentage of A*-A grades. Female students have long tended to achieve a higher percentage of A*-B grades. And male students tended to achieve more A* grades.
In 2020 and 2021, female students achieved more A*-A grades than male students, and increased the gap at A*-B. They also achieved more A* grades. With the return of exams, we might have expected these gaps to close. But they haven’t (although they have narrowed since last year).
Has COVID-19 widened existing differences between regions?
The percentage of grades awarded A*-A increased by a greater margin in London than any other region between 2019 and 2022 as shown in a visualisation produced by Ofqual.

This does raise the question - which we’re unable to answer at the moment - about whether some regions have been disproportionately affected by COVID-19 over the last three academic years. Our analysis of attendance data for Year 11 pupils has shown that attendance in London has tended to be higher than in other regions for the majority of the pandemic so far.
Results in Wales have increased by a greater margin since 2019 compared to England and Northern Ireland
Finally, a quick look across all subjects by country.
For this chart, we have converted grades into points[1].

This shows that the average point score in Wales in 2022 stood at 40.2 up from 35.3 in 2019, an increase of 4.9 points. By comparison, the increase for both England and Northern Ireland was 3.9 points.
Some of this may be explained by differences in subjects entered between countries. But even in the most popular subject, mathematics, the difference in Wales between 2019 and 2022 was 4.9 points compared to 3.5 points in Northern Ireland and 2.4 points in England.
- A*=60; A=50; B=40; C=30; D=20; E=10; U=0.
Want to stay up-to-date with the latest research from FFT Education Datalab? Sign up to Datalab’s mailing list to get notifications about new blogposts, or to receive the team’s half-termly newsletter.


That is quite a drop in A or above in Independents and others…
Yes, one wonders why
Yes, because they bagged ridiculous grades in 2021! Same happened in 2020, it would be interesting to see the 2020 figures on the chart, but there is a good level of clarity from only showing 3 years. It looks like independents and grammars have done better out of the generous grades than others.
Hi, any idea on the APS this year?
Hi Phil. Do you mean in each subject or for the total APS (or best 3 APS) per student?
Hi Dave, I’m after the national APS (A – level) figure, the one that you get on your main fft aspire dashboard.
A rough answer (based on the published JCQ stats) is 38.7 in 2022, up from 34.7 in 2019. Note that this isn’t the figure that will appear in Aspire. This will be based on students in state funded schools and colleges only (when we receive the underlying pupil-level data later in ther term).
A student question: What programming language and libraries do you use to create those nice visualizations? Do you have a Github account with source code for studying, books, training materials?
Hi Gosia. For the images we mostly use R or Excel and we use Highcharts to create the interactives. We do have some source code available on GitHub (although it could probably do with updating) and I’d also recommend this site for ideas and tips on visualisations using R and this for Highcharts.
Hi Dave – thank you for this its really fascinating. Can you just clarify for me please why there are two East Midlands on the Covid19/A*s?A graph just above? I know I am located in one of them! Many thanks.
Oops. One should say “East”. Now fixed. Thanks for spotting.
Is Ofqual’s claim that this year, as in normal years, there is no quota for each grade, how did the exam boards set the grade boundaries to achieve this year’s grade profile? Furthermore, how do the set the grade boundaries in normal years to achieve similar grade profiles from year to year?
Hi Huy. That sounds a bit strange to me given they were clear that grades would be set between 2019 and 2021. Where have you seen it written?
Hi Dave,
Dr Jo Saxton said it here: https://www.gov.uk/government/speeches/dr-jo-saxton-at-confederation-of-school-trusts-annual-conference ,
“I must be clear; whilst these will be the most generously graded exams ever; nevertheless the approach means that overall, 2022 results are likely to be higher than in 2019, when summer grades were last determined by exams, but lower than we saw in 2021. This means that your schools are highly likely to find their results are lower than in 2021 when exams did not go ahead. Schools that get higher results than in 2021 will be few and far between, if any.
Another thing I want to make absolutely clear, is that there is no quota of students of students that get a particular grade. This is a persistent and troubling myth about grading, and about comparable outcomes, and I would like your support in helping quash it when you hear others suggest that is the case.”
Perhaps I misunderstood her?
Thanks Huy. I see what you mean. Perhaps she was talking in general terms? For this year there might not have been a precise quota but there was a definite minimum (2019) and a definite maximum (2021) in the cumulative percentage at each grade (or at least at the anchor grades of 1, 4 and 7).
It seems that in other exam years there must be a rough quota system which is designed to make the grade distribution similar to the distribution similar to previous years. The mechanism used is the grade boundaries, but it is fundamentally a quota system.
Indeed. The process they use to try to ensure comparability of grades between years (comparable outcomes) is based on 2 things 1) statistical predictions 2) other evidence. For 1) the assumption is that there are no differences between national cohorts (as a whole) from one year to the next in terms of ability, teaching quality or anything else that might affect results. Some allowance is made for the fact that the prior attainment profile for individual subjects varies from year to year. The statistical predictions give a starting point of quotas for each grade. But in theory these can be increased (or decreased) according to 2) other evidence. This might include the National Reference Test or examiner judgment. So if examiners think (for example) that the quality of work produced by some students provisionally awarded a grade 3 is actually equivalent to the quality of grade 4 in previous years then results could go up. How well this works in practice I don’t know.
Thank you, Dave. I wonder if information about the second step you mentioned is available via FOI requests and can be independently analysed so that the public can know how well it works in practice.
I remember in the 90s, when grades were going up, some people argued that it was because standards were going up. Now grades have been roughly static (except for those affected by COVID measures, including this year’s grades), do we know if that’s because standards have been roughly static or because the second step has not been working very well?
A very good question. I seem to remember once reading a report where Ofqual justified an increase in grades in a particular subject (business studies I think) but I now cannot find it. This has some details of the process they follow https://assets.publishing.service.gov.uk/government/uploads/system/uploads/attachment_data/file/826699/Summer_2019_monitoring_summary_-_FINAL196533.pdf. If the boards produce this evidence then I don’t think it would be FOI-able as they are not covered by FOI. But if Ofqual document their decisions each year then it would be.