Last week’s A-level and GCSE results saw a widening of the attainment gap at grade A and above at A-level and grade 7 and above at GCSE in independent schools compared to state schools.
This gap was shown in Table 16 of Ofqual’s Summer 2021 results analysis and quality assurance report, which we have reproduced as a chart below.
This shows that the percentage of entries in all GCSE subjects from pupils in independent schools increased from 46.6% in 2019 to 61.2% in 2021, and increase of 14.6 percentage points.
Among non-selective state-funded mainstream schools [1], this figure increased from 19.8% to 27.3%, an increase of 7.5 percentage points.
Consequently, the “attainment gap” grew by (14.6 – 7.5)= 7.1 percentage points between 2019 and 2021.
This was despite the JCQ guidance on determining grades this year saying that “It should be no easier or more difficult for a student to achieve a grade this year based on their performance than in previous years.”
One theory put forward to explain this change is that pupils in independent schools are more likely to be bunched at the upper end of the attainment distribution. So if the bar for a grade 7 is lowered, there is likely to be a disproportionate number of pupils at the independent schools who would benefit as a result.
This is undoubtedly true. But does it explain all of the increase in the attainment gap?
Digging into the gap
To test this out, we could go back to the 2019 GCSE exam data. What if we redefined the grade boundaries so that the percentage of entries graded 7 or above was brought in line with 2021?
Unfortunately, we can’t do this as we don’t have the data on exam marks available to us, though the exam boards do.
So instead, we look at the GCSE grades awarded in 2019. We are using DfE school-level data on attainment in individual subjects here. This differs from the data used by Ofqual in their statistical release. For instance, it includes all GCSEs entered during Key Stage 4, not just those entered in the Summer at age 16.
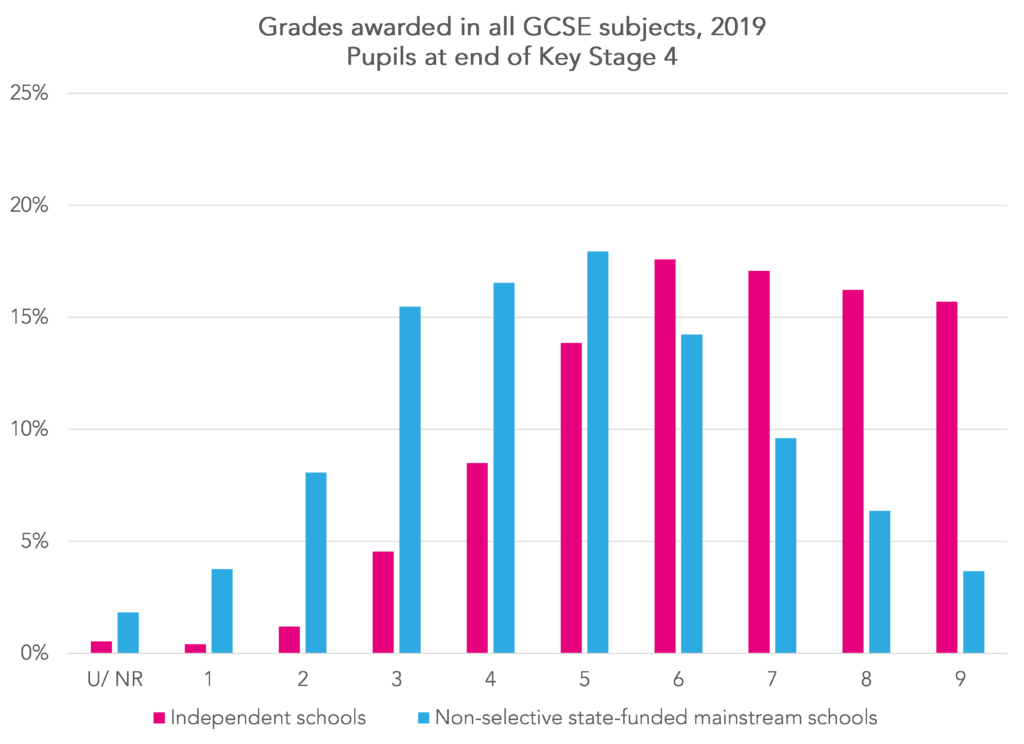
The chart below shows the distribution of grades awarded in 2019 comparing independent schools with non-selective state-funded mainstream schools.
According to this data, 49.0% of entries were graded 7 and above in independent schools compared to 19.6% in non-selective state-funded mainstream schools.
But what if we were to retrospectively award grade 7 to everyone who achieved a grade 6? If we did this, an extra 17.6% of entries from independent schools would be awarded a grade 7 compared to 14.2% at non-selective state-funded mainstream schools and the “attainment gap” would have increased by 3.4 percentage points as a result.
The increase of 7.1 percentage points reported by Ofqual seems large by comparison.
Of course, this illustration is based on awarding grade 7 to everyone who achieved grade 6. If we just awarded grade 7 to the top half of the grade 6 range, then perhaps there would be a differential larger than 3.4 percentage points.
Independent schools vs grammar schools
But there is another comparison we can make.
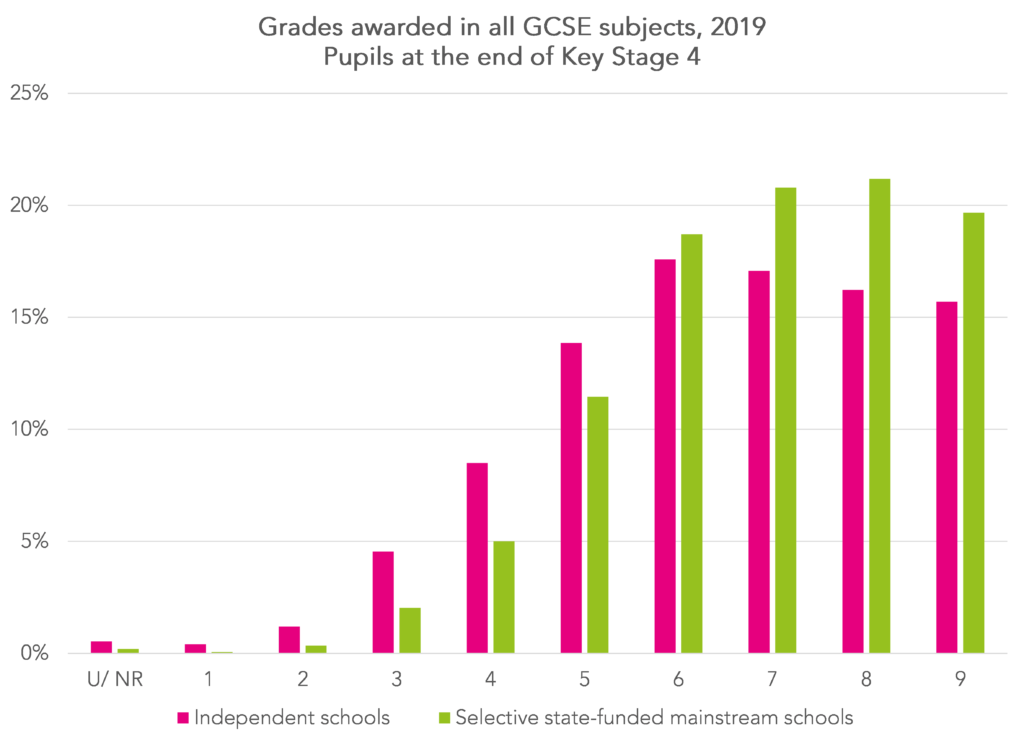
In 2019, attainment at selective state-funded mainstream schools (grammar schools) was even higher than at independent schools. 61.0% of entries were graded 7 or higher.
If the grade 7 boundary had been lowered to the grade 6 boundary in 2019, would we not have seen a larger increase in attainment at grammar schools? The percentage of entries awarded grade 6 at selective state-funded mainstream schools in 2019 was slightly higher than that of independent schools.
Yet according to Ofqual’s analysis [2], attainment increased from 57.9% to 68.4%, an increase of 9.5 percentage points. This again is several percentage points lower than the 14.6 found in independent schools.
So why the difference?
The evidence here is hardly conclusive at best but it does seem to suggest that there is more to the increase in attainment at grade 7 and above in GCSEs at independent schools than just the corollary of independent school pupils tending to be found at the upper end of the attainment distribution.
One theory is that pupils at independent schools suffered less disruption to their learning during the last two years.
However, the arrangements put in place by JCQ tried to take this into account to some extent. They were based on grading pupils on their performance in the subject content they had been taught.
In principle, if a pupil had been taught less content than another, this wouldn’t have mattered in determining grades. Compared to another pupil who had suffered less disruption, they would only be awarded a lower grade if the evidence suggested they had learned the content taught less well.
Perhaps that might explain the increase in the attainment gap. Though given the variety of evidence used within and between centres, this would be a difficult proposition to test.
Either way, it will take more and better data to get to the bottom of it.
- I have combined the results of the following categories: academy, free school, sec comp or middle, secondary modern
- We note that Ofqual’s analysis only includes 85 selective secondary schools. There were 163 in the 2019 Key Stage 4 Performance Tables.
Want to stay up-to-date with the latest research from FFT Education Datalab? Sign up to Datalab’s mailing list to get notifications about new blogposts, or to receive the team’s half-termly newsletter.


Do you have comparative data for alternative provision providers?
Hi Richard. No not yet. It’ll only be when DfE produce their statistical first release in Oct/ Nov that we’ll see results for AP settings.