It’s August. And that can mean only one thing – results season is back!
Of course, when A-Level results were released last Thursday, one specific thing grabbed the headlines – the sharp fall in 2022 grades compared to 2020 and 2021.
This was entirely predictable. And, actually, wasn’t that newsworthy. Ofqual told us that 2022 grades would sit midway between those awarded in 2019 and 2021 almost a year ago.
But what also caught a lot of people’s attention was how the fall in grades differed between different groups and, in particular, different centre types.
For instance, Chris Giles from the FT tweeted the following graph along with the words “guess which type of school fiddled A-level grades when they graded themselves?”.
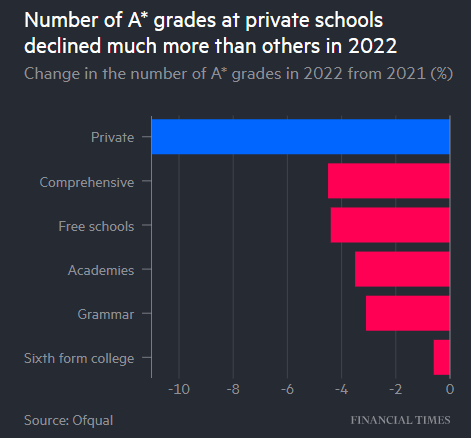
But did A-Level grades really fall by more at independent schools between 2022 and 2021 than in other centres?
Well, it all depends upon how you measure it…….
Absolute change
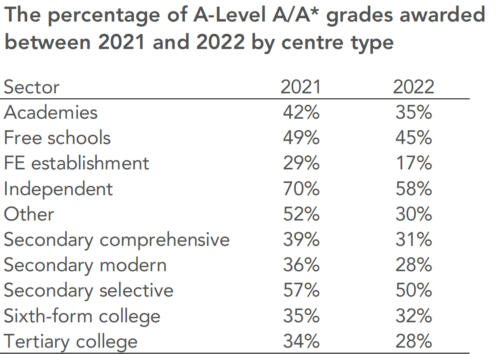
The figures that Chris Giles reported – and which many commentators picked up on – referred to the absolute difference in percentages achieving certain grades in 2022 compared to 2021.
So in Table 1 below – which reports the percent of entrants receiving A/A* grades – one simply takes the difference between the percentage for 2021 and 2022.
The chart below presents a visual representation of this absolute probability difference.
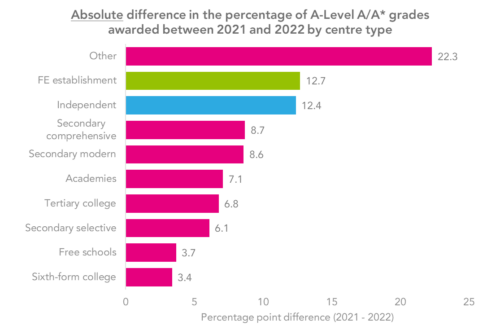
It looks like independent schools (blue bar) are amongst those suffering the greatest declines. Yet there have been sizeable absolute falls elsewhere (e.g. at further education colleges – green bar) as well.
Relative change
However, one can look at the same data a different way. Rather than focusing on the probability difference, one can look at the “relative risk”. Rather than taking the difference between the probabilities for 2021 and 2022 reported in Table 1, we look at the ratio instead.
The chart below illustrates the “relative risk” of getting an A/A* grade in 2021 compared to 2022 by centre type. This gives an idea of how many times more likely students were to receive an A/A* grade in 2022 than 2021.
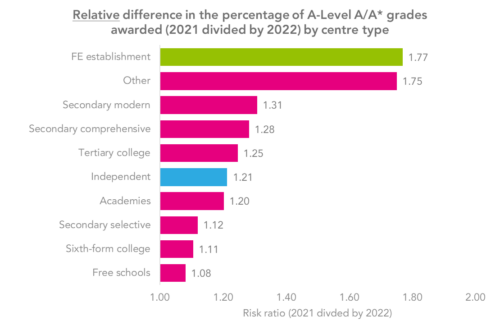
In terms of relative risk, independent schools are somewhat middle of the road. Their students were around 20% more likely to receive an A/A* grade in 2021 than in 2022, but the same is pretty much true for academies, comprehensive schools and secondary moderns.
In fact, it is further education and “other” establishments where the relative change has been greatest; students in such centres were almost 80% more likely to receive an A/A* grade last year than this.
So which measure should we use?
In a nutshell, both!
One can always cut and present data in different ways. And, most of the time, if you torture the data enough, you can probably get it to tell the story you want.
It’s therefore often recommended that both relative and absolute measures are presented when comparing probabilities across groups or timepoints. This gives the most complete – and transparent – picture possible.
So did independent schools “fiddle” the grades more in 2021 than other centres?
Such claims seem a little harsh to me.
Whether the difference in grades between 2021 and 2022 is greater for independent schools than other centre types really does depend on whether one is talking in an absolute or relative sense.
And there does seem to be a reasonable case that further education colleges – which were left off Chris Giles’ chart – saw an even greater decline in A-Level grades between 2022 and 2021 than independent schools.


Under the heading relative change, I wonder if this is the right way round:
“This gives an idea of how many times more likely students were to receive an A/A* grade in 2022 than 2021.”
I think the graph label (and figures) suggests the ratio is 2021 over 2022.
Thanks for another interesting post.
I’m not a statistician but it seems to me that the relative change is not helpful in situations such as this where the denominators are of such different magnitudes. I could turn the argument around… Surely most parents of independent school children would consider the ‘risk’ in this situation to be not achieving A or A* grades. This risk has increased from 30% in 2021 to 42% in 2022 based on the figures quoted – the risk has therefore increased by 40%. (Or 12% points). Comparing with the further education establishments as you have done above the risk of not achieving the top grades grew from 71% to 83% which is only a 17% increase (but still 12% points). Why has the relative risk of not achieving top grades increased so much over one year in the independent sector compared to almost all the other types of establishments?
There may be valid arguments about density of student populations around the A/B grade boundaries in different types of establishments which could possibly explain the changes seen but I don’t think using relative change assists this analysis.