Over the last few years, colleagues at FFT have been developing the Reading Assessment Programme (RAP), a simple online assessment tool to assess pupils on GPC[1] accuracy, decoding accuracy and reading fluency.
Between September 2022 and August 2024, a total of 110,000 pupils from almost 700 schools have completed 340,000+ assessments.
In England, the focus of assessment in reading has largely been on decoding (measured by the Year 1 phonics check) and comprehension (measured in KS1 and KS2 SATs). Our new analysis of RAP data provides some of the first evidence from England about fluency across the primary school years, how this is influenced by a range of demographic factors, and how it relates to reading comprehension.
RAP assessments are entirely optional, and have fluency passages that progress in reading difficulty. Each assessment is designed for a particular year group, and most (but not all) assessments were taken by pupils for which the assessment was designed. More on this can be found in Appendix 1 of the report.
Reading fluency
Fluency is usually measured in terms of the number of words within a passage of text that a child can accurately read aloud in one minute. We take ‘words correct per minute’ (WCPM) as a broad indicator of fluency.
In the chart below, we show median WCPM by year group and term from Year 1 to Year 6.
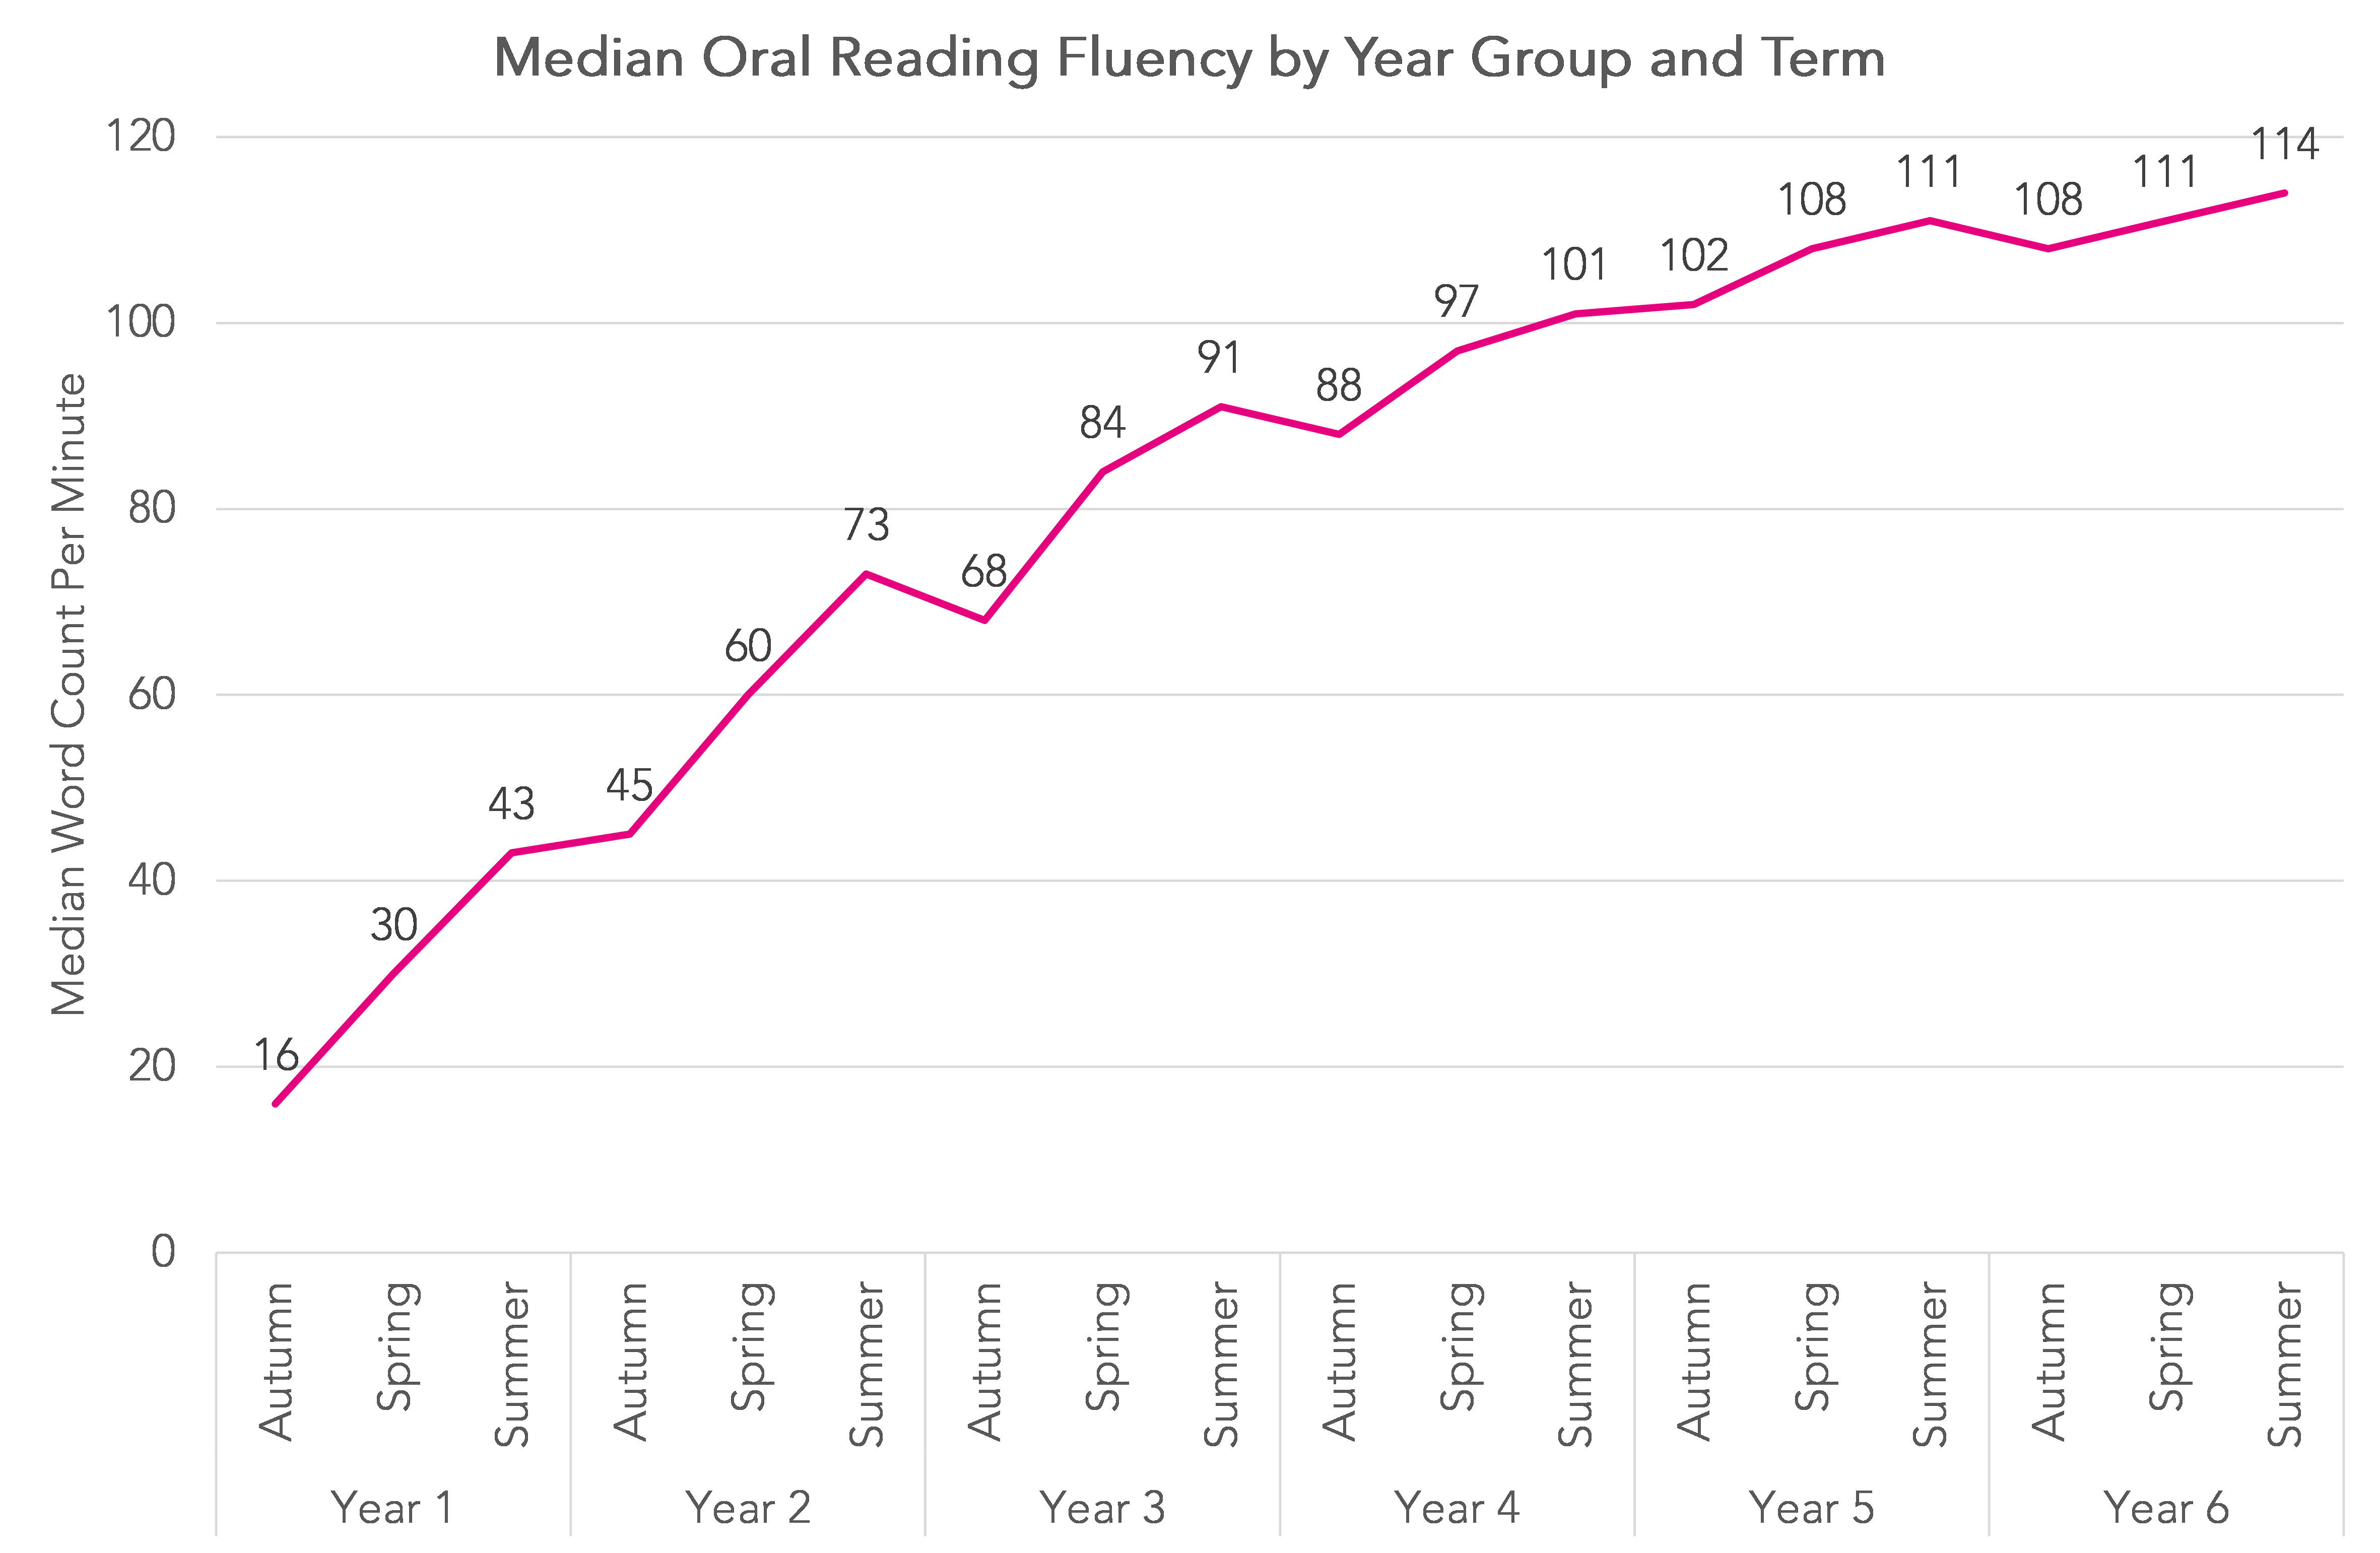
The chart does tend to show how fluency typically increases during Key Stages 1 and 2, from 16 words per minute in Autumn of Year 1 to 114 words per minute in Summer of Year 6. In some (but not all) years, there is a slight dip between Summer and Autumn.
However, within each year group and term we observe a large degree of variation. In the following chart we allocate pupils to quartiles based on word count per minute then show the median score within each quartile.
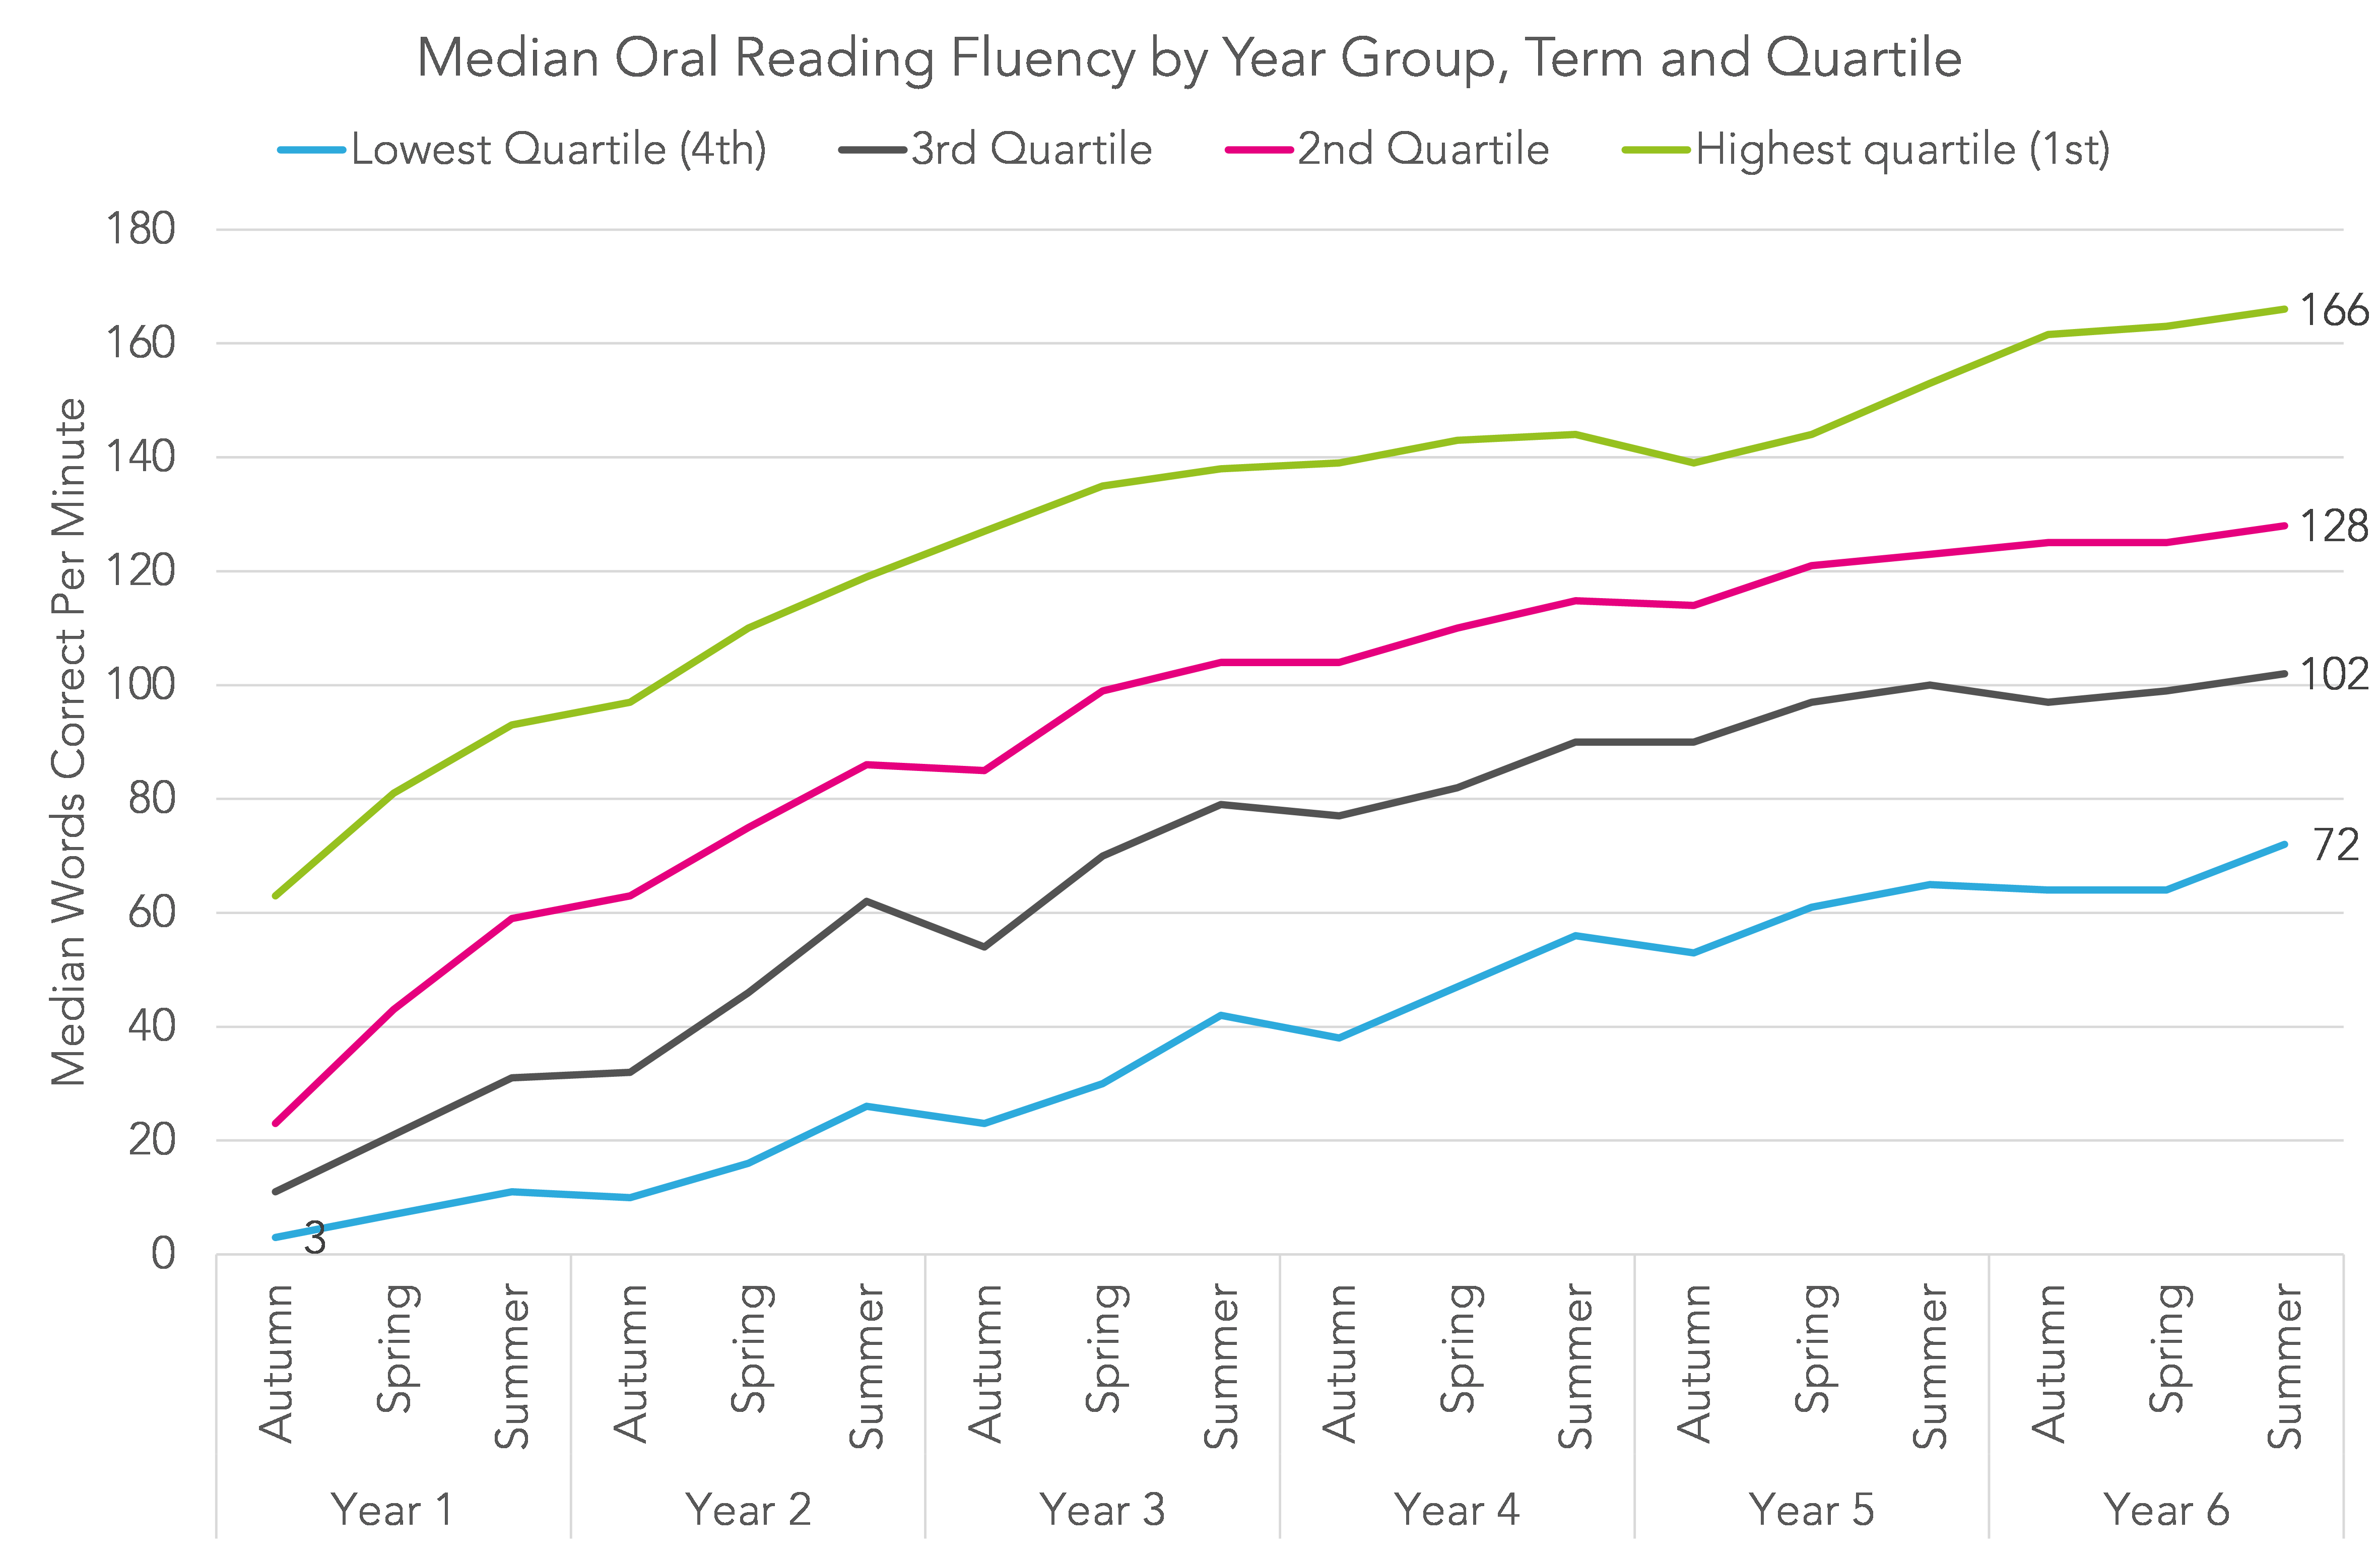
The median of the lowest quartile of readers (25%) read aloud at 72 WCPM by the end of primary school.
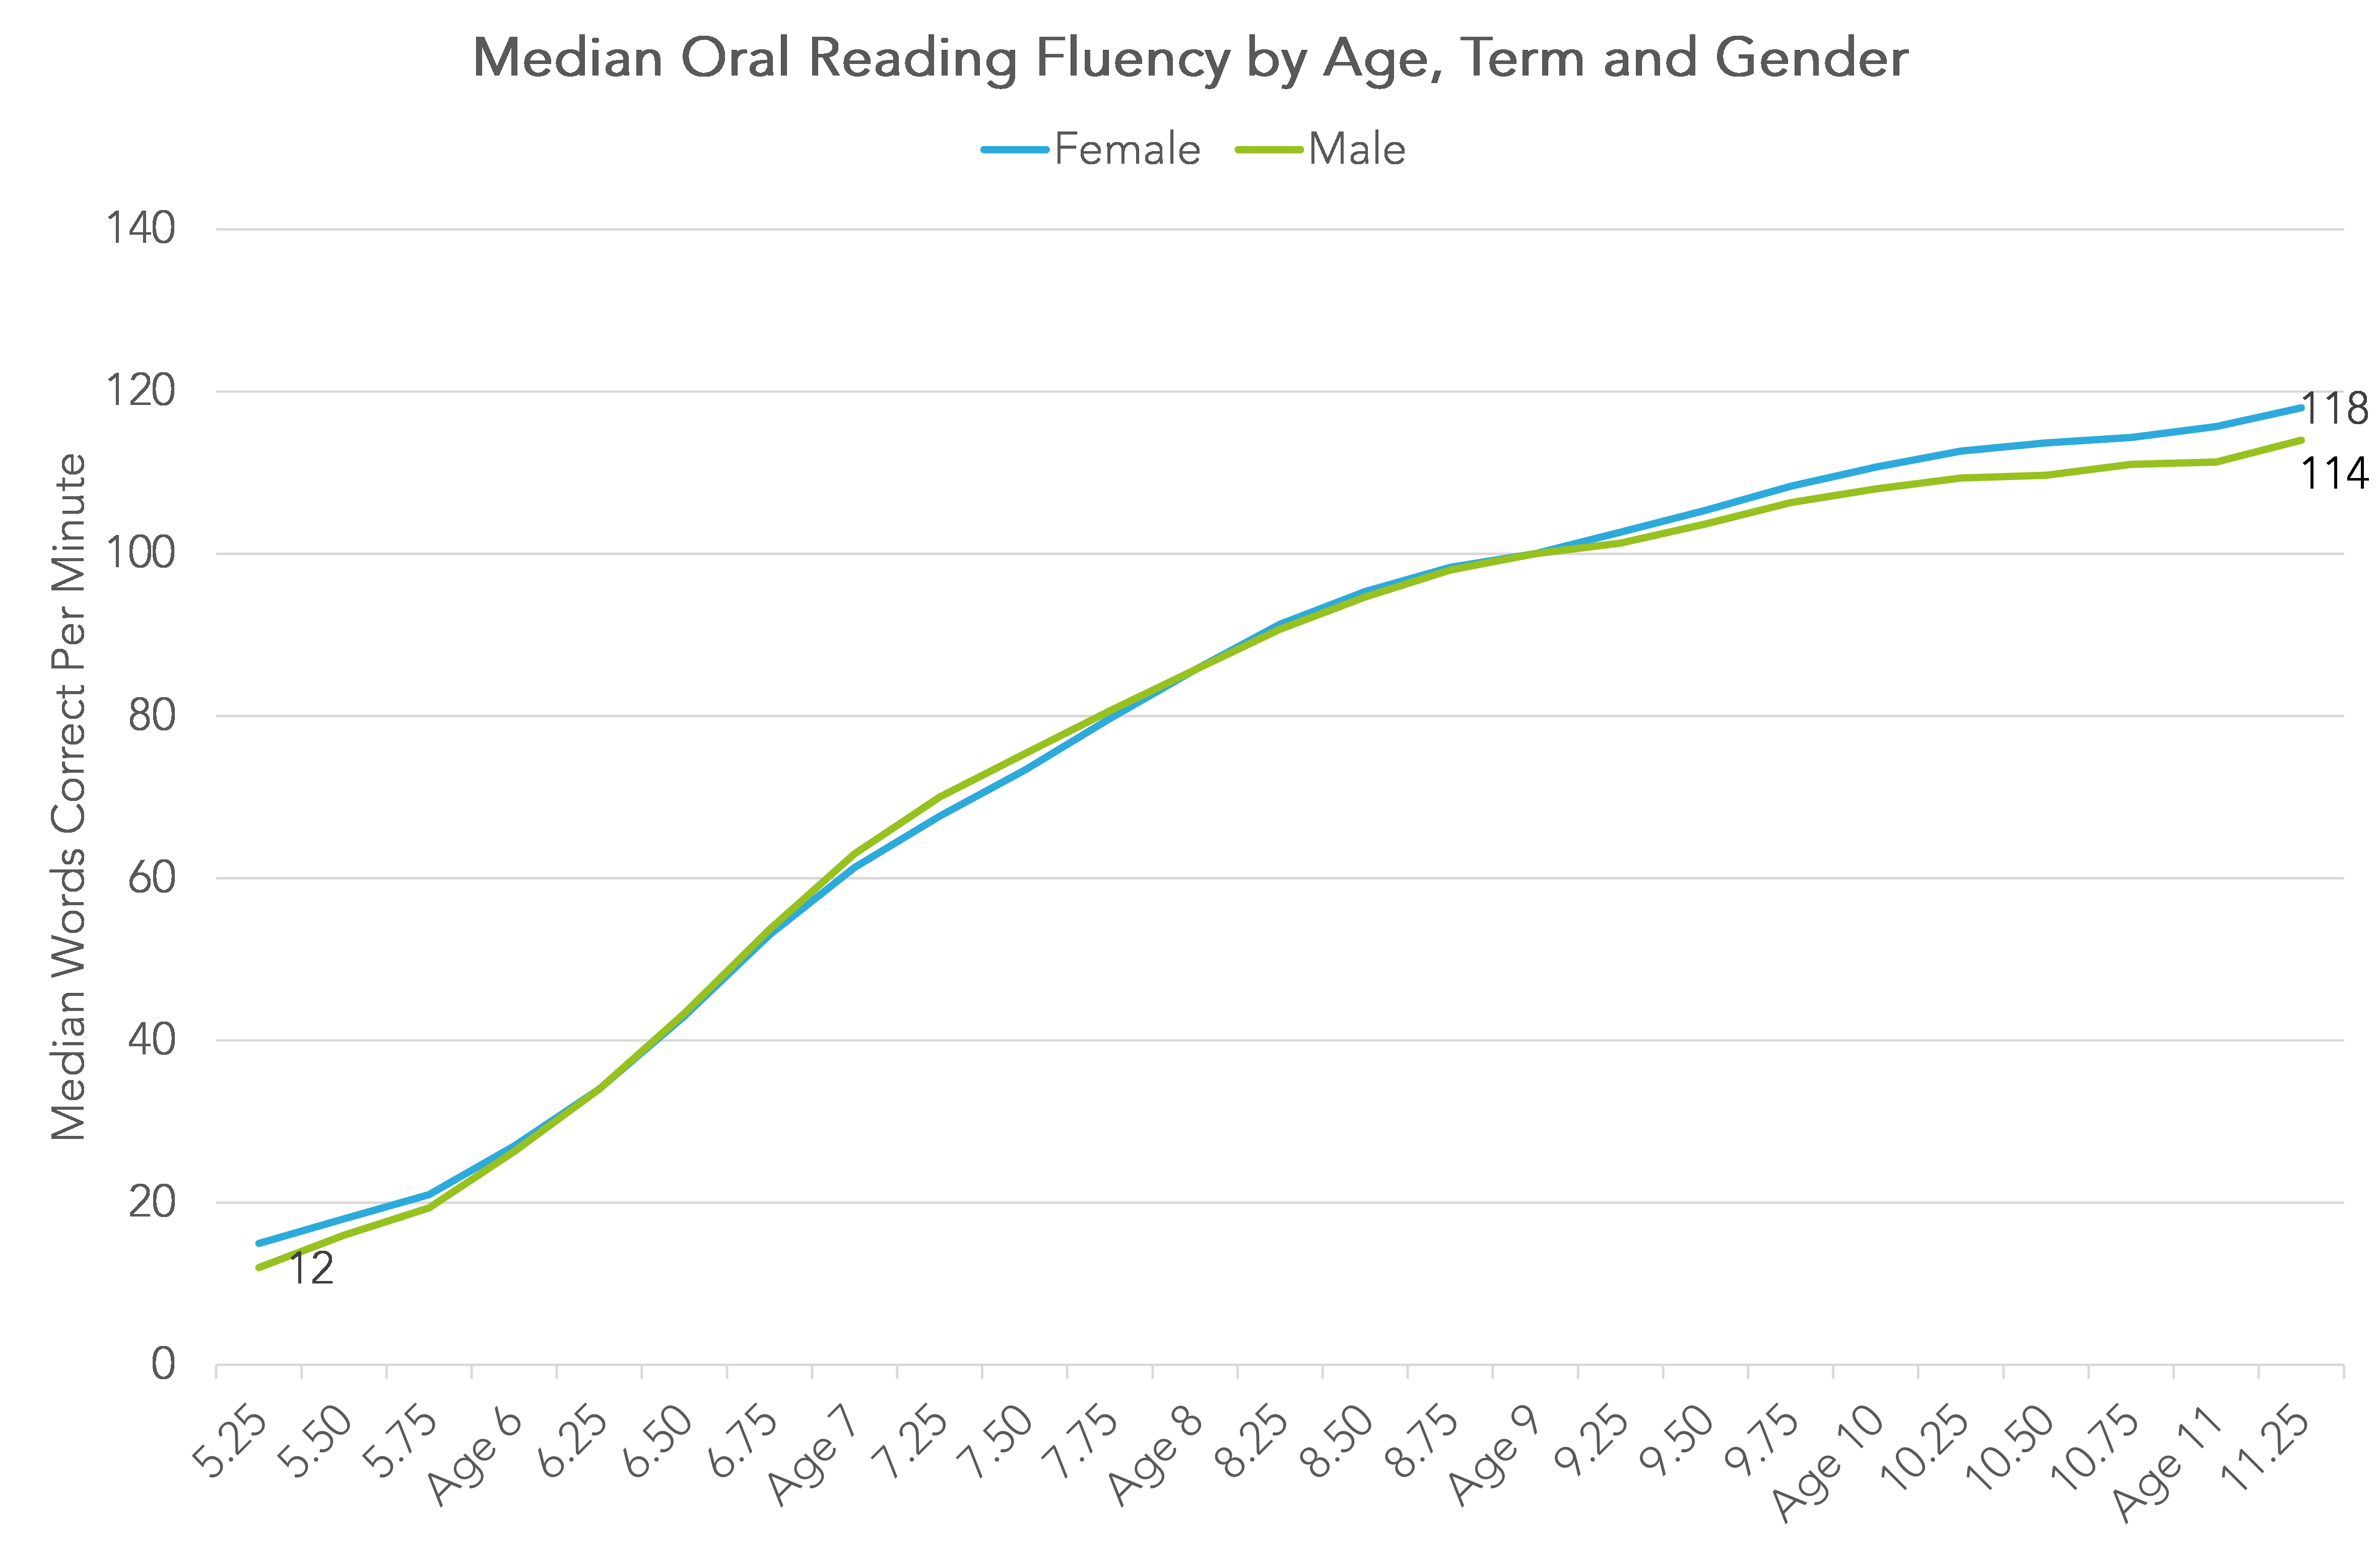
We do not see much difference in reading fluency between boys and girls although we see a small gap begin to emerge at ages 10 and 11, just before the end of Key Stage 2.
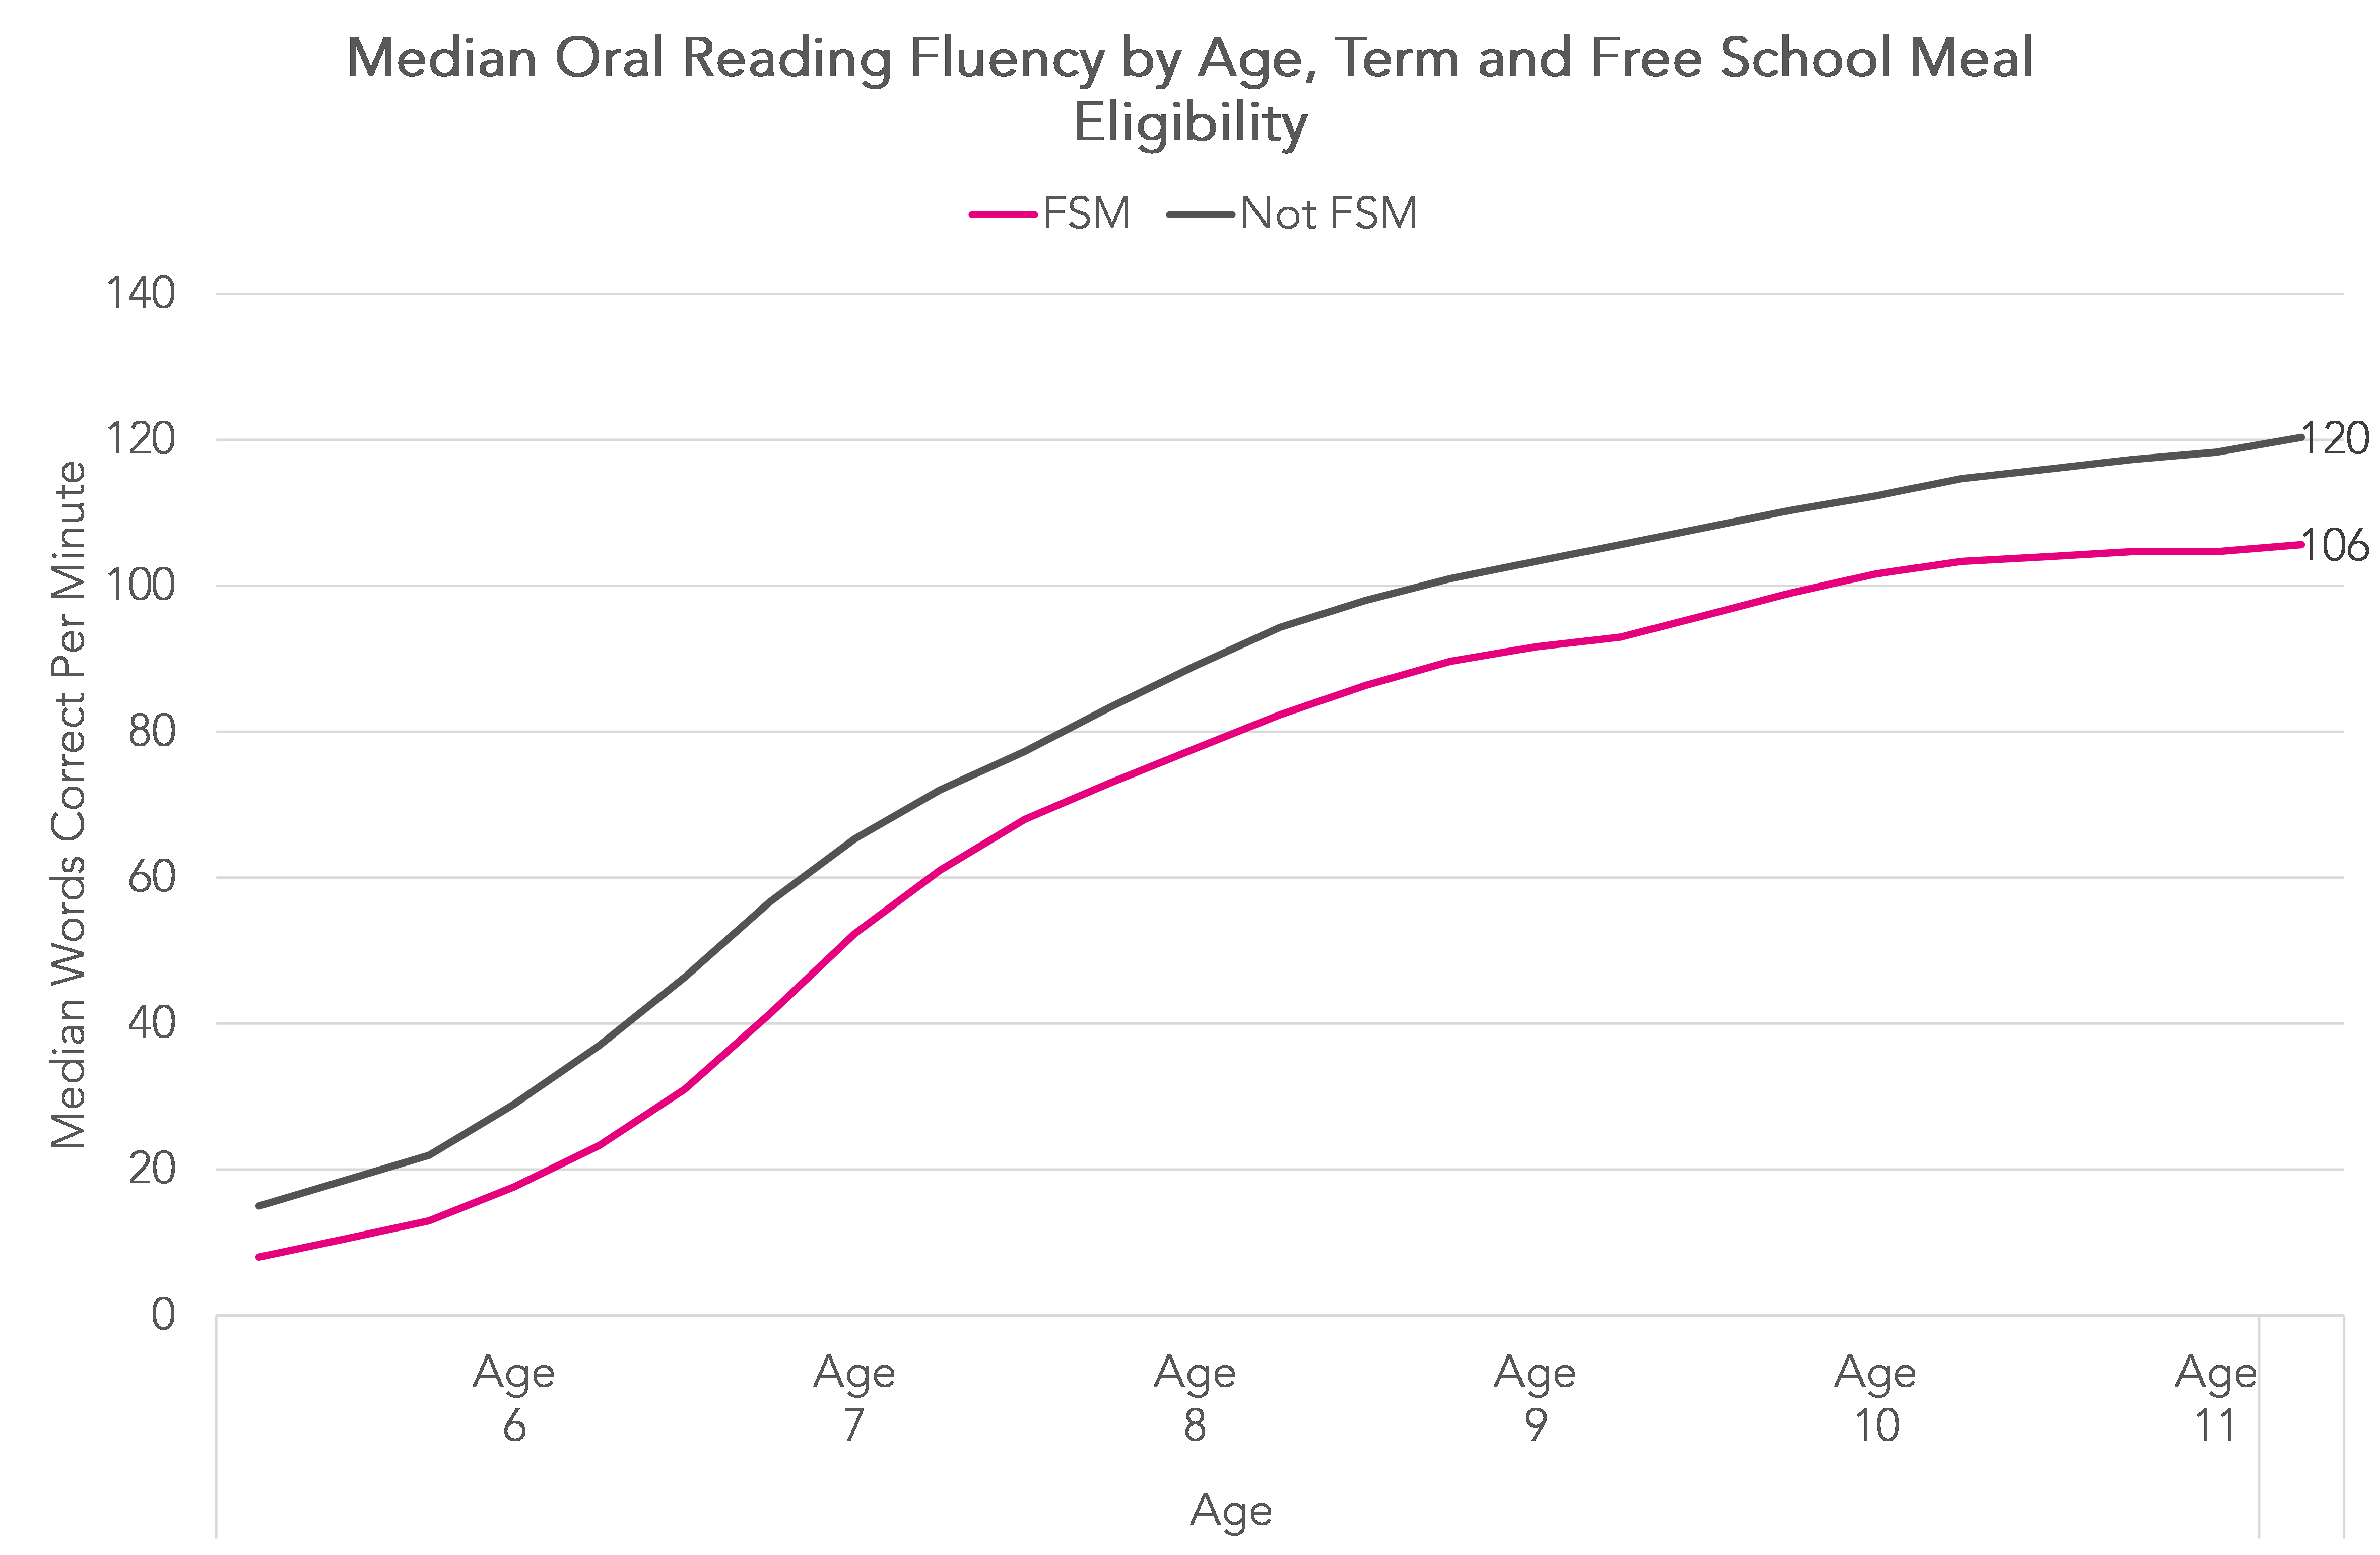
Differences in reading fluency are more apparent between disadvantaged pupils[2] and their peers. The median number of words read correctly per minute is typically 10-15 fewer among disadvantaged pupils.
Correlation with Key Stage 2 reading test results
Around 2,000 schools supplied us with end of Key Stage 2 test data in 2024.
We therefore link Year 6 pupils’ KS2 reading comprehension test results to their Year 6 RAP assessments. We use data for 3,600 pupils who completed 2 or more RAP assessments during Year 6.
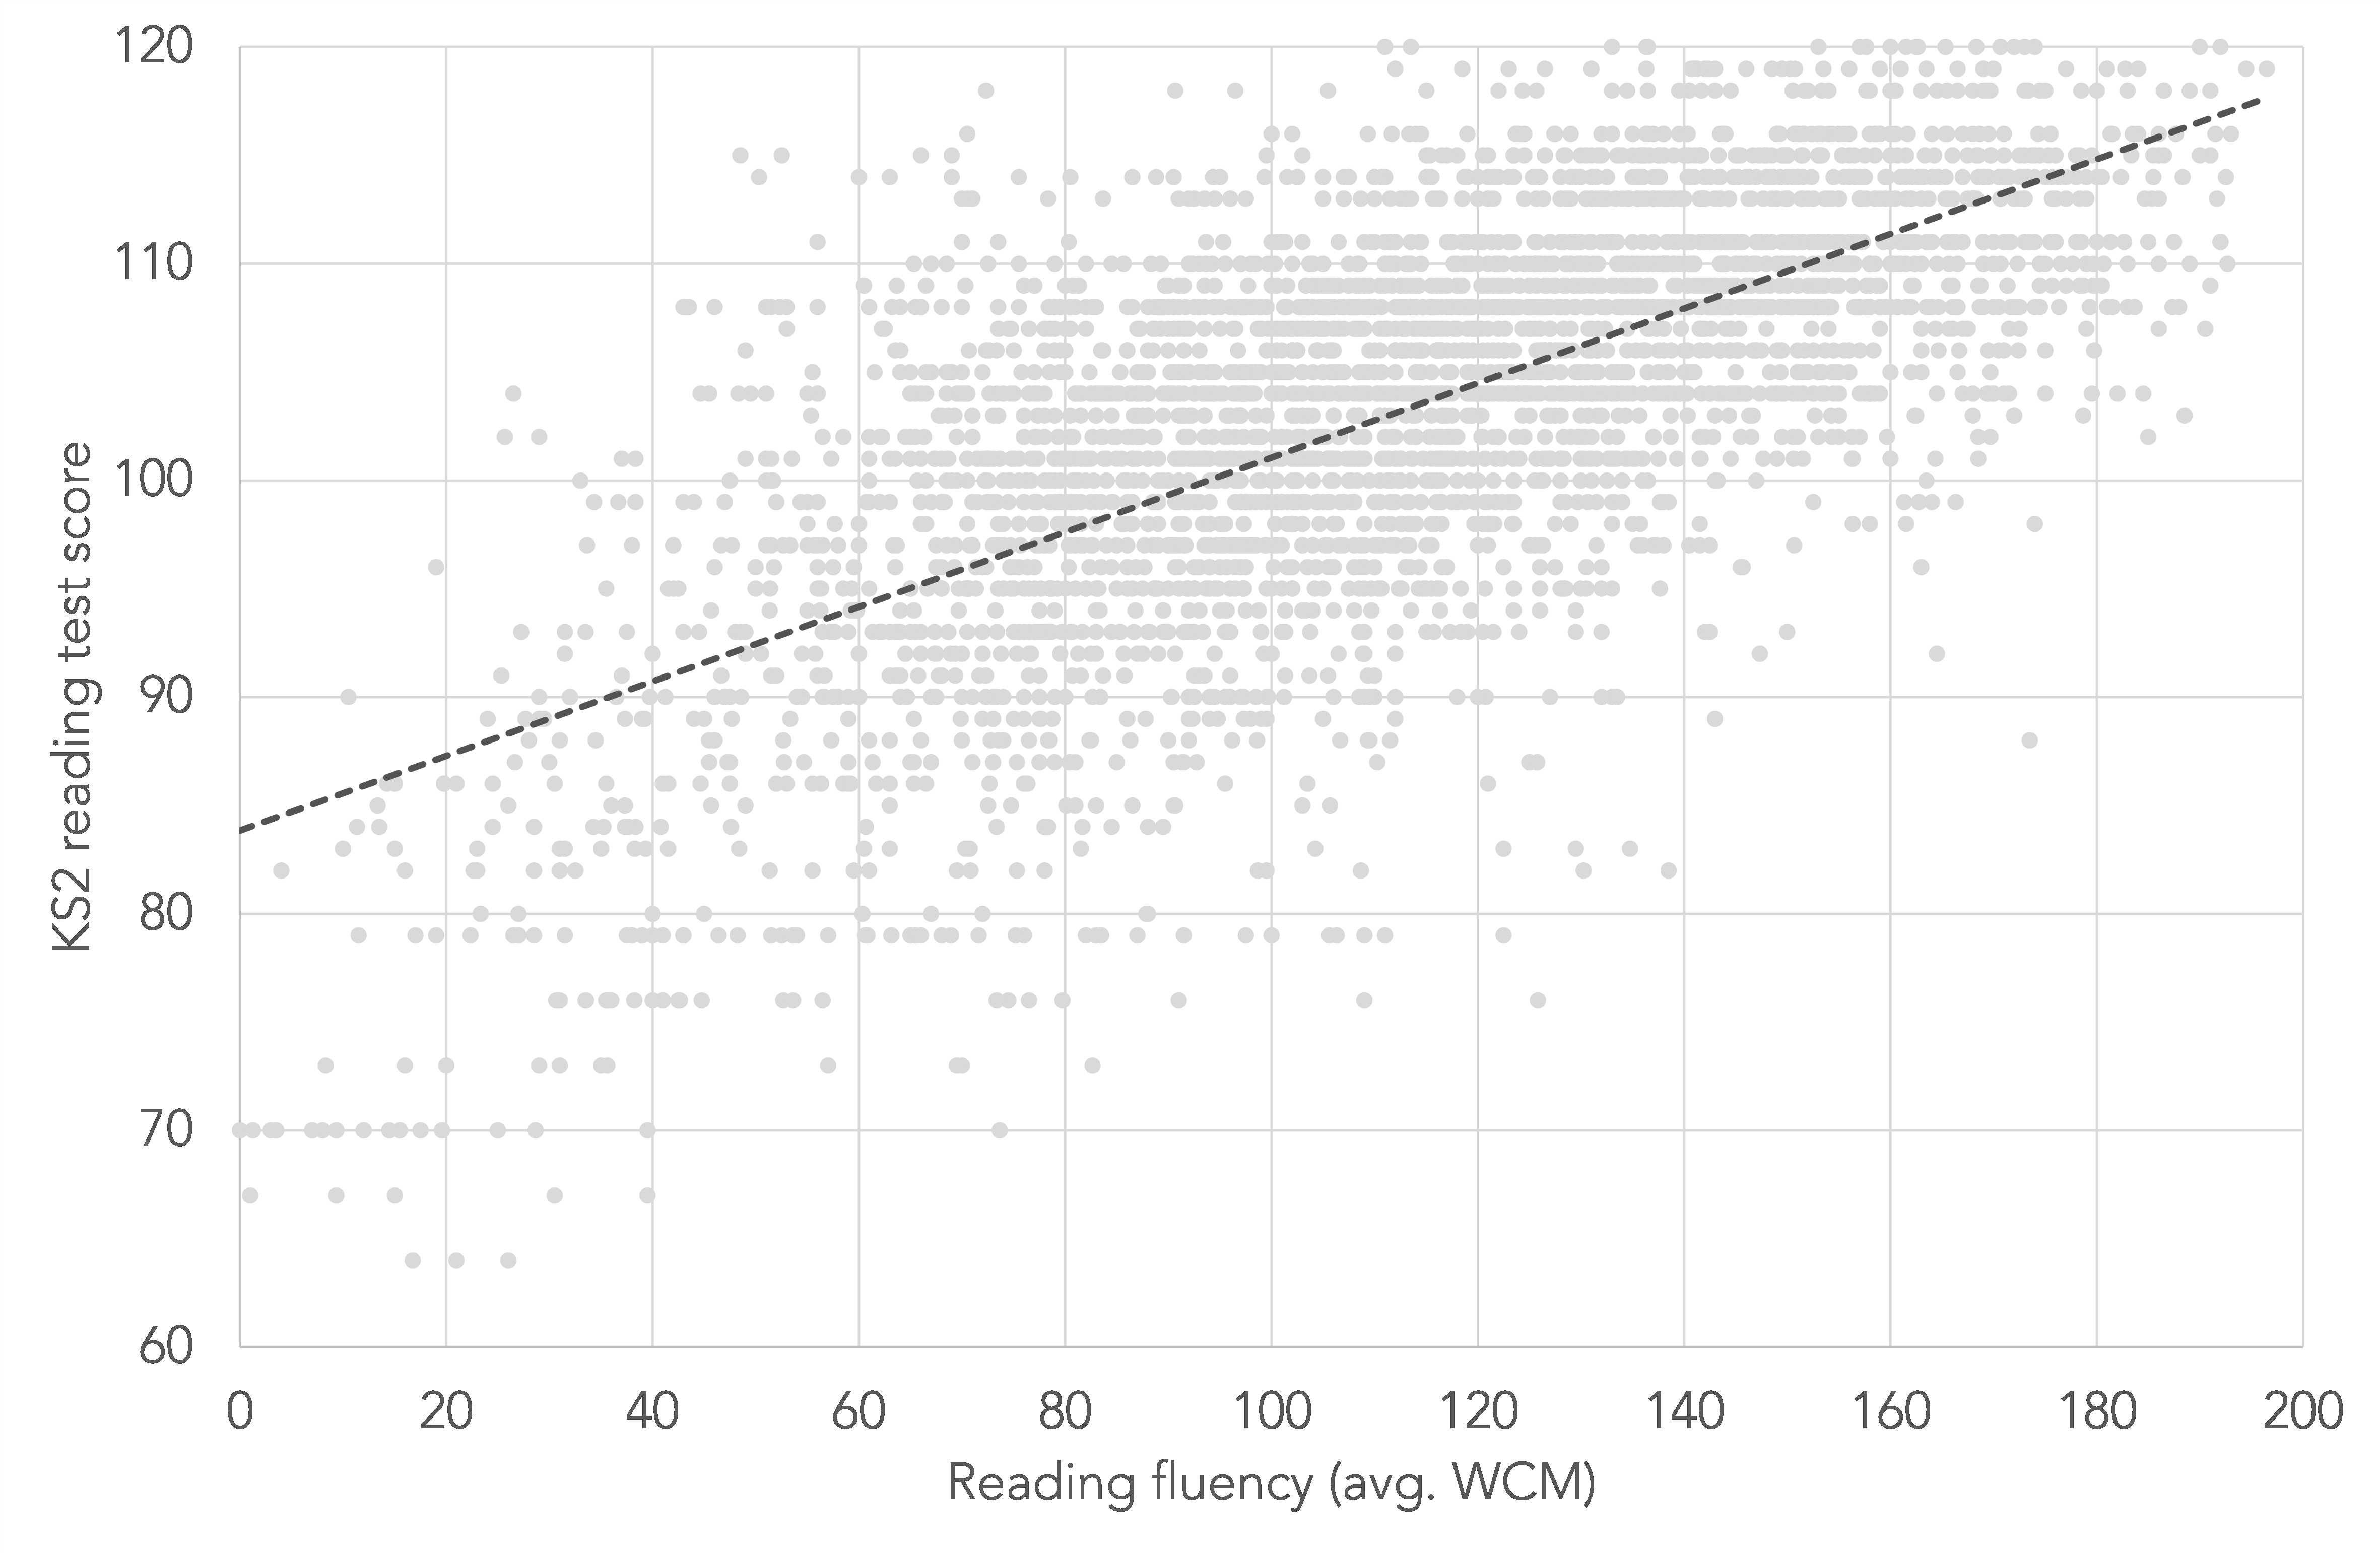
There is a reasonably strong correlation between fluency and reading comprehension (r=0.68).
We also examined the extent to which differences in mean KS2 reading comprehension test scores between different groups could be “explained” by differences in reading fluency by running a Blinder-Oaxaca decomposition[3].

On average, girls in our sample achieved a KS2 reading test score of 104.0, 1.7 points higher than that of boys (102.3). Just under half of the gap was due to girls having higher reading fluency. This would suggest that increasing the fluency of boys to the level of girls would reduce the gap in reading comprehension scores by half.
The gap between disadvantaged pupils and their peers is even larger. Non-disadvantaged pupils in our sample achieved a mean KS2 reading score of 104.6 compared to 100.0 among disadvantaged pupils. Around half of the 4.7 point gap is “explained” by lower reading fluency among disadvantaged pupils.
Summing up
It’s still relatively early days for RAP but the data collected so far illustrates not only how reading fluency develops as children move through primary school but also the variation in reading fluency within age cohorts.
Oral reading fluency is correlated with KS2 reading comprehension outcomes and, given that oral reading fluency is quick and easy to measure, it’s likely to be an extremely useful indicator for schools to measure.
In particular, the low level of reading fluency of the lowest quartile of readers is likely to indicate a reading difficulty that will impact this group across the curriculum. Monitoring the oral reading fluency of the lowest quartile of readers, in particular, and addressing this deficit as early as possible, should be a concern of government and schools alike.
Fluency teaching and fluency practice throughout the school years, including a focus on oral reading fluency through repeated reading, choral reading, partner reading and all other fluency strategies are likely to be very supportive of a pupils’ overall reading development, and certainly not detrimental.
These data are also relevant to thinking about the structure of the KS2 Reading paper, and in particular its length, as papers that are too long risk becoming assessments largely of reading speed.
Over the next year we’ll be looking to improve the data by piloting an adaptive version of the tool which will provide a common scale for measuring reading fluency from Reception to Year 6.
Now read the full report.
- Grapheme-Phoneme Correspondence
- Eligible for free school meals
- https://repec.ethz.ch/ets/papers/jann_oaxaca.pdf
Want to stay up-to-date with the latest research from FFT Education Datalab? Sign up to Datalab’s mailing list to get notifications about new blogposts, or to receive the team’s half-termly newsletter.

I was interested in the advice for the DfE about not making the KS2 SATs test too long in terms of word count because of the strain that puts on young readers and their reading speed. Given that reciprocal reading deliberately slows down readers in order to build their comprehension, I was wondering whether there is any data anywhere on the impact of giving additional time for children to complete the test? For example, does this increase the percentage of children who achieve a standard score of 100+ or who achieve the pass mark, in comparison to the general population of children who sit the test. Particularly interesting in the light of Schools Weekly reporting a much higher percentage of children from private schools being given additional time for completing assessments.
My gut feeling is that we would get a truer sense of children’s ability to read for understanding if we didn’t put them under so much time pressure!