When we last looked at absence back in November, we found that there had been little change from the previous year at primary, and a slight reduction at secondary.
In this post, we’ll see whether these patterns held for the rest of the term. With a full term of data under our belts, we’ll also take a more detailed look at persistent absence.
Data
As usual, data for this post comes from our FFT Attendance Tracker schools – around 6,000 primary and 2,500 secondary schools across England. And we’ll be looking at the period from the beginning of September up until Friday 20th December.
Weekly absence
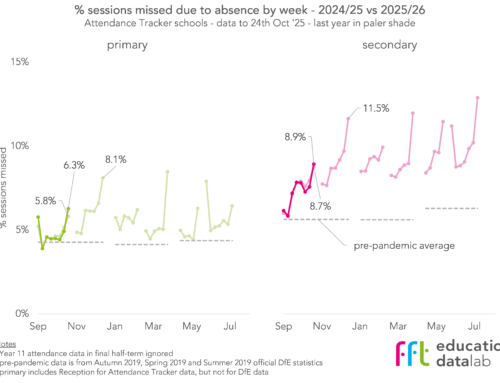
To start, let’s look at pupils’ absence rates in each week across the term, and compare with the same weeks of the previous academic year.
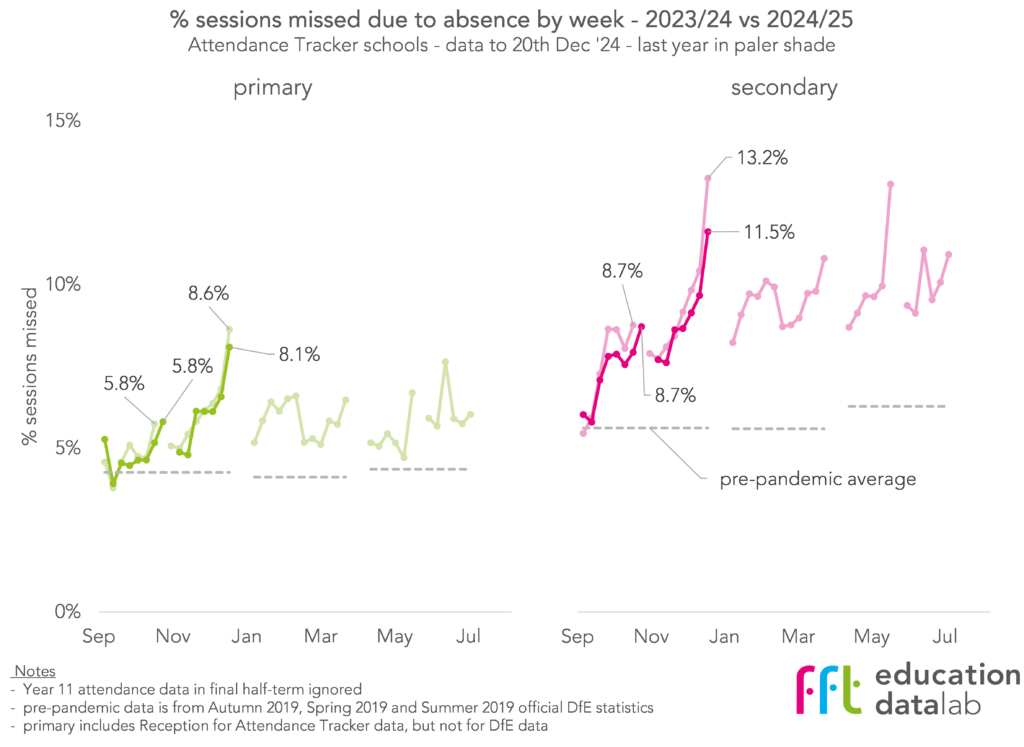
Overall, there’s not too much difference in the shapes of these charts. At both primary and secondary, absence tended to increase as term went on, reaching a peak in the week before the Christmas holidays.
At primary, the lines for this Autumn and last are almost on top of each other, indicating little change in absence rates overall. At secondary, it looks like the slight reduction in absence we saw in the first half-term continued into the second.
Reasons for absence
We can dig down by splitting overall absence into three categories, according to how schools recorded the absences in their registers: illness, unauthorised, and other[1].
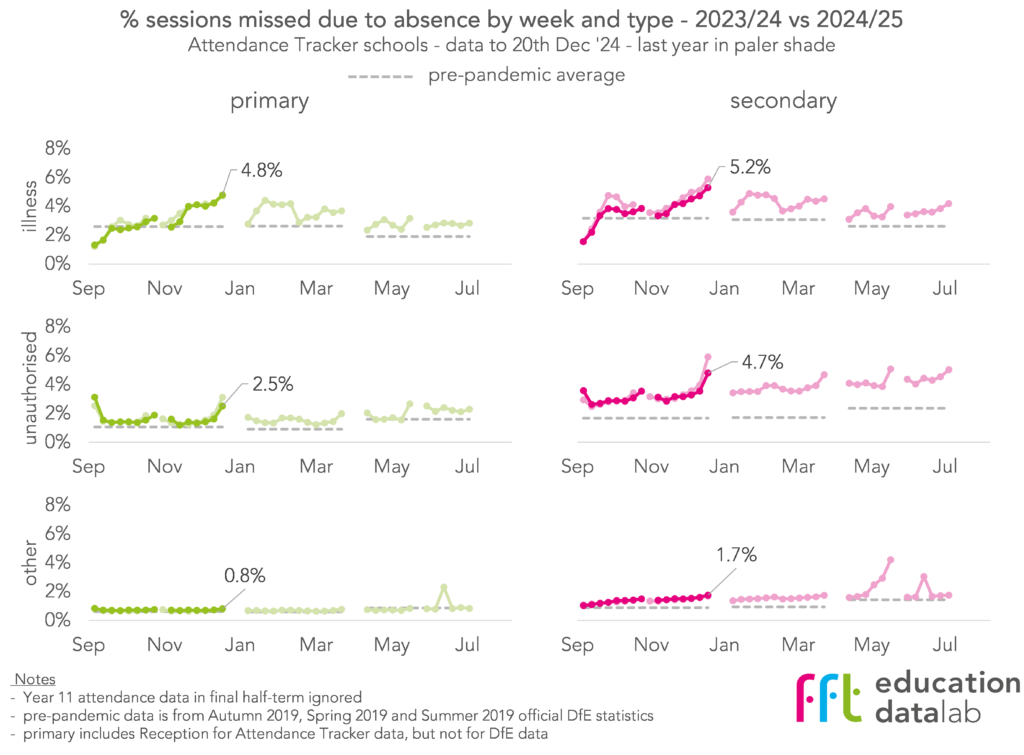
The main driver of absence increasing as term goes on seems to be an increase in absence coded as illness. Unauthorised absence also increased over time but not as steeply, apart from in the final week of term (though with the caveat that not all recent absence recorded as “unauthorised” will remain so, as schools will still be chasing up reasons for absence). Other types of absence, a much smaller component than illness or unauthorised absence, increased steadily across the term at secondary, but remained largely static at primary.
To finish this section, we’ll aggregate reasons for absence across the whole term, and compare with Autumn 2019, pre-pandemic.
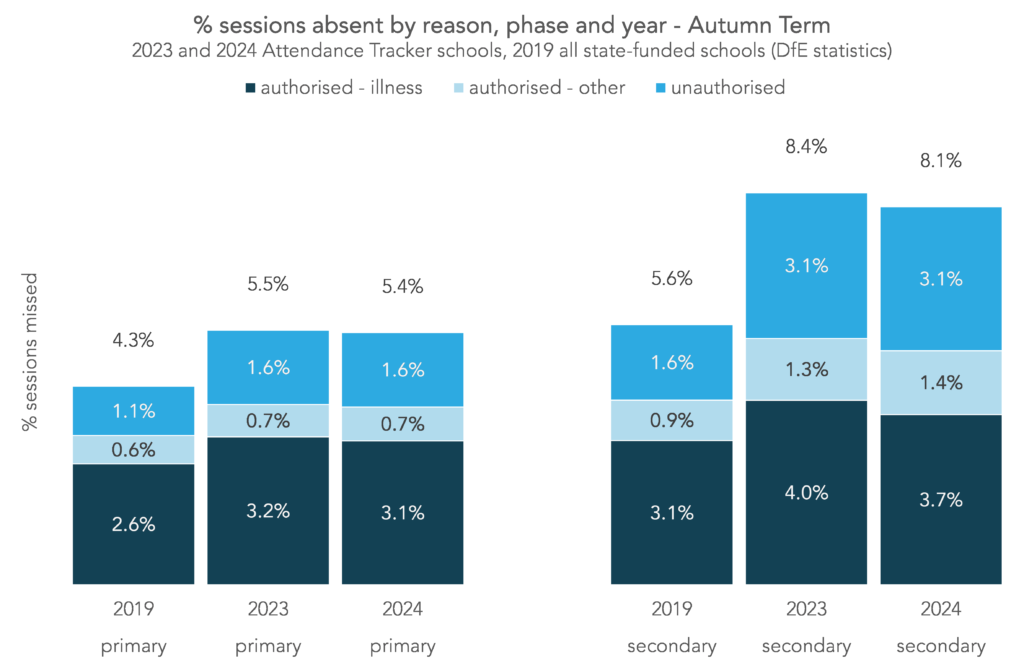
Overall, absence was slightly lower this Autumn term than last at secondary, driven by a small reduction in absence coded as illness. At primary, there was little change.
Compared with pre-pandemic (Autumn 2019), absence in Autumn remained high, particularly at secondary. At primary, around half of the 1.2 percentage point increase compared with pre-pandemic was due to an increase in absence coded as illness, and the other half an increase in unauthorised absence. At secondary, around two-thirds of the 2.5 percentage point increased was due to an increase in unauthorised absence, with the remainder split evenly between increases in illness and other types of authorised absence.
Persistent absence by year group
Now let’s move on to persistent absence, the percentage of pupils who were absent for at least ten percent of registration sessions, equivalent to around seven or eight days.
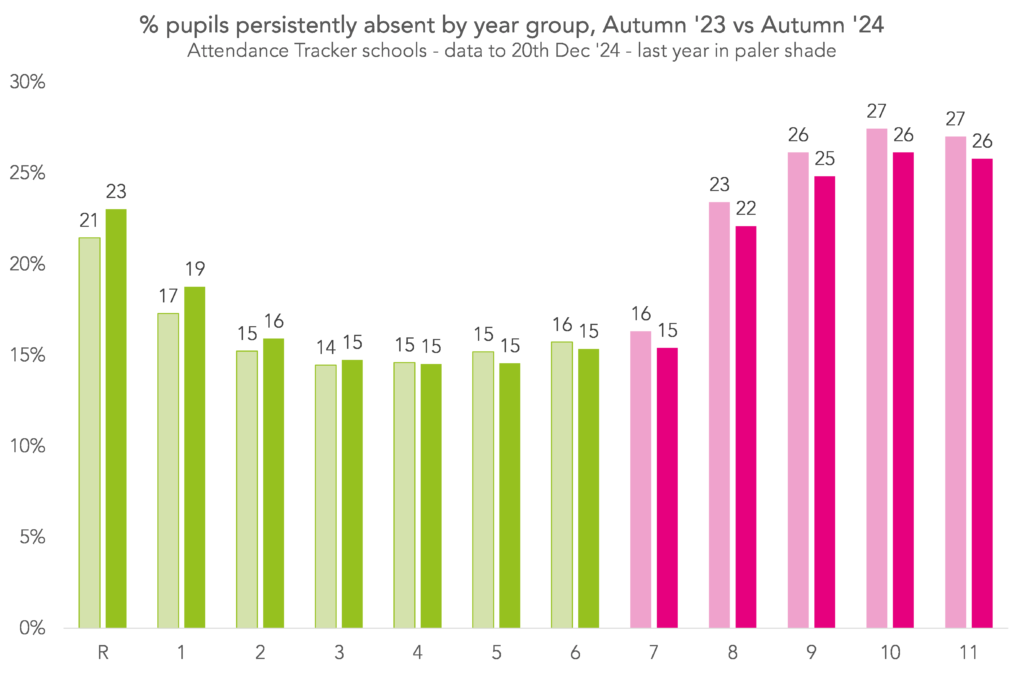
Similar to the patterns from the previous section, persistent absence at secondary was slightly lower this Autumn compared with last, and this was consistent across all year groups. At primary, however, persistent absence among the youngest pupils, particularly those in Reception and Year 1, increased slightly, while among older pupils it stayed roughly the same or decreased slightly.
At primary, 16.5% of pupils were persistently absent this Autumn vs 16.2% last Autumn and 11.2% in Autumn 2019, and at secondary, 22.8% were persistently absent this Autumn vs 24.0% last Autumn and 15.0% in Autumn 2019.
Persistent absence by region
To finish, let’s look at how persistent absence varied by region. Again, we’ll compare this Autumn with last Autumn.
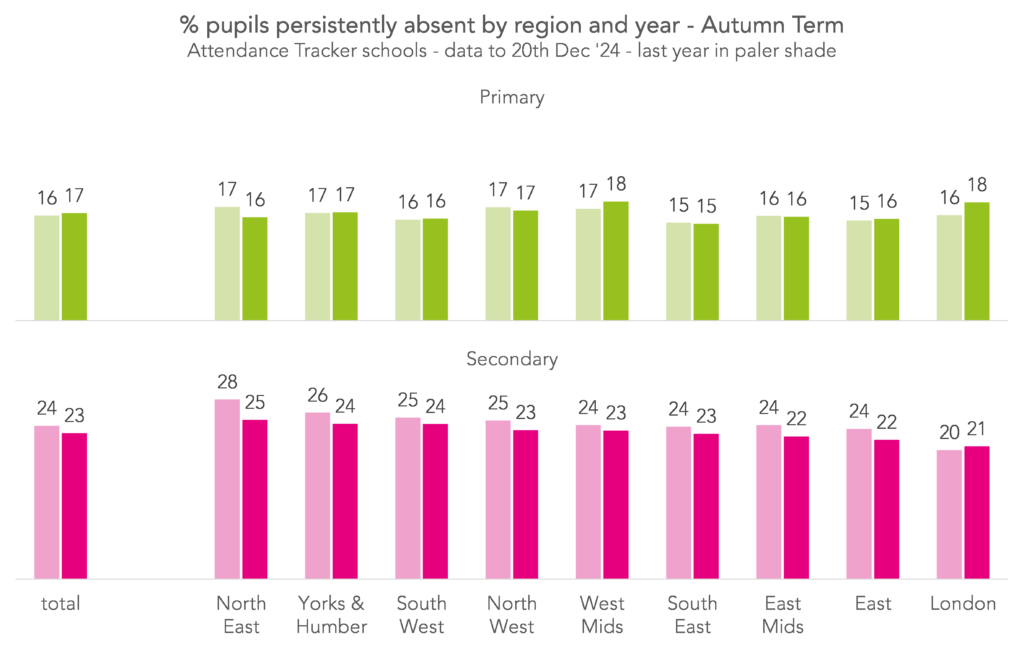
At secondary, the North East remained the region with the highest rates of persistent absence, and London the lowest. However, in the North East, rates were three percentage points lower than last year, and in London, one percentage point higher. In all other regions, persistent absence decreased by one or two percentage points.
At primary, persistent absence rates ranged from 18% in London and the West Midlands, to 15% in the South East. All regions saw rates this Autumn within one percentage point of last Autumn, apart from London where persistent absence increased by two percentage points.
Summing up
Overall, absence and persistent absence this Autumn term were slightly lower than last Autumn at secondary, though levels of unauthorised absence remained high.
At primary, there has been little change since last Autumn, apart from for pupils in Reception and Year 1, where persistent absence seems to have increased a little.
Small increases in persistent absence at this relatively early stage of the year are perhaps not overly concerning, but may be worth keeping an eye on as the year progresses.
Want to stay up-to-date with the latest research from FFT Education Datalab? Sign up to Datalab’s mailing list to get notifications about new blogposts, or to receive the team’s half-termly newsletter.
[1] “Other” is a catch-all category for all forms of authorised absence which aren’t coded as illness-related, for example medical appointments, or “C” coded leaves of absence which may indicate a flexi-schooling arrangement.


Leave A Comment