His Majesty’s Chief Inspector of Schools raised concerns about “the number of children whose pattern of education is disjointed” in his first annual report.
This seemed to cover pupils who attended school only part-time for whatever reason, including both flexi-schooling and when pupils have particular needs (e.g. medical conditions).
Before September, pupils on part-time timetables would have been marked in attendance registers as absent when not attending schools and present when attending.
As we collect attendance data from schools, we had an attempt at estimating the numbers of young people on part-time timetables in June 2023. At that stage, we expected pupils on part-time timetables to be marked as leave of absence for exceptional circumstances (code C) in attendance registers when not at school.
In September, new attendance guidance was introduced which included a new absence code (C2) for leave of absence for compulsory age pupils subject to a part-time timetable.
However, the guidance states that this should only be used to meet individuals’ specific needs (e.g. due to a medical condition) and not when pupils are in full-time education but only attending school part-time (i.e. flexi-schooling arrangements). There is no official guidance for recording sessions when a pupil is being educated out of school but many local authorities suggest using Code C (leave of absence in exceptional circumstances).
Now that we have the new code, we re-run our analysis to estimate the numbers of young people on part-time timetables.
Data
We use data for the Autumn Term 2023/24 up to 6th December collected from almost 10,000 schools subscribing to FFT Attendance Tracker.
This gives us an attendance/ absence code each morning and afternoon for each day for each compulsory age pupil.
Each half day is known as a session and there is a maximum of 10 sessions per week.
For each pupil, we calculate a number of weekly absence measures:
- Sessions marked present
- Sessions marked as absent code C (leave of absence in exceptional circumstances)
- Sessions marked as absent code C2 (leave of absence for compulsory age pupils subject to a part-time timetable)
- Sessions marked as absent code X (non-compulsory age pupils not required to attend)
- Total sessions
For most pupils we observe 14 weeks of attendance.
We try to find pupils with a sustained part-time pattern, which we define as being absent due to a leave of absence (code C or C2) for at least 1 session in at least 5 weeks.
This means we do not count any shorter-term uses of part-time timetables.
Estimating the number of pupils with part-time timetables
Firstly we calculate the proportion of pupils in our sample of schools who have a pattern of attendance codes in which they attend at least one session and have at least one session marked as leave of absence (code C or C2) in at least five weeks.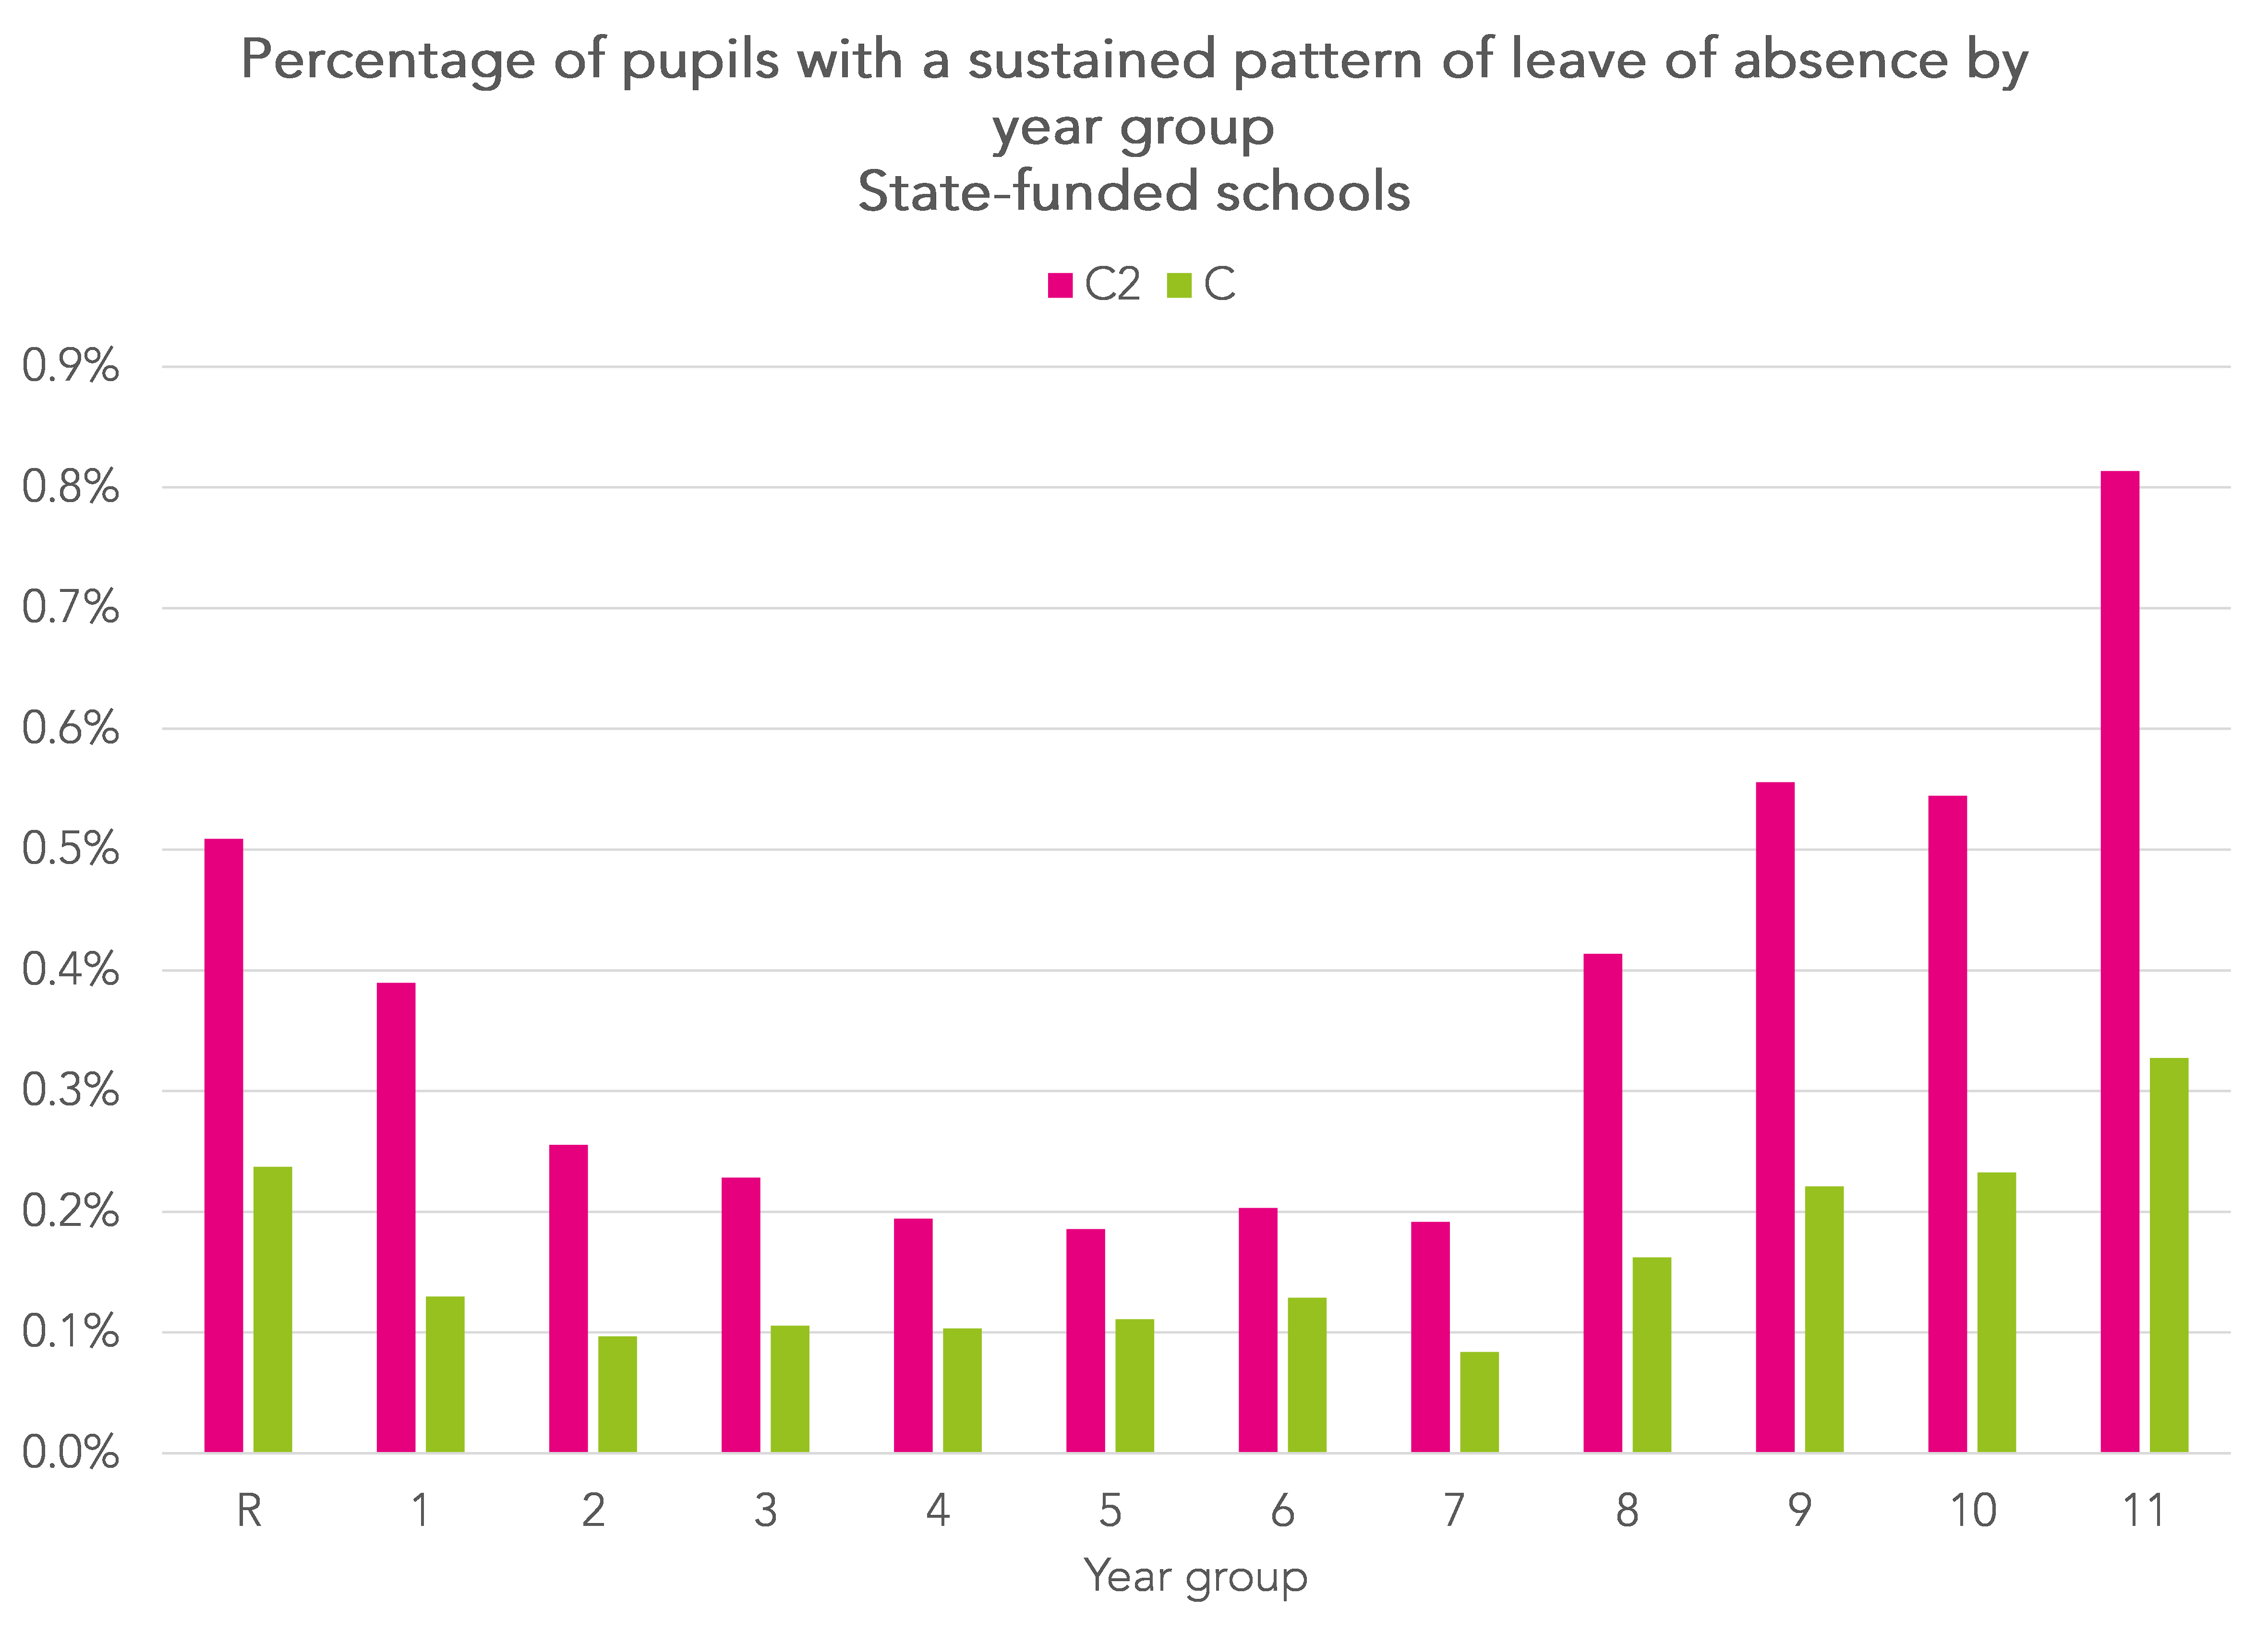 It is much more common for pupils to have a recurring “C2” pattern than a “C” pattern. C2 is the code that should be used where the part-time timetable is initiated by the school. We would expect pupils with flexi-schooling arrangements to have the C pattern.
Leaving aside Reception aged pupils, C2 and C patterns are more common among secondary-aged pupils, particularly those in Year 11.
However, proportions are relatively low. Even among Year 11 pupils, we are talking about less than 1% of pupils.
Grossing these figures up to a national level, we would estimate that there are 29,000 pupils with a code C2 pattern and 12,000 pupils with a code C pattern.
There is a bit of overlap between the two groups: we would estimate 39,000 pupils in either group.
These figures assume that pupils are marked as present at school at least some of the time. We therefore run a second set of calculations in which we relax this restriction. To avoid counting pupils who are continuously absent due to a leave of absence (e.g. as a result of bereavement), we ignore any weeks in which all sessions are marked as C or C2.
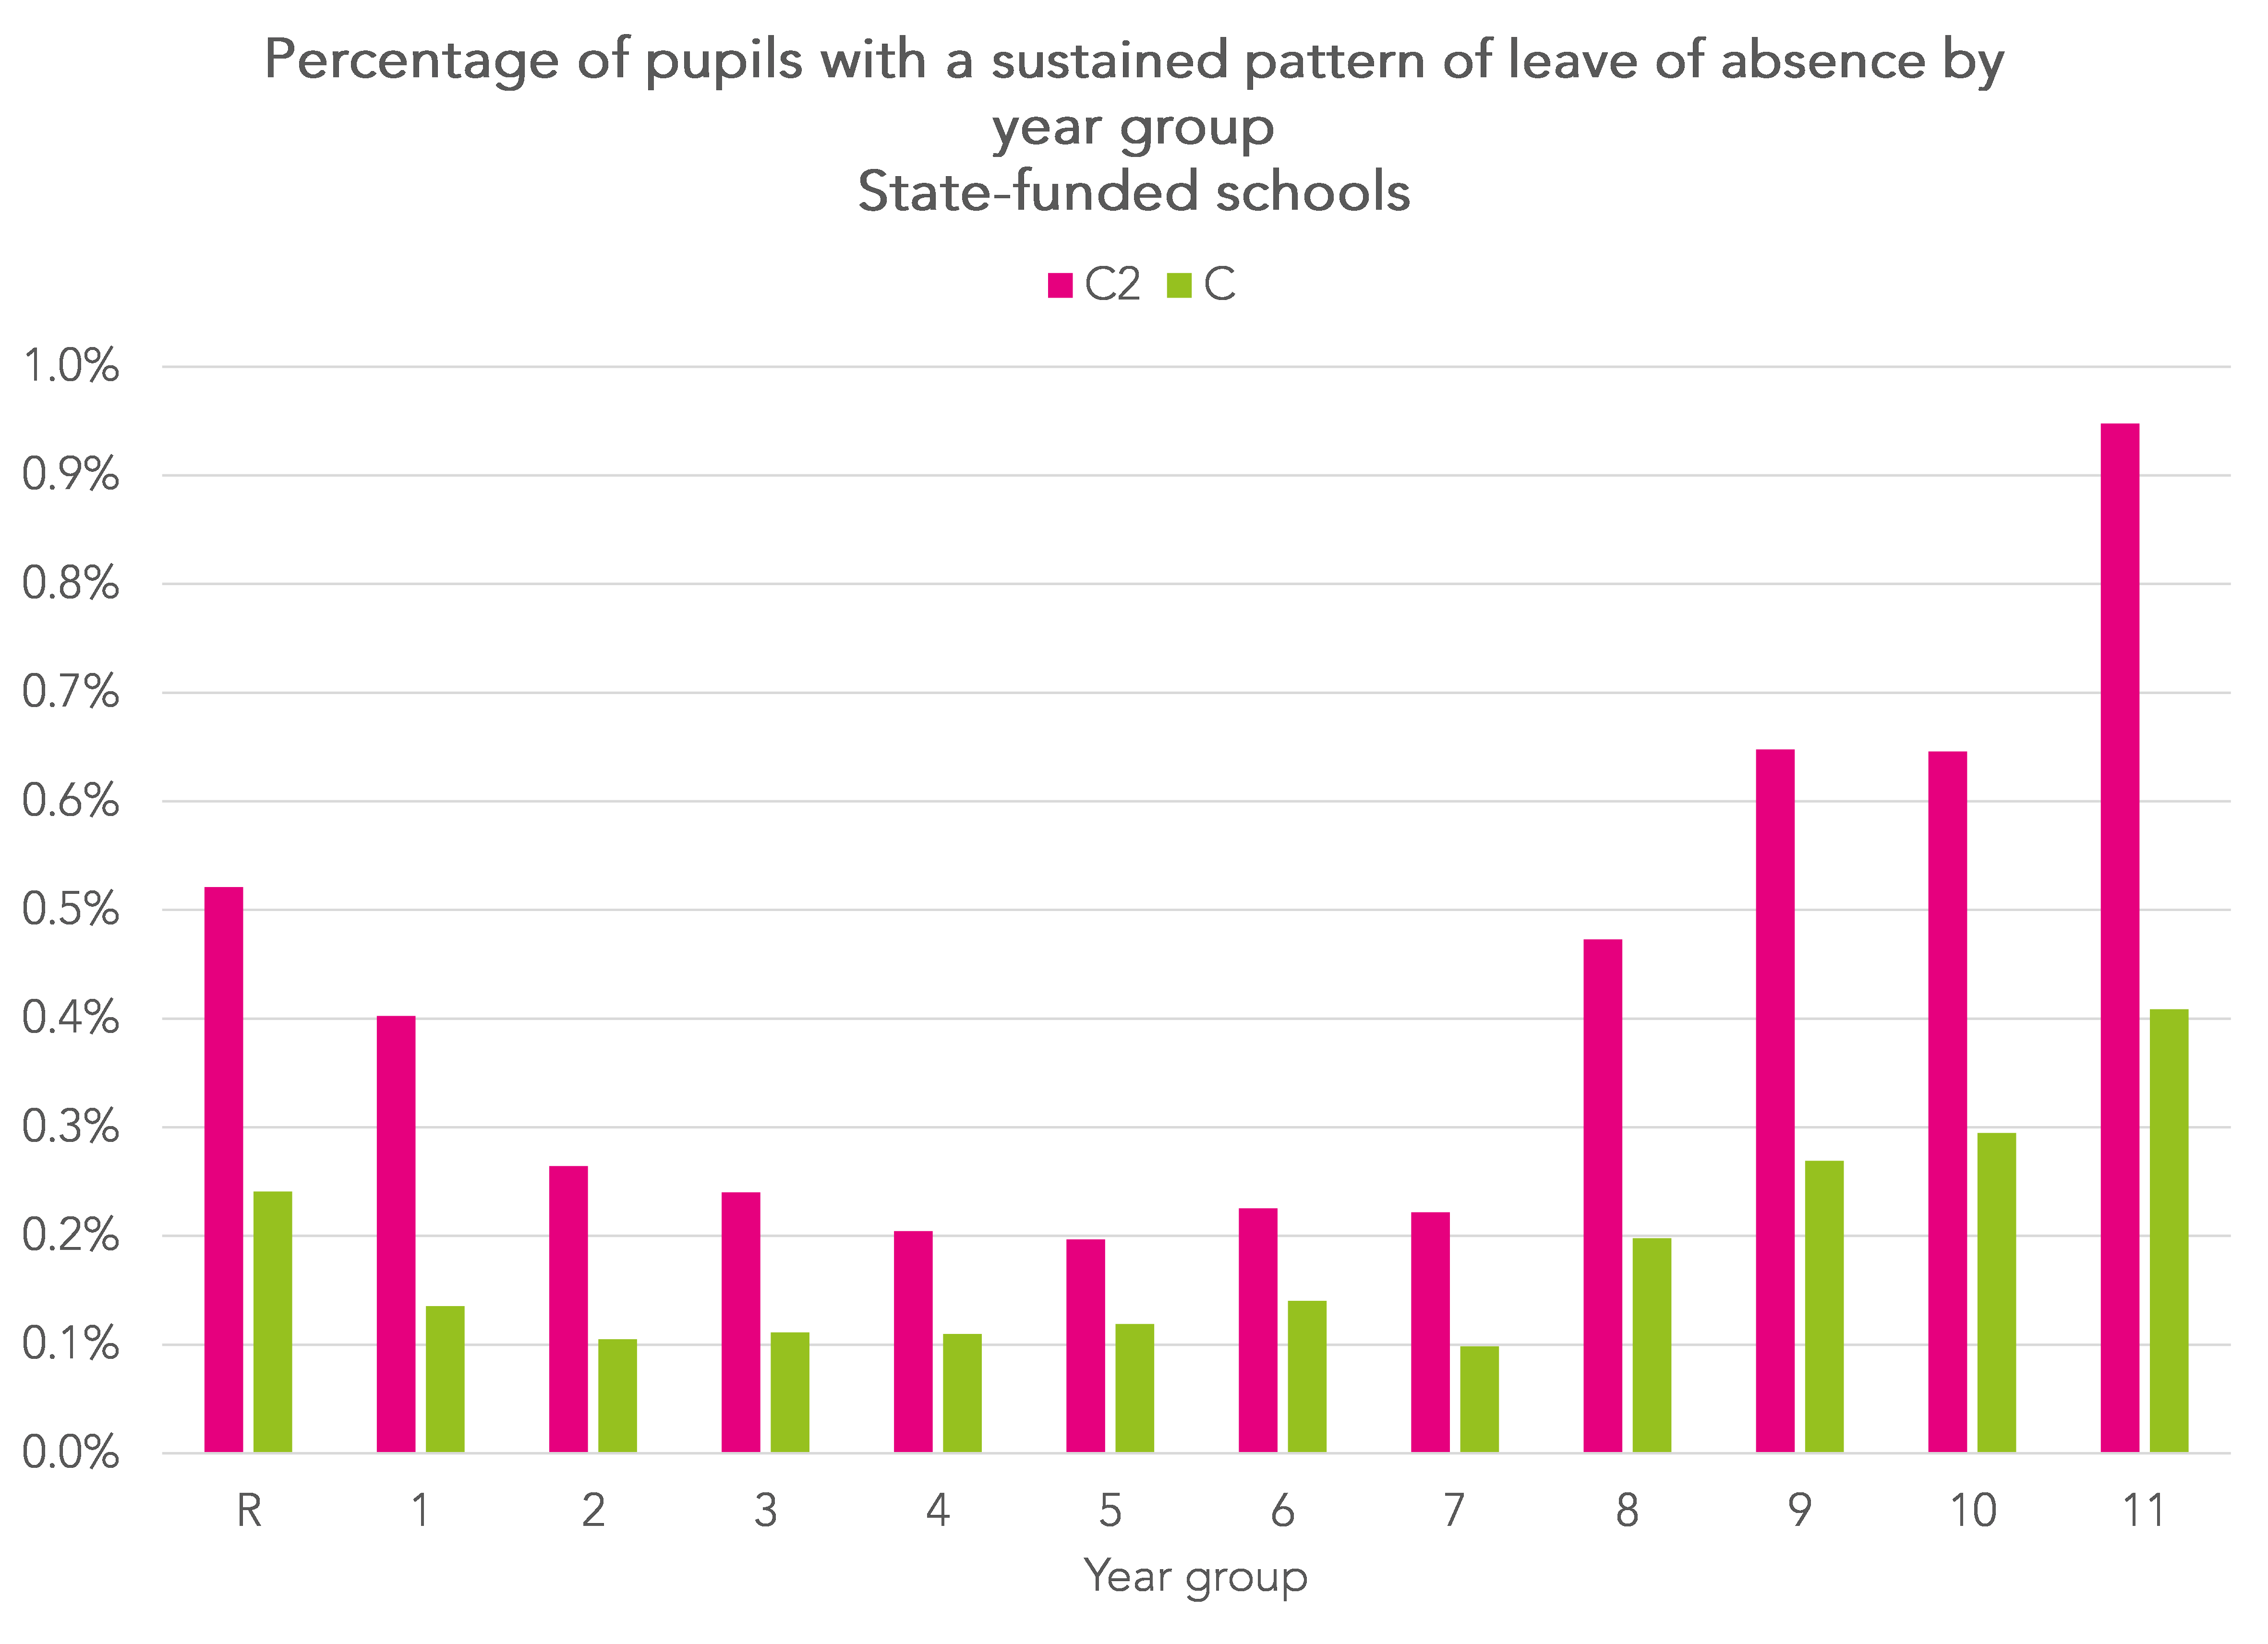
This increases the percentages of pupils with a C2 or C pattern slightly.
Grossing these figures up to a national level, we would estimate that there are 32,000 pupils with a code C2 pattern and 14,000 pupils with a code C pattern, and 43,000 pupils with either.
Characteristics of pupils on part-time timetables
Sticking to our first method, pupils who we repeatedly observe as both present and absent (due to leave of absence) within the same week, we examine their characteristics.
In the chart below, we compare the prevalence of special educational needs (SEN) among primary-aged pupils with C2 and C absence patterns compared to the general population[1].
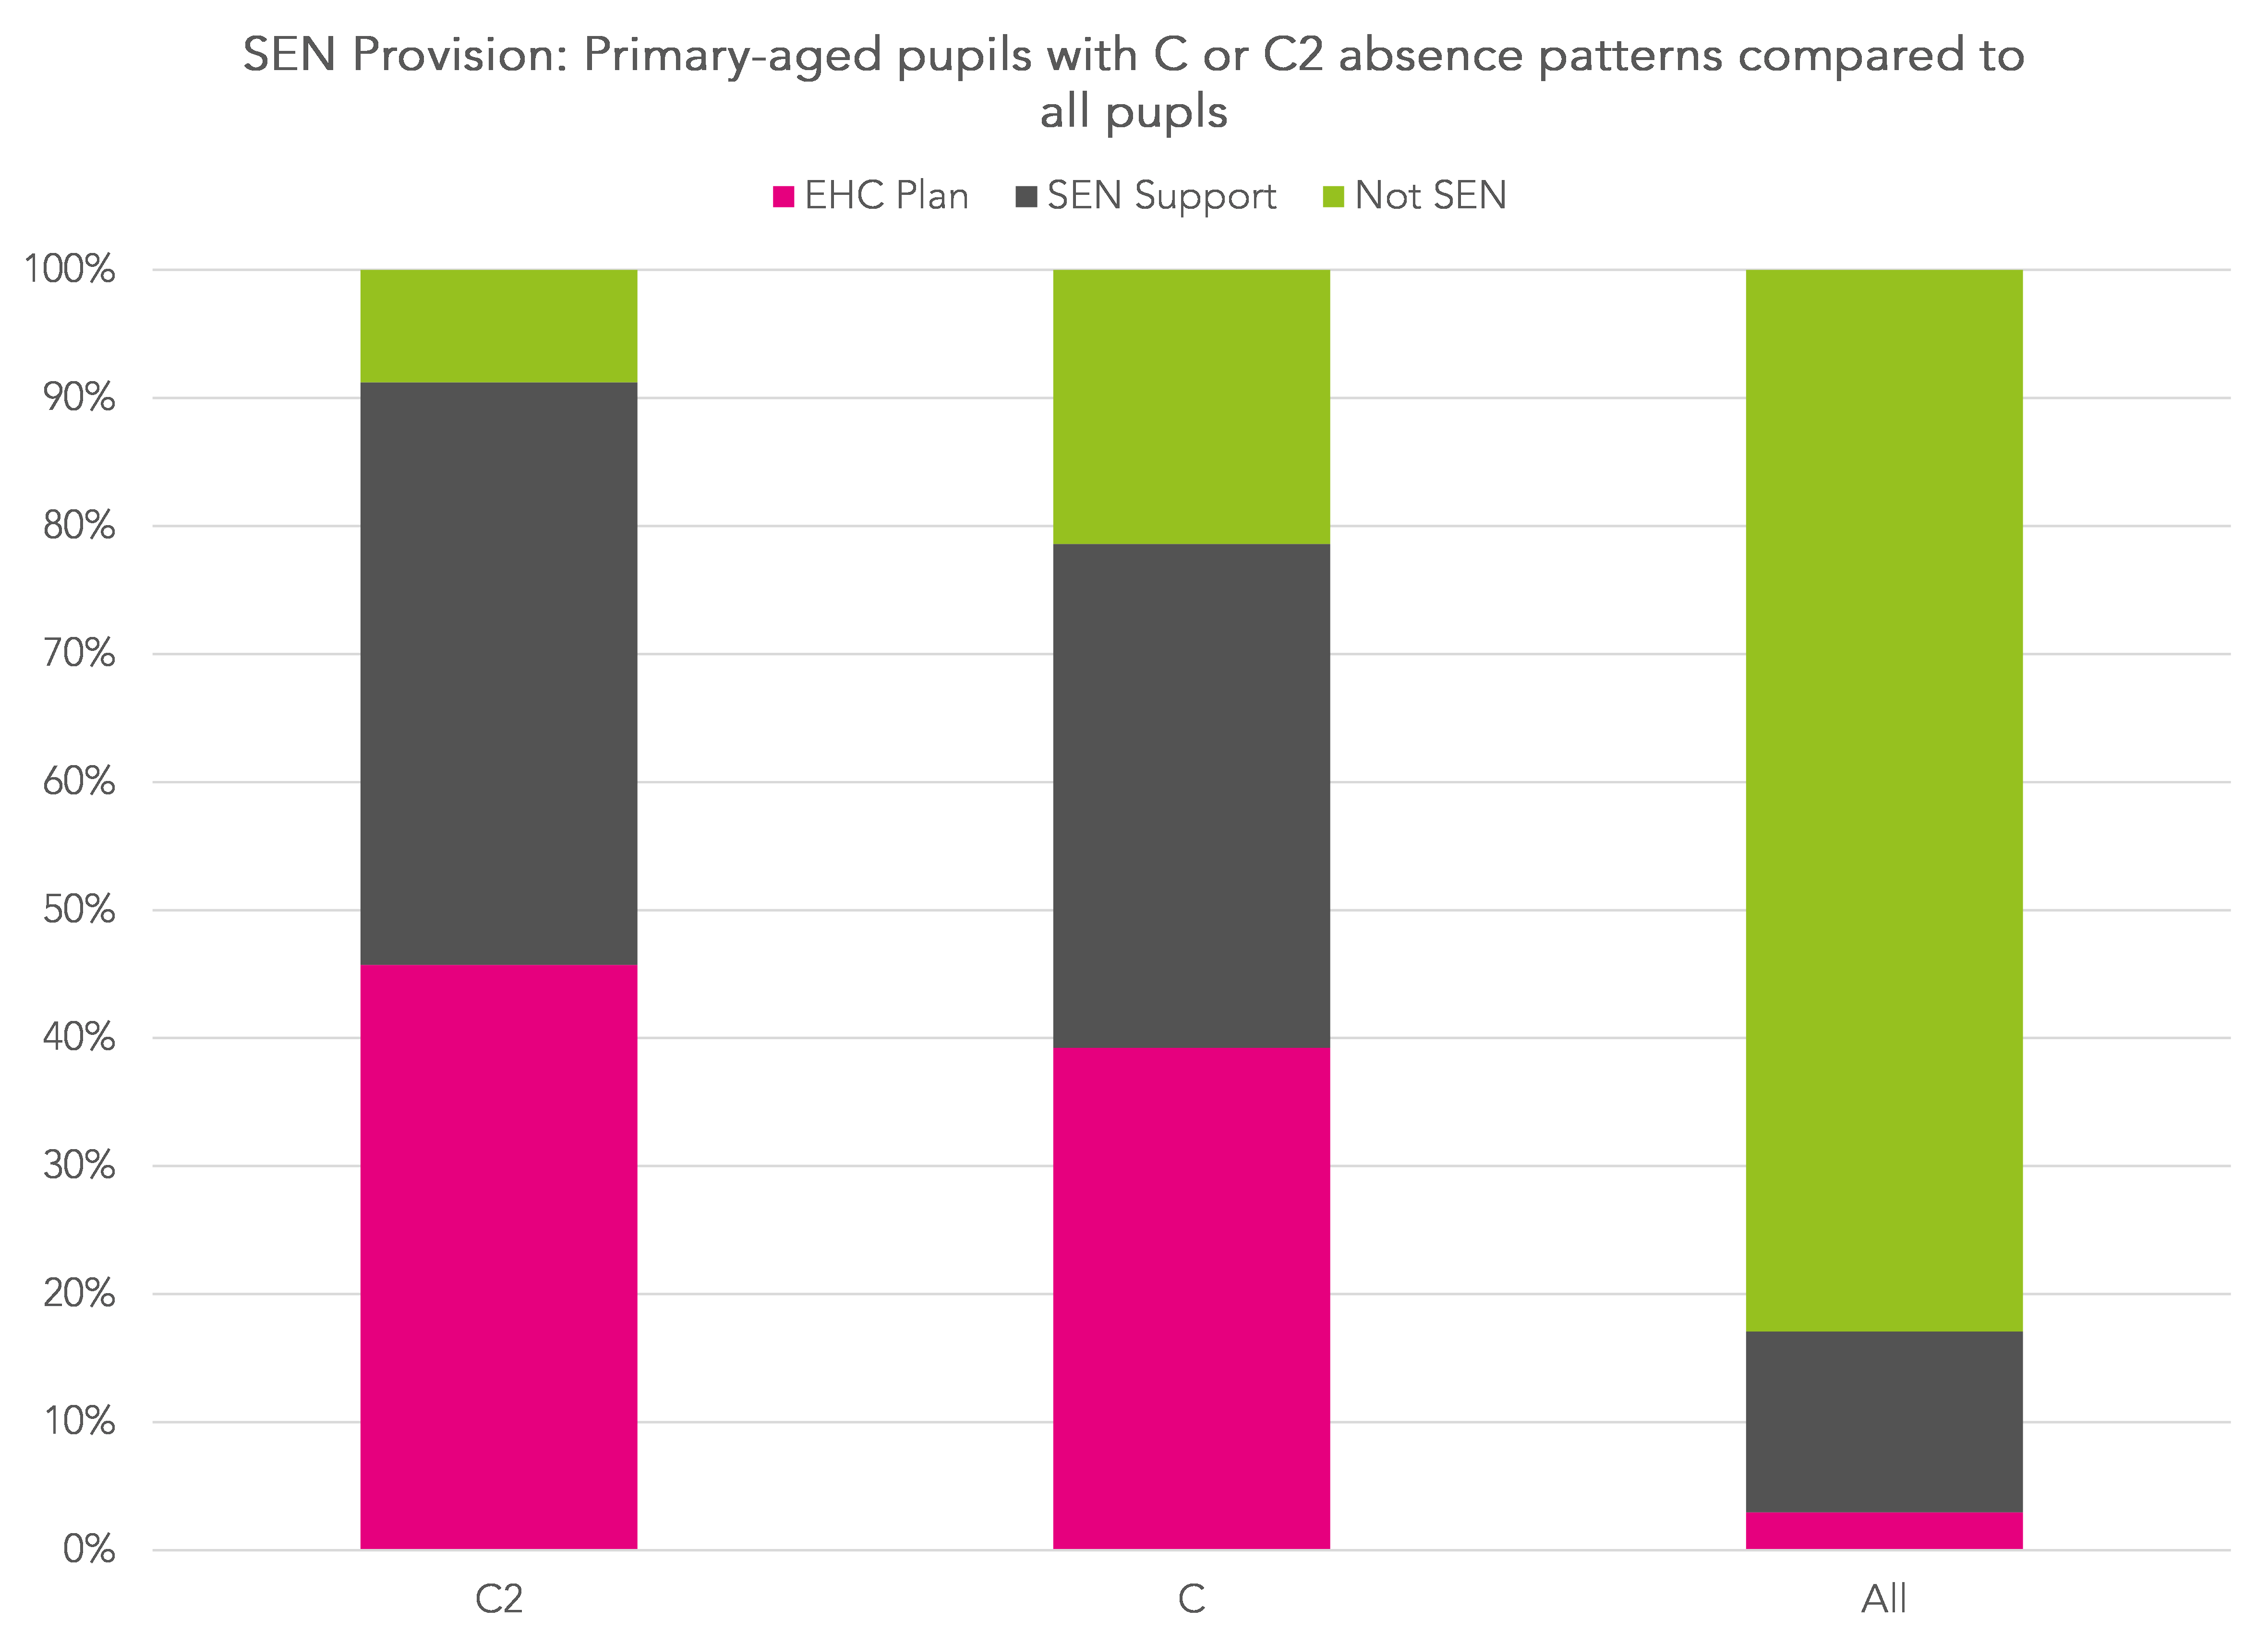
Pupils with C2 or C absence patterns are far more likely than the general population to be identified as having special educational needs. Almost half of pupils with a C2 pattern have an EHC plan, and over 90% have some form of SEN. Prevalence of SEN is slightly lower among pupils with a C absence pattern.
We then repeat the above this time for the secondary-aged population.
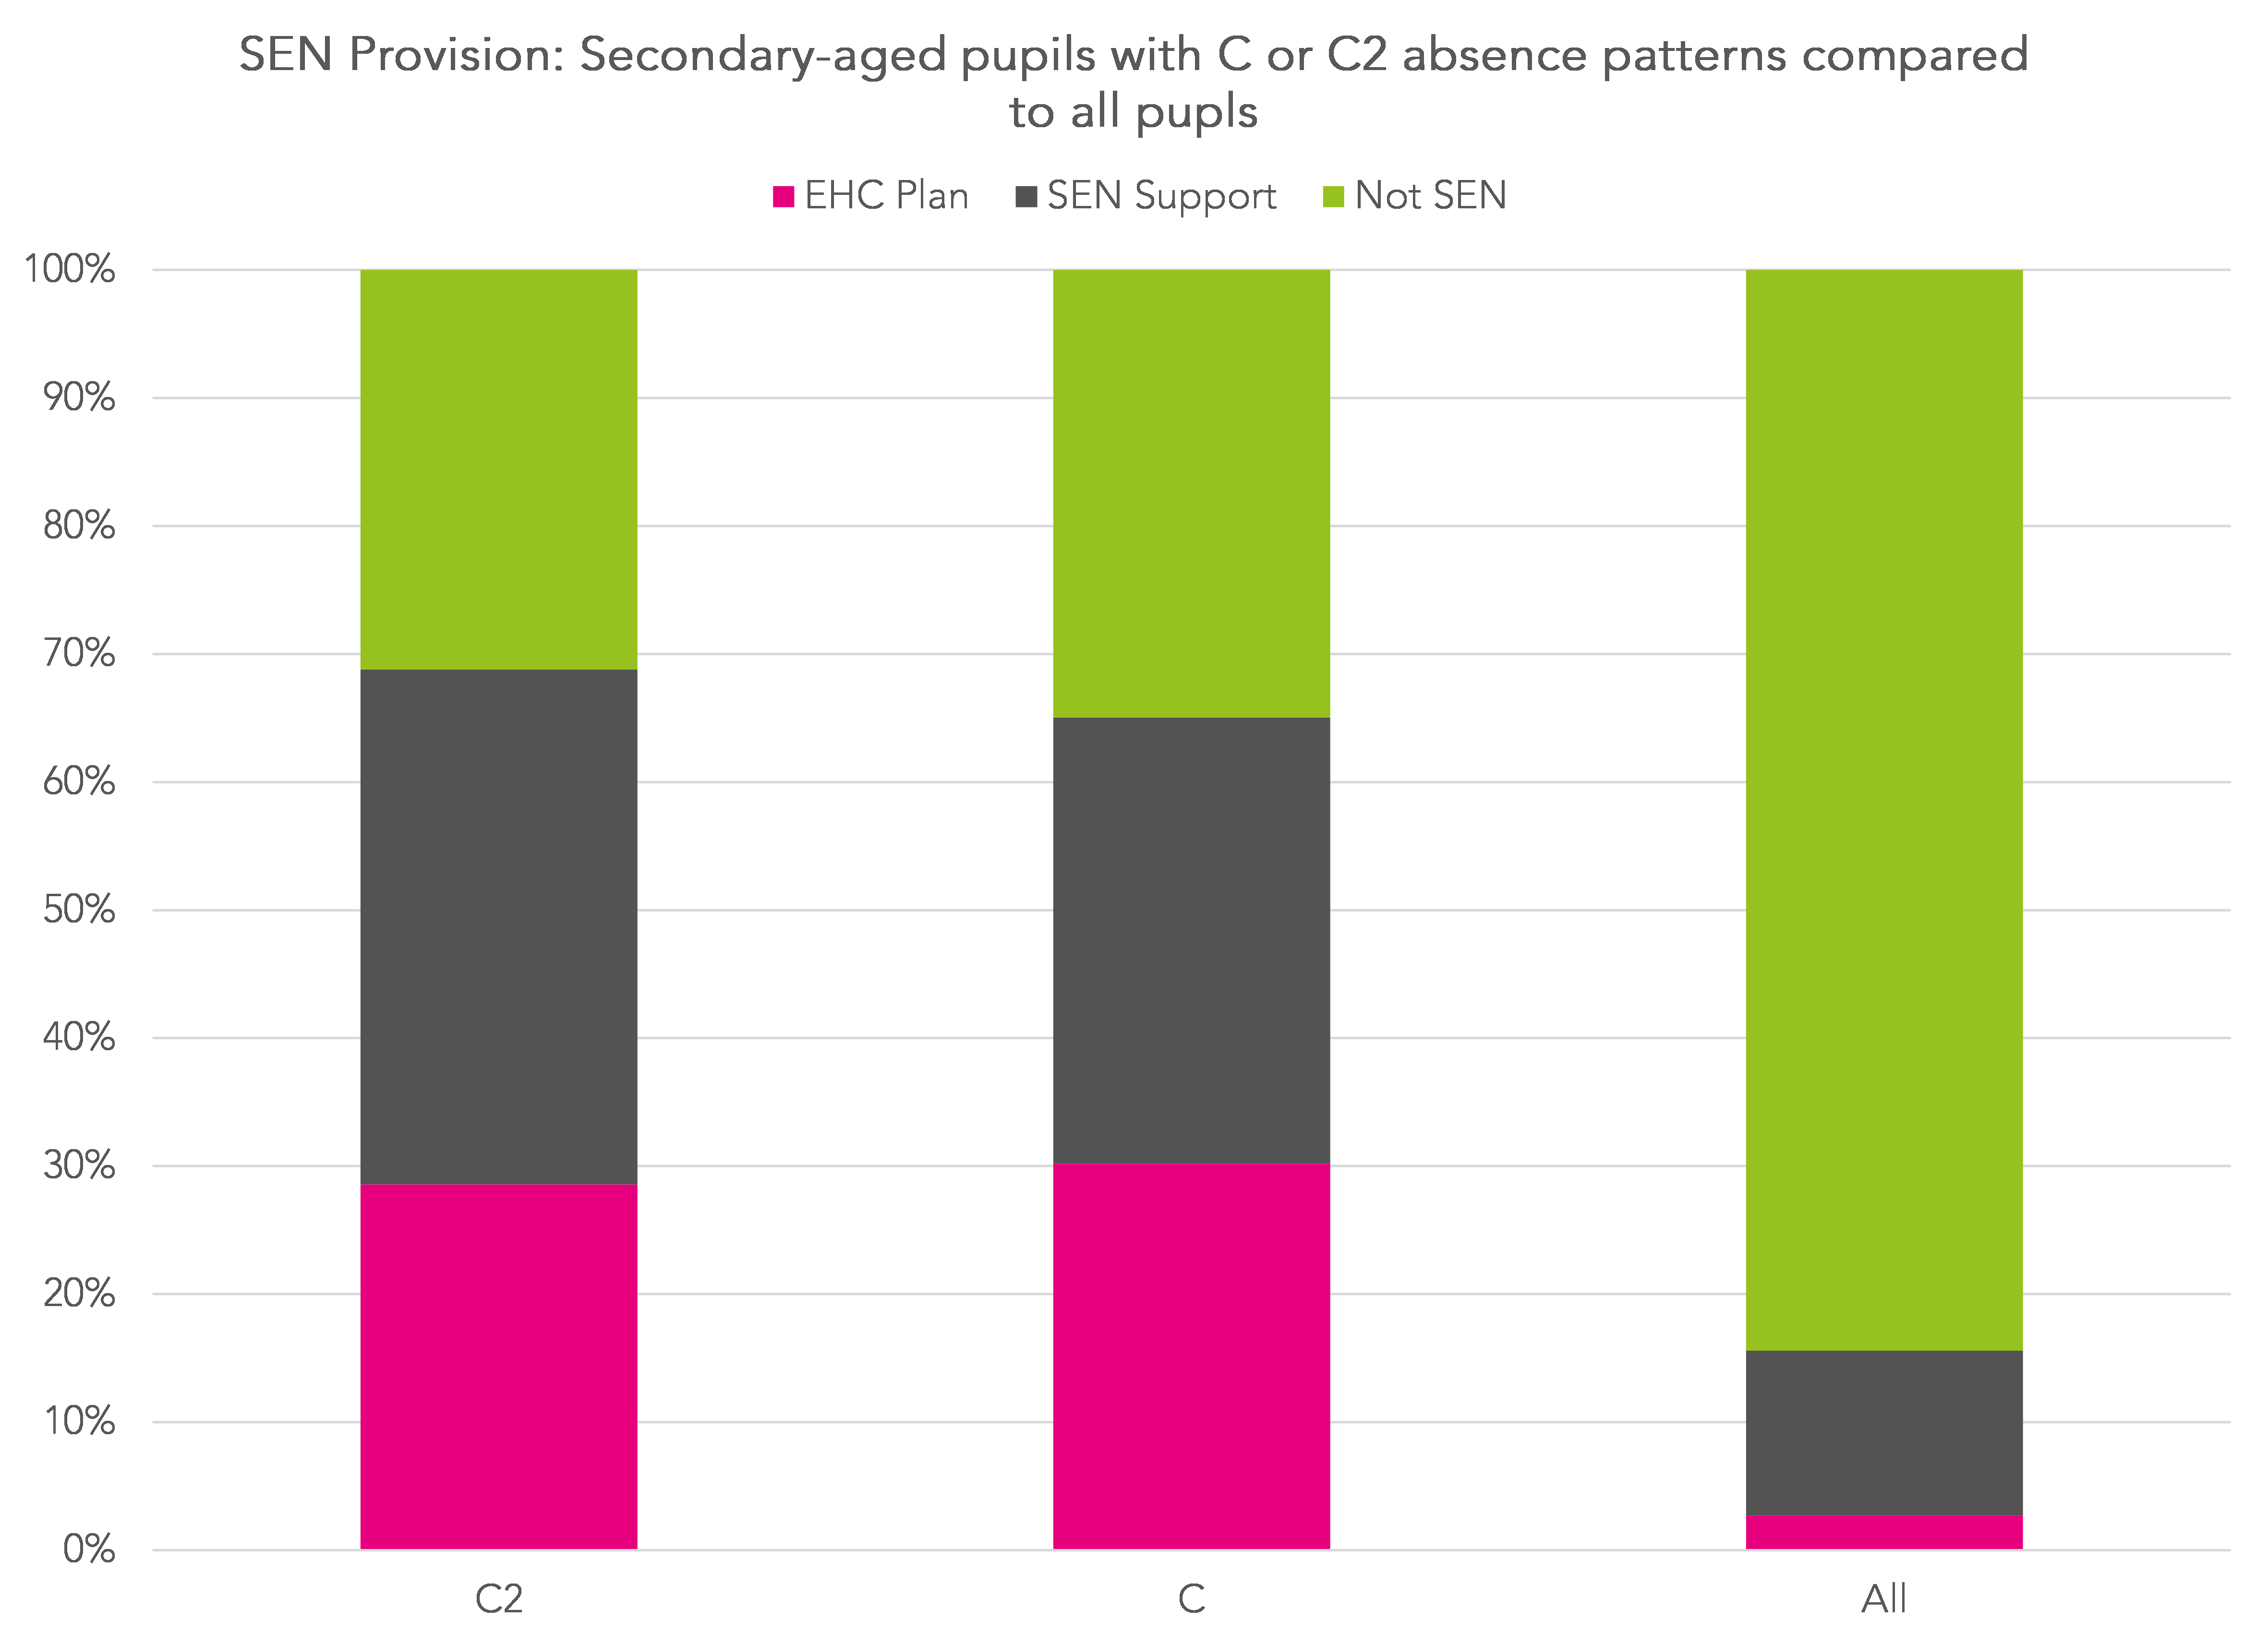
Among secondary-aged pupils, those with C2 or C absence patterns are also more likely than not to be identified as having SEN but the prevalence of SEN is lower than among primary-aged pupils and there is little difference in SEN identification between those with C2 patterns and those with C patterns.
Summing up
Based on our analysis of school attendance registers for the Autumn term, we think that there were something like 39,000 to 43,000 pupils who had a part-time timetable.
These figures cover (almost) the whole of the term rather than being a snapshot of the number on a part-time timetable on any given day.
We split the pupils on part-time timetables into two groups depending on how their absences from school are recorded. We estimate there were between 29,000 and 32,000 pupils whose absences are coded as C2. This is the code the official guidance suggests is used where the part-time timetable is intended to be a short-term measure to meet a pupil’s needs.
12,000 to 14,000 pupils had what we call a C pattern, that is to say their absences were recorded using code C. Some of these will have flexi-school arrangements in which they remain in full-time education but only attend school part-time.
These numbers are much smaller than we might have expected. A recent Schools Week article reports that a flexi-schooling group on Facebook has 25,000 members although this does not necessarily mean that all the members have (or look after) children who have flexi-school arrangements.
Nonetheless, it is worth re-iterating that we have made assumptions to arrive at our estimates. We are assuming that schools are using code C2 in line with the official guidance on managing attendance and code C for pupils with flexi-schooling arrangements.
It may well be that some of the pupils with C2 patterns have flexi-school arrangements, and it may well be that some schools are recording part-time timetables and flexi-schooling in other ways.
- Data on the full population is taken from national statistics on SEN
Want to stay up-to-date with the latest research from FFT Education Datalab? Sign up to Datalab’s mailing list to get notifications about new blogposts, or to receive the team’s half-termly newsletter.


Hi there,
As a Virtual School Head I’m really interested to understand the social care profile of these children and whether there is any disproportionality at play. I would expect there is. Although this may seem a small cohort, the impact of a reduced offer for a fostering family can be the final straw and can lead to children no longer being to sustain those important stable, caring fostering homes.
Any analysis for this group of children – in care, have or ever had a social worker, previously in care – would be very welcome and made good use of by every Virtual School Head to benchmark in their own LA and also, as a representative of the National Association of Virtual School Heads, would be a great piece of data to share.
Please don’t hesitate to contact me should you wish.
Jancis
Hi Jancis. Many thanks for taking time to comment. I would if I could is the short answer. Without boring you with the detail, the data we use for our analysis of absence data is taken directly from schools, and data on social care is not contained within it. So at the moment it’s not something we could do.
Hi, I am trying to use your data to compare the amount of C2 students in one specific school, for this I woul dneed the number of students that were used in this study who were C2 for each year group. Is it possible for you to provie this?
Hi Daisy. Sure. Send us an email at educationdatalab@fft.org.uk and I’ll ping you back.