As part of a push to improve pupil attendance, the DfE has provided secondary schools with Year 6 attendance data for their prospective Year 7s for the first time this year.
We thought it would be useful for schools receiving this data to have some extra context. Should they be focussing their attention only on pupils who missed at least 10% of sessions in Year 6, for example? Or should they also be concerned about lower rates, above 5%, perhaps?
To answer these questions, we’ll be using data from our Attendance Tracker schools. As most pupils change schools between Year 6 and Year 7, we’re limited to those who attended an Attendance Tracker school in both years – around 200k pupils, or just under a third of all Year 7 pupils in state-funded schools. We match pupils’ absence rates across the whole of Year 6 in 2023/24, with the first two terms of Year 7 in 2024/25. We add a condition that pupils must have at least 20 weeks of absence data in Year 6, and at least 10 weeks in Year 7.
Correlation
We’ll start with a simple calculation: the correlation between pupils’ absence rates in Year 6 and Year 7. The closer this value is to one, the stronger the relationship.
Running the calculation gives us a correlation coefficient of 0.63. This suggests a reasonably strong relationship[1]. It is, of course, not perfect, meaning that there are plenty of pupils with high absence rates in Year 6 and low rates in Year 7, and vice versa.
Year 7 absence by Year 6 absence
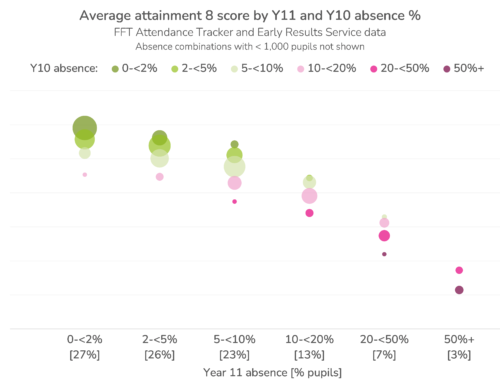
Now let’s look at this relationship in more detail. We first group pupils by the percentage of sessions they missed in Year 6 and Year 7. Then, we plot the percentage of pupils with a particular absence rate in Year 6 (along the horizontal axis) who fell into different absence groupings in Year 7 (the points). The figures are available to download here (xlsx).
To aid interpretation, we add a dotted line to indicate 50% of pupils, and a shaded area covering 25% to 75% of pupils.
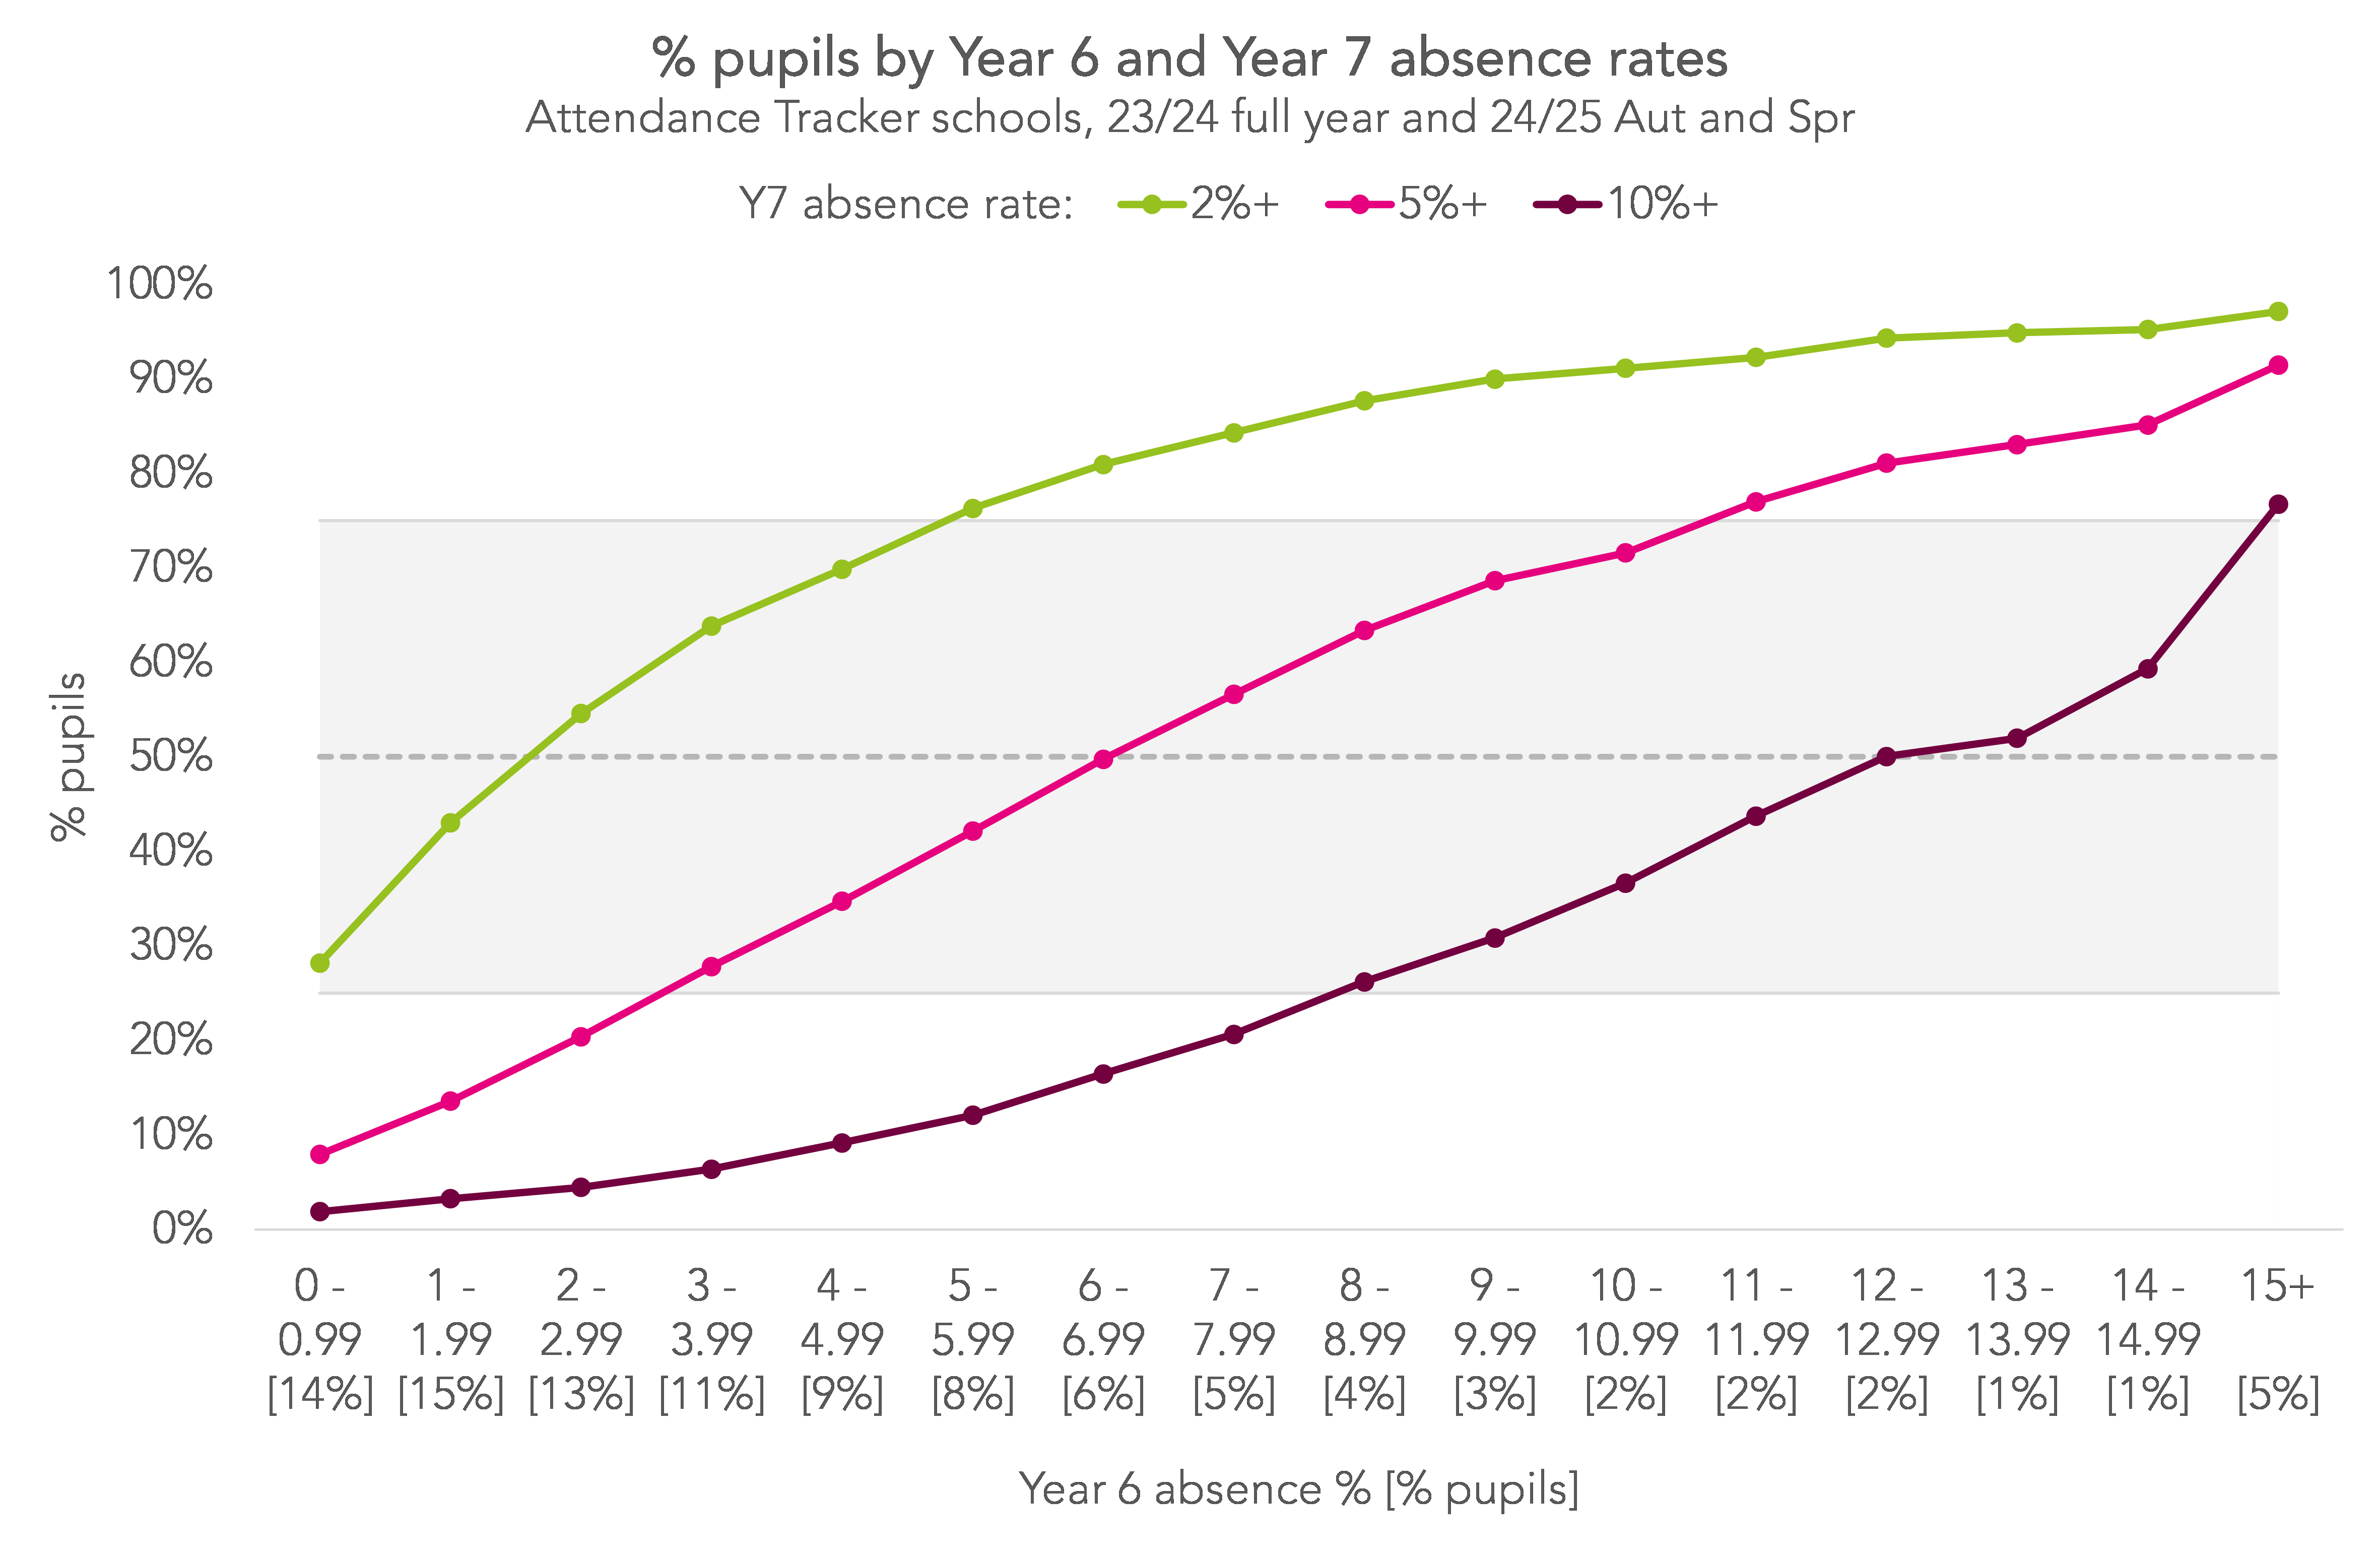
Broadly, and as expected given that we know the two quantities are correlated, having a higher rate of absence in Year 6 meant a greater risk of having a high rate in Year 7.
Looking at the darkest line, we see that the chances of being persistently absent in Year 7 (missing at least 10% of sessions) were 50% or higher for pupils with Year 6 absence rates of around 13% and above. In other words, pupils with a Year 6 absence rate of at least 13% were more likely than not to be persistently absent in Year 7. Pupils with absence rates between 8% and 12% in Year 6 had a 25% to 50% chance of being persistently absent in Year 7.
Although pupils with low absence in Year 6 were relatively unlikely to be persistently absent in Year 7, some were. Those with an absence rate of 4-5% in Year 6 had a 9% chance, and those with an absence rate of 2-3% in Year 6 had a 4% chance.
Turning to the other end of the spectrum – the chances of having very low absence rates in Year 7. Pupils who missed no more than 1% of sessions across Year 6 had a 92% chance of missing less than 5% of sessions across Year 7 (100% minus the chances of missing 5% or more, 8%). They had a 62% chance of missing less than 2%.
The point at which pupils became more likely than not to miss at least 2% of sessions in Year 7 occurs somewhere between 2 and 3% of sessions missed in Year 6. The point at which pupils became more likely than not to miss at least 5% of sessions occurs between 6 and 7% of sessions missed in Year 6.
In the same way that there were pupils with low rates of absence in Year 6 who went on to have high absence in Year 7, there were also pupils with high rates of absence in Year 6 who went on to have low rates in Year 7. For example, 8% of pupils who missed between 11 and 12% of sessions in Year 6 missed less than 2% in Year 7.
Sign up to our newsletter
If you enjoy our content, why not sign up now to get notified when we publish a new post, or to receive our half termly newsletter?
Persistent absence chances by pupil group
Now we’re going to repeat the same analysis, but this time we’ll focus only on the chances of being persistently absent in Year 7, missing 10% of sessions. And we’re going to break the data down by pupil characteristics.
Below, we plot the chances of being persistently absent in Year 7 by Year 6 absence rate and disadvantage, measured by free school meal eligibility in the last six years (FSM6).
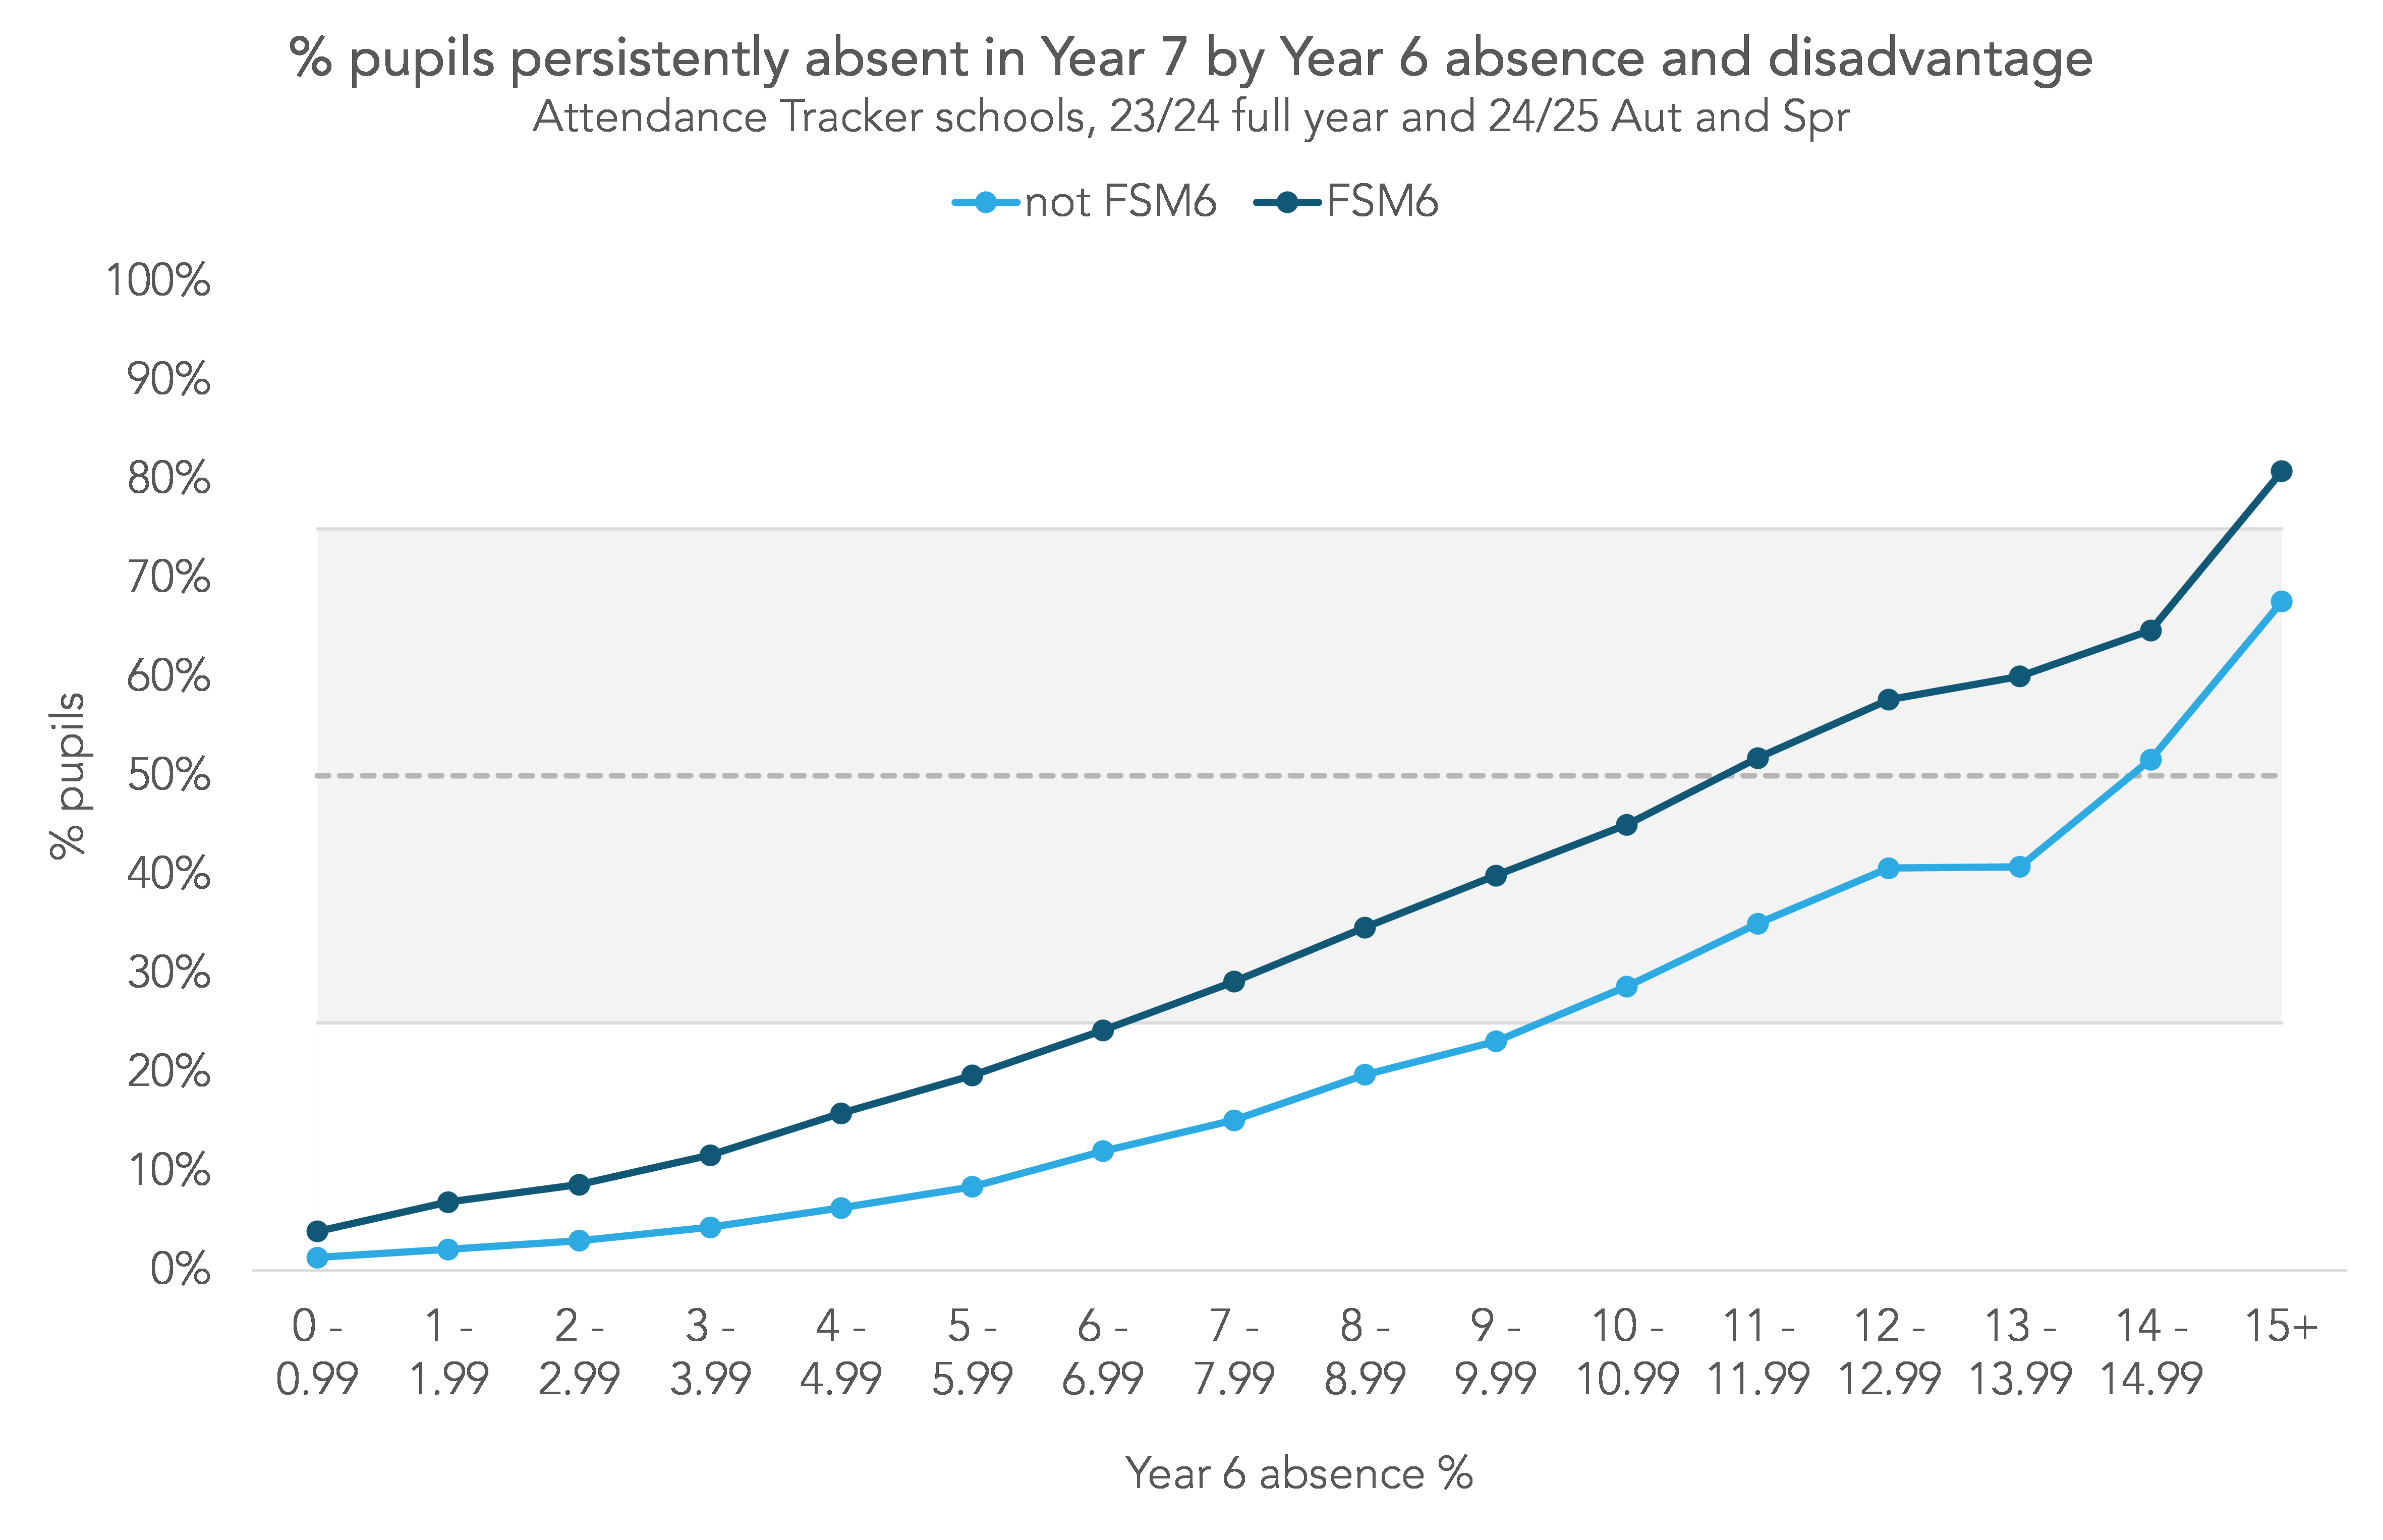
For both groups of pupils, the chances of being persistently absent in Year 7 increased with increasing Year 6 absence. However, the FSM6 line is consistently above the non-FSM6 line. This tells us that FSM6 pupils had a higher chance of being persistently absent in Year 7 than non-FSM6 pupils with the same Year 6 absence rates.
For example, 6% of non-FSM6 pupils with a Year 6 absence rate between 4 and 5% went on to be persistently absent in Year 7, compared with 16% of disadvantaged pupils with the same Year 6 absence rates.
For FSM6 pupils, the point at which they became more likely than not to be persistently absent in Year 7 came at a Year 6 absence rate of 11-12%. For non-FSM6 pupils, it was 14-15%.
We see a similar picture when we look at pupils with education health and care plans (EHCPs) in Year 6, though the difference between those with and without EHCPs is smaller than between FSM6 and non-FSM6 pupils (the line is also less smooth for pupils with EHCPs because there are fewer of them in our sample – around 7k in total):
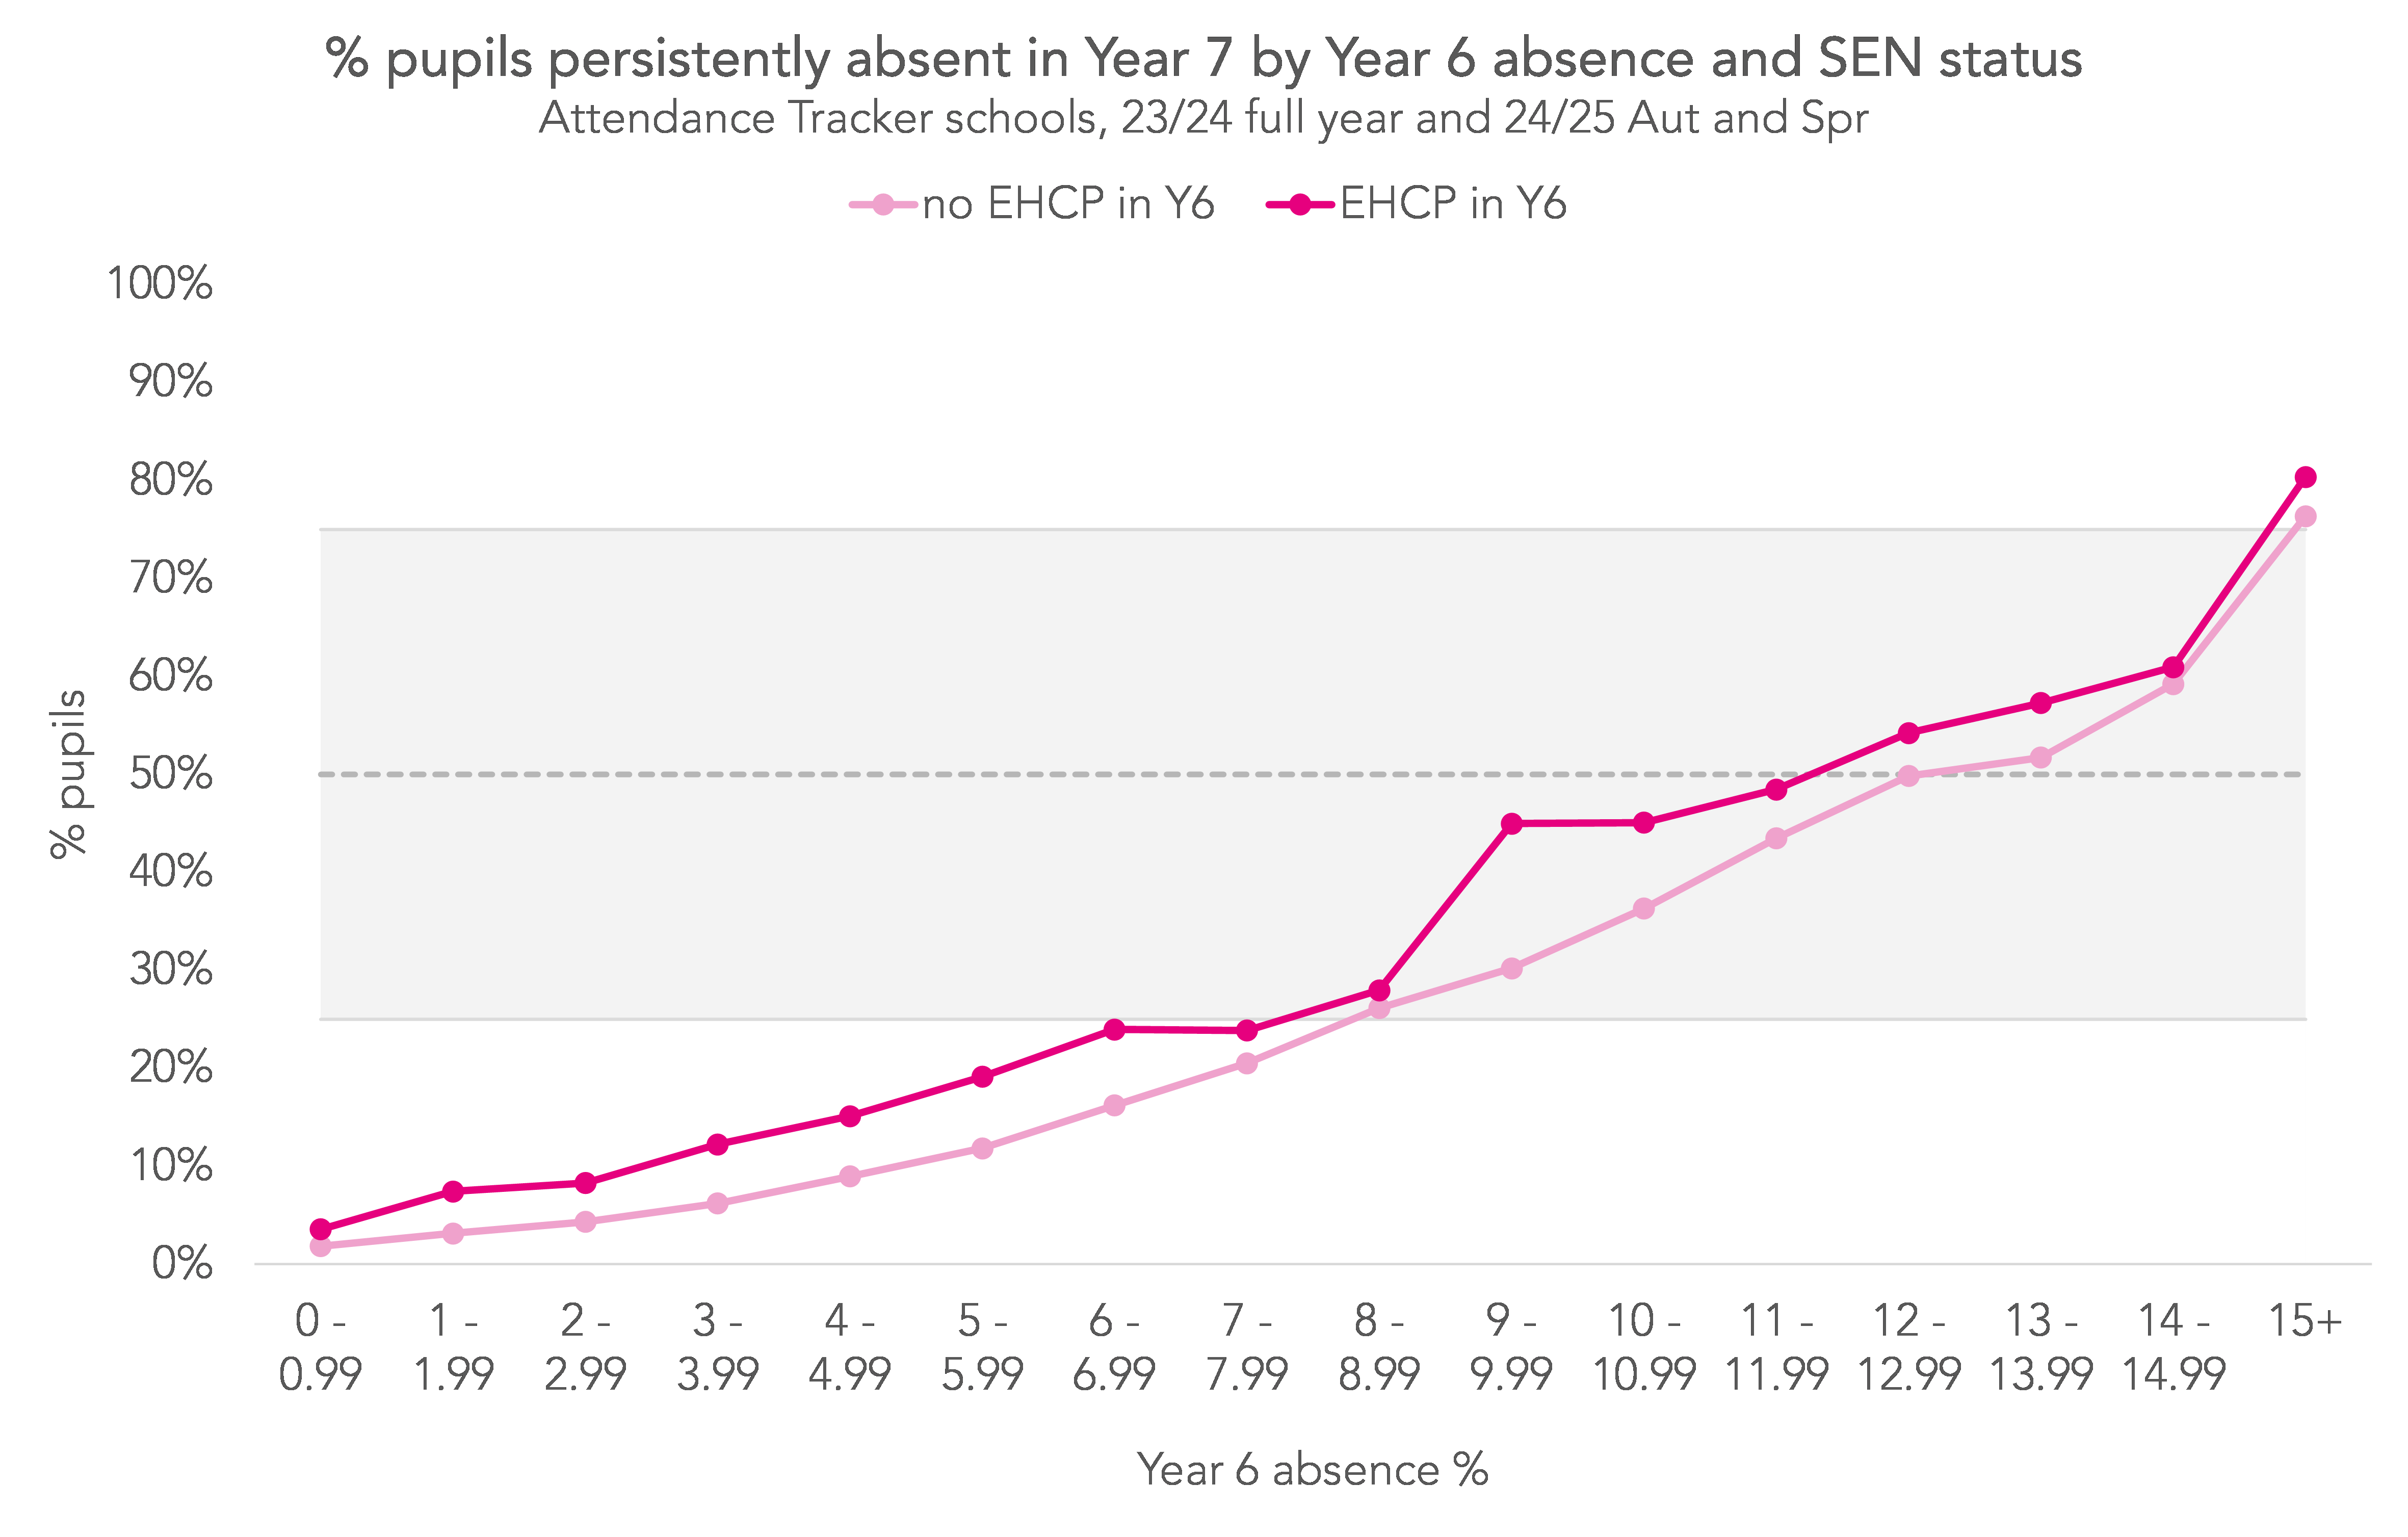
9% of pupils without an EHCP in Year 6 and an absence rate between 4 and 5% went on to be persistently absent in Year 7, compared with 15% of those with an EHCP.
Finally, we make the same comparison by gender:
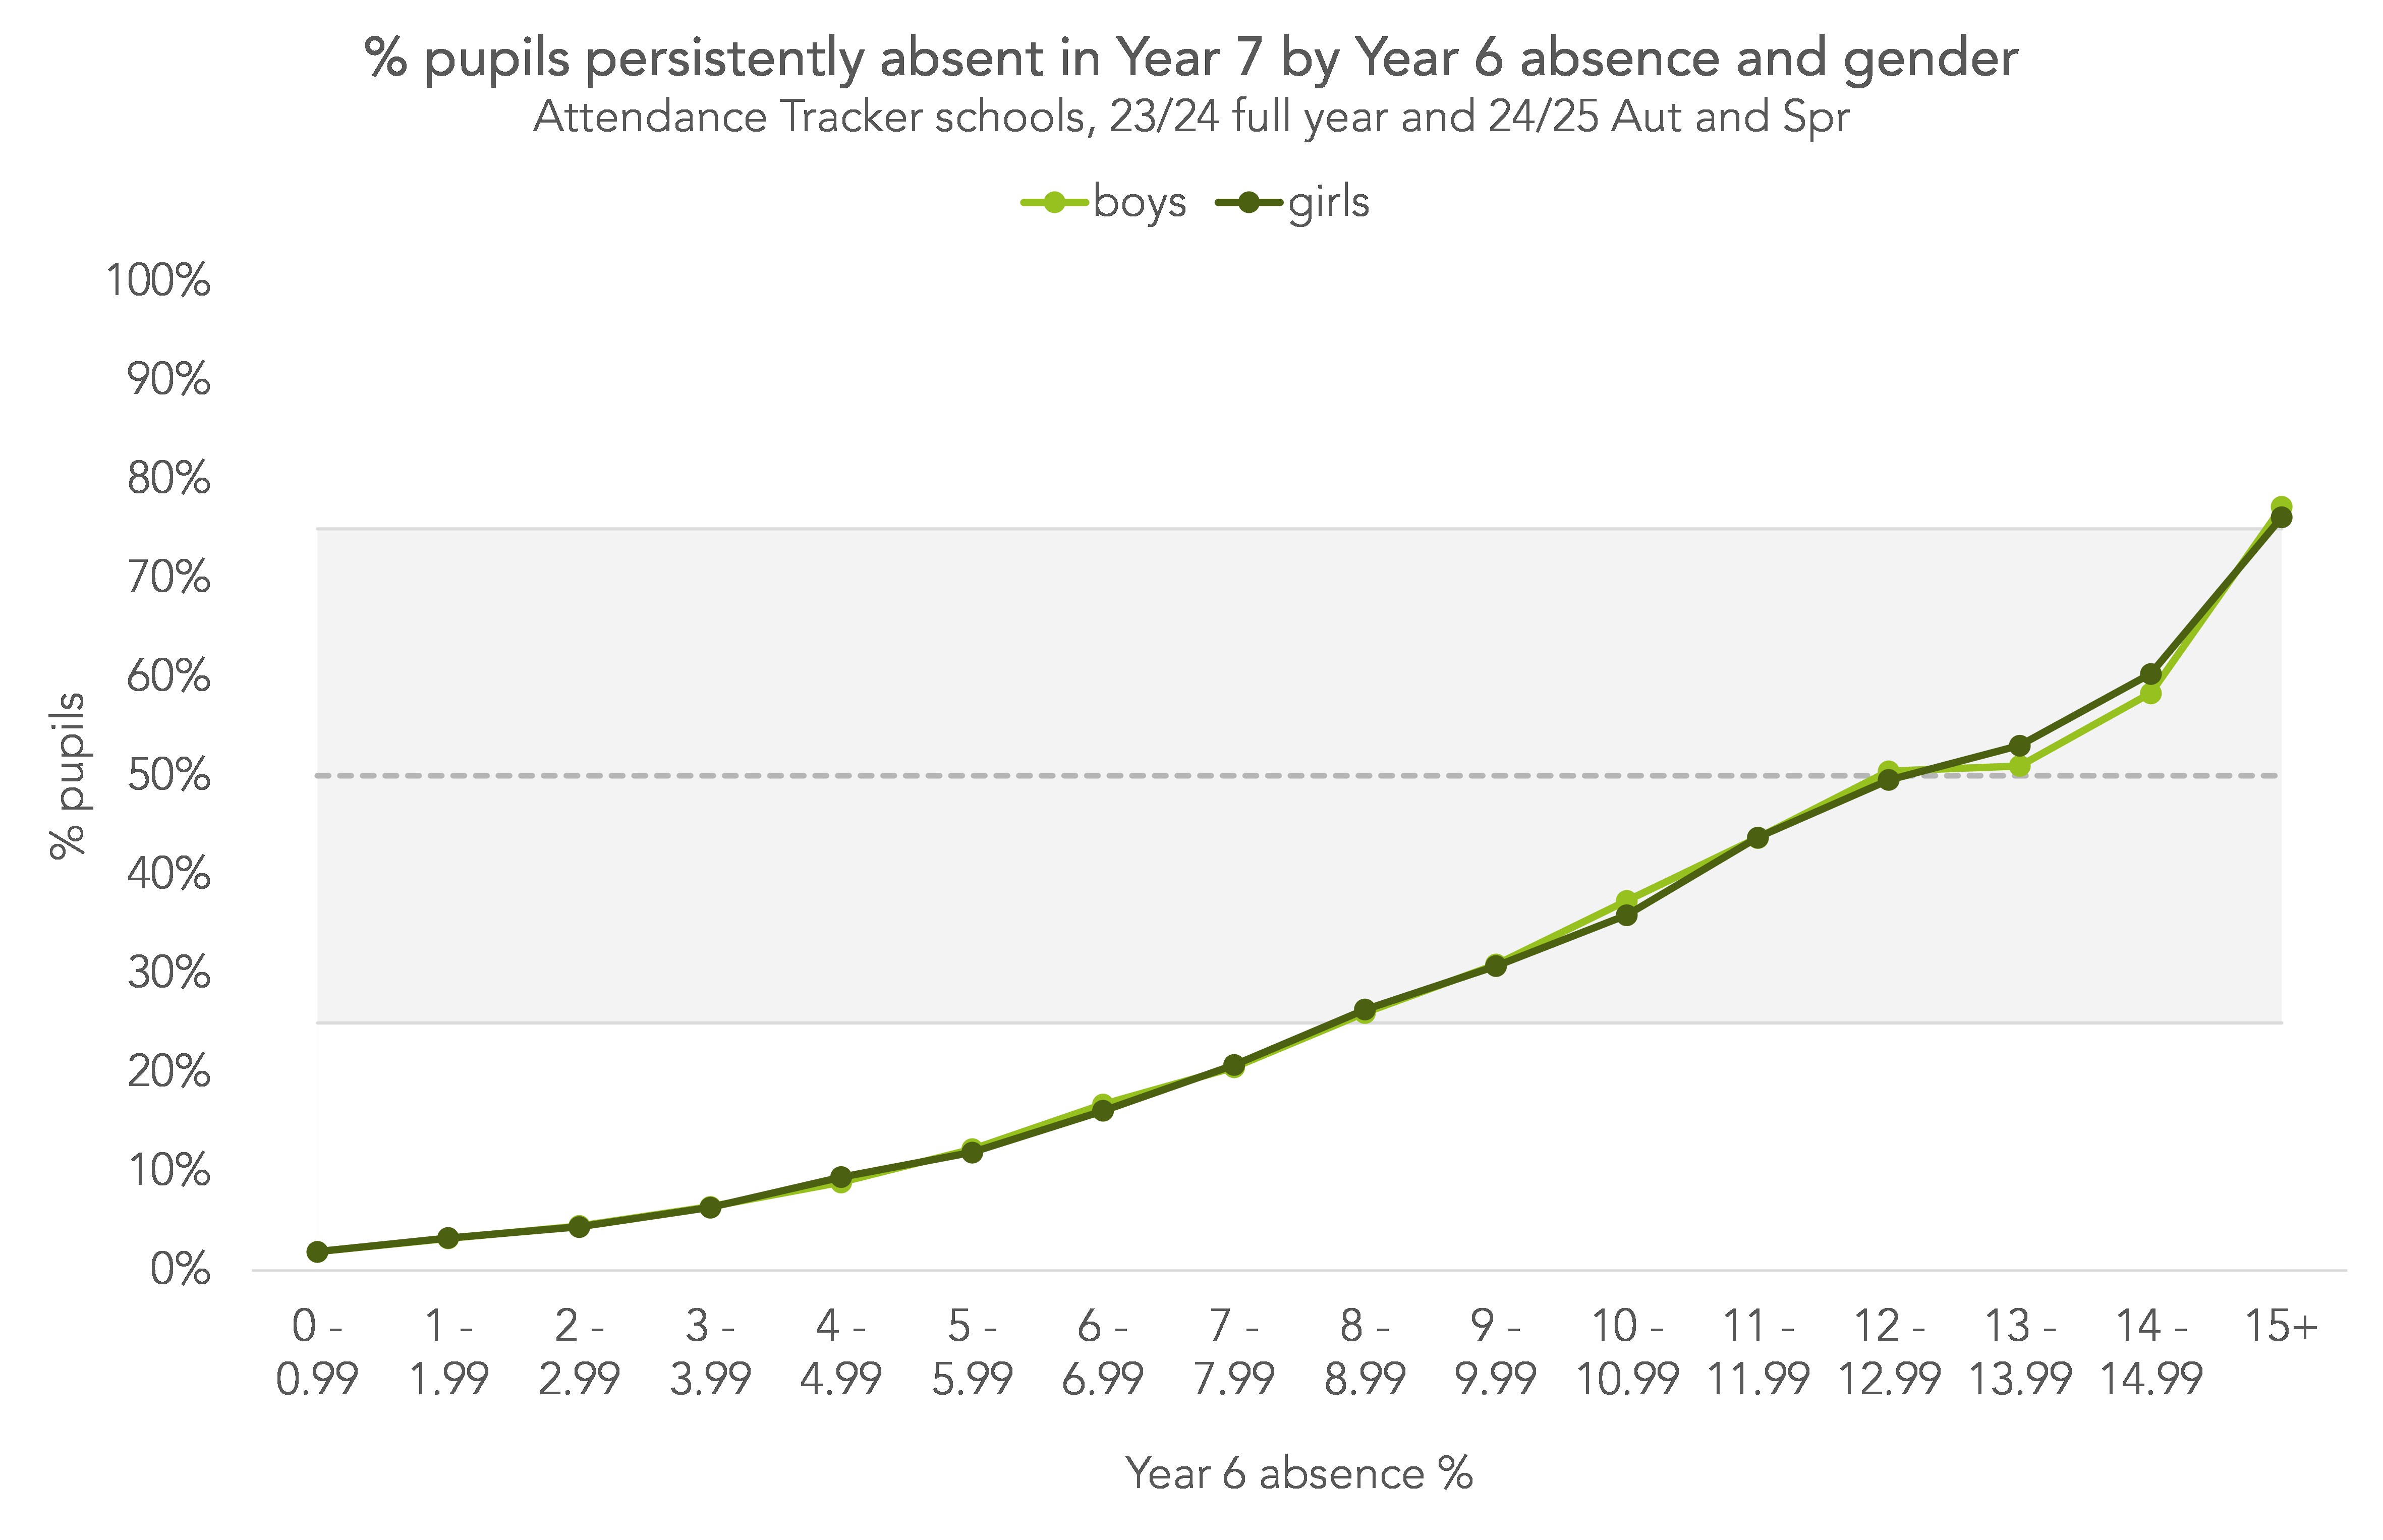
Here, we find that girls and boys with the same Year 6 absence rates had the same chances of being persistently absent in Year 7.
A note on severe absence
We’re not able to show the chances of being “severely absent” in Year 7 – missing at least 50% of sessions, or being absent more than present – in the same level of detail because of the small numbers of pupils involved. But we can provide some broad figures:
Of the 2,500 pupils in our sample who experienced severe absence in Year 7, 18% had also been severely absent in Year 6. 61% had been persistently absent, but not severely absent. 13% missed between 5 and 10% of sessions in Year 6, and the final 7% missed less than 5%.
Summing up
There is a clear relationship between absence rates in Year 6 and 7. Pupils with high absence rates in Year 6 tended to have high rates in Year 7. (Though it’s important to bear in mind that this relationship isn’t deterministic – there are plenty of pupils with high absence in Year 6 and low absence in Year 7, and vice versa.)
We’ve not found a “magic” number for schools to use to identify pupils at particular risk of persistent absence in Year 7. But we have hopefully provided some rough guidelines: in the current Year 7 cohort, those who missed between 8 and 12% of sessions in Year 6 had a 25 to 50% chance of being persistently absent, and those who missed more than 12% of sessions had at least a 50% chance.
We’ve also seen that disadvantaged pupils had a higher risk of persistent absence than non-disadvantaged pupils, even when they had identical Year 6 absence rates. The same was also true for those with EHCPs in Year 6. We would therefore suggest that, if schools are using Year 6 absence rates to identify those at higher risk of persistent absence in Year 7, that they consider using a slightly lower threshold for disadvantaged pupils and those with EHCPs.
[1] For context, the correlation between Key Stage 2 and Key Stage 4 attainment is around 0.75.


Thanks Katie
Useful, interesting and timely! (I don’t think I’ve ever hit the trifecta)