Foundation Stage Profile assessments were first collected for the whole cohort in England in 2006/07. This means that those completing Key Stage 4 in 2017/18 were the first for which we can link assessments at Foundation Stage and Key Stages 1, 2 and 4.
What is the relationship between assessments at different Key Stages?
And how do they vary for different groups of pupils?
The relationship between assessments at different Key Stages
Of the 511,000 pupils in maintained secondary schools who completed KS4 in 2017/18, 453,000 (89%) can be matched to attainment data at Foundation Stage and also at Key Stages 1 and 2.
For attainment we’ll use:
- Foundation Stage: Foundation Stage Profile total score
- KS1 and KS2: average National Curriculum Level in reading and mathematics
- KS4: average score in the English and mathematics components of Attainment 8
The table below shows the correlation between prior attainment and outcomes for each combination of Key Stages. The closer figures are to 1, the greater the correlation.

As we would expect, correlation reduces as the length of time between two assessments increases.
The relationship between Foundation Stage and Key Stage 4 attainment
We’re now going to look in detail at the relationship between Foundation Stage and Key Stage 4 attainment, exploring how things vary by the following pupil characteristics:
- Gender
- Disadvantage: pupils are divided into five groups based on the percentage of time they have been eligible for free school meals during their time in school: 0% (referred to in the rest of this analysis as never FSM), 1-24%, 25-49%, 50-79%, 80% or more (referred to in the rest of this analysis as long-term disadvantaged)
- Impact of disadvantage: pupils are divided into two groups that we have defined in previous work, based on the impact that disadvantage seems to have: a high impact group, mainly consisting of white British pupils, and a low impact group, consisting of pupils of most other ethnicities
Based upon the above groupings, the highest attainment is associated with girls in the never FSM and low impact groups, and the lowest attainment is associated with boys in the long-term disadvantaged and high impact groups.
The chart below shows how attainment at KS4 (average English and maths GCSE grade) varies according to Foundation Stage score for these two sets of pupils, as well as for all pupils.
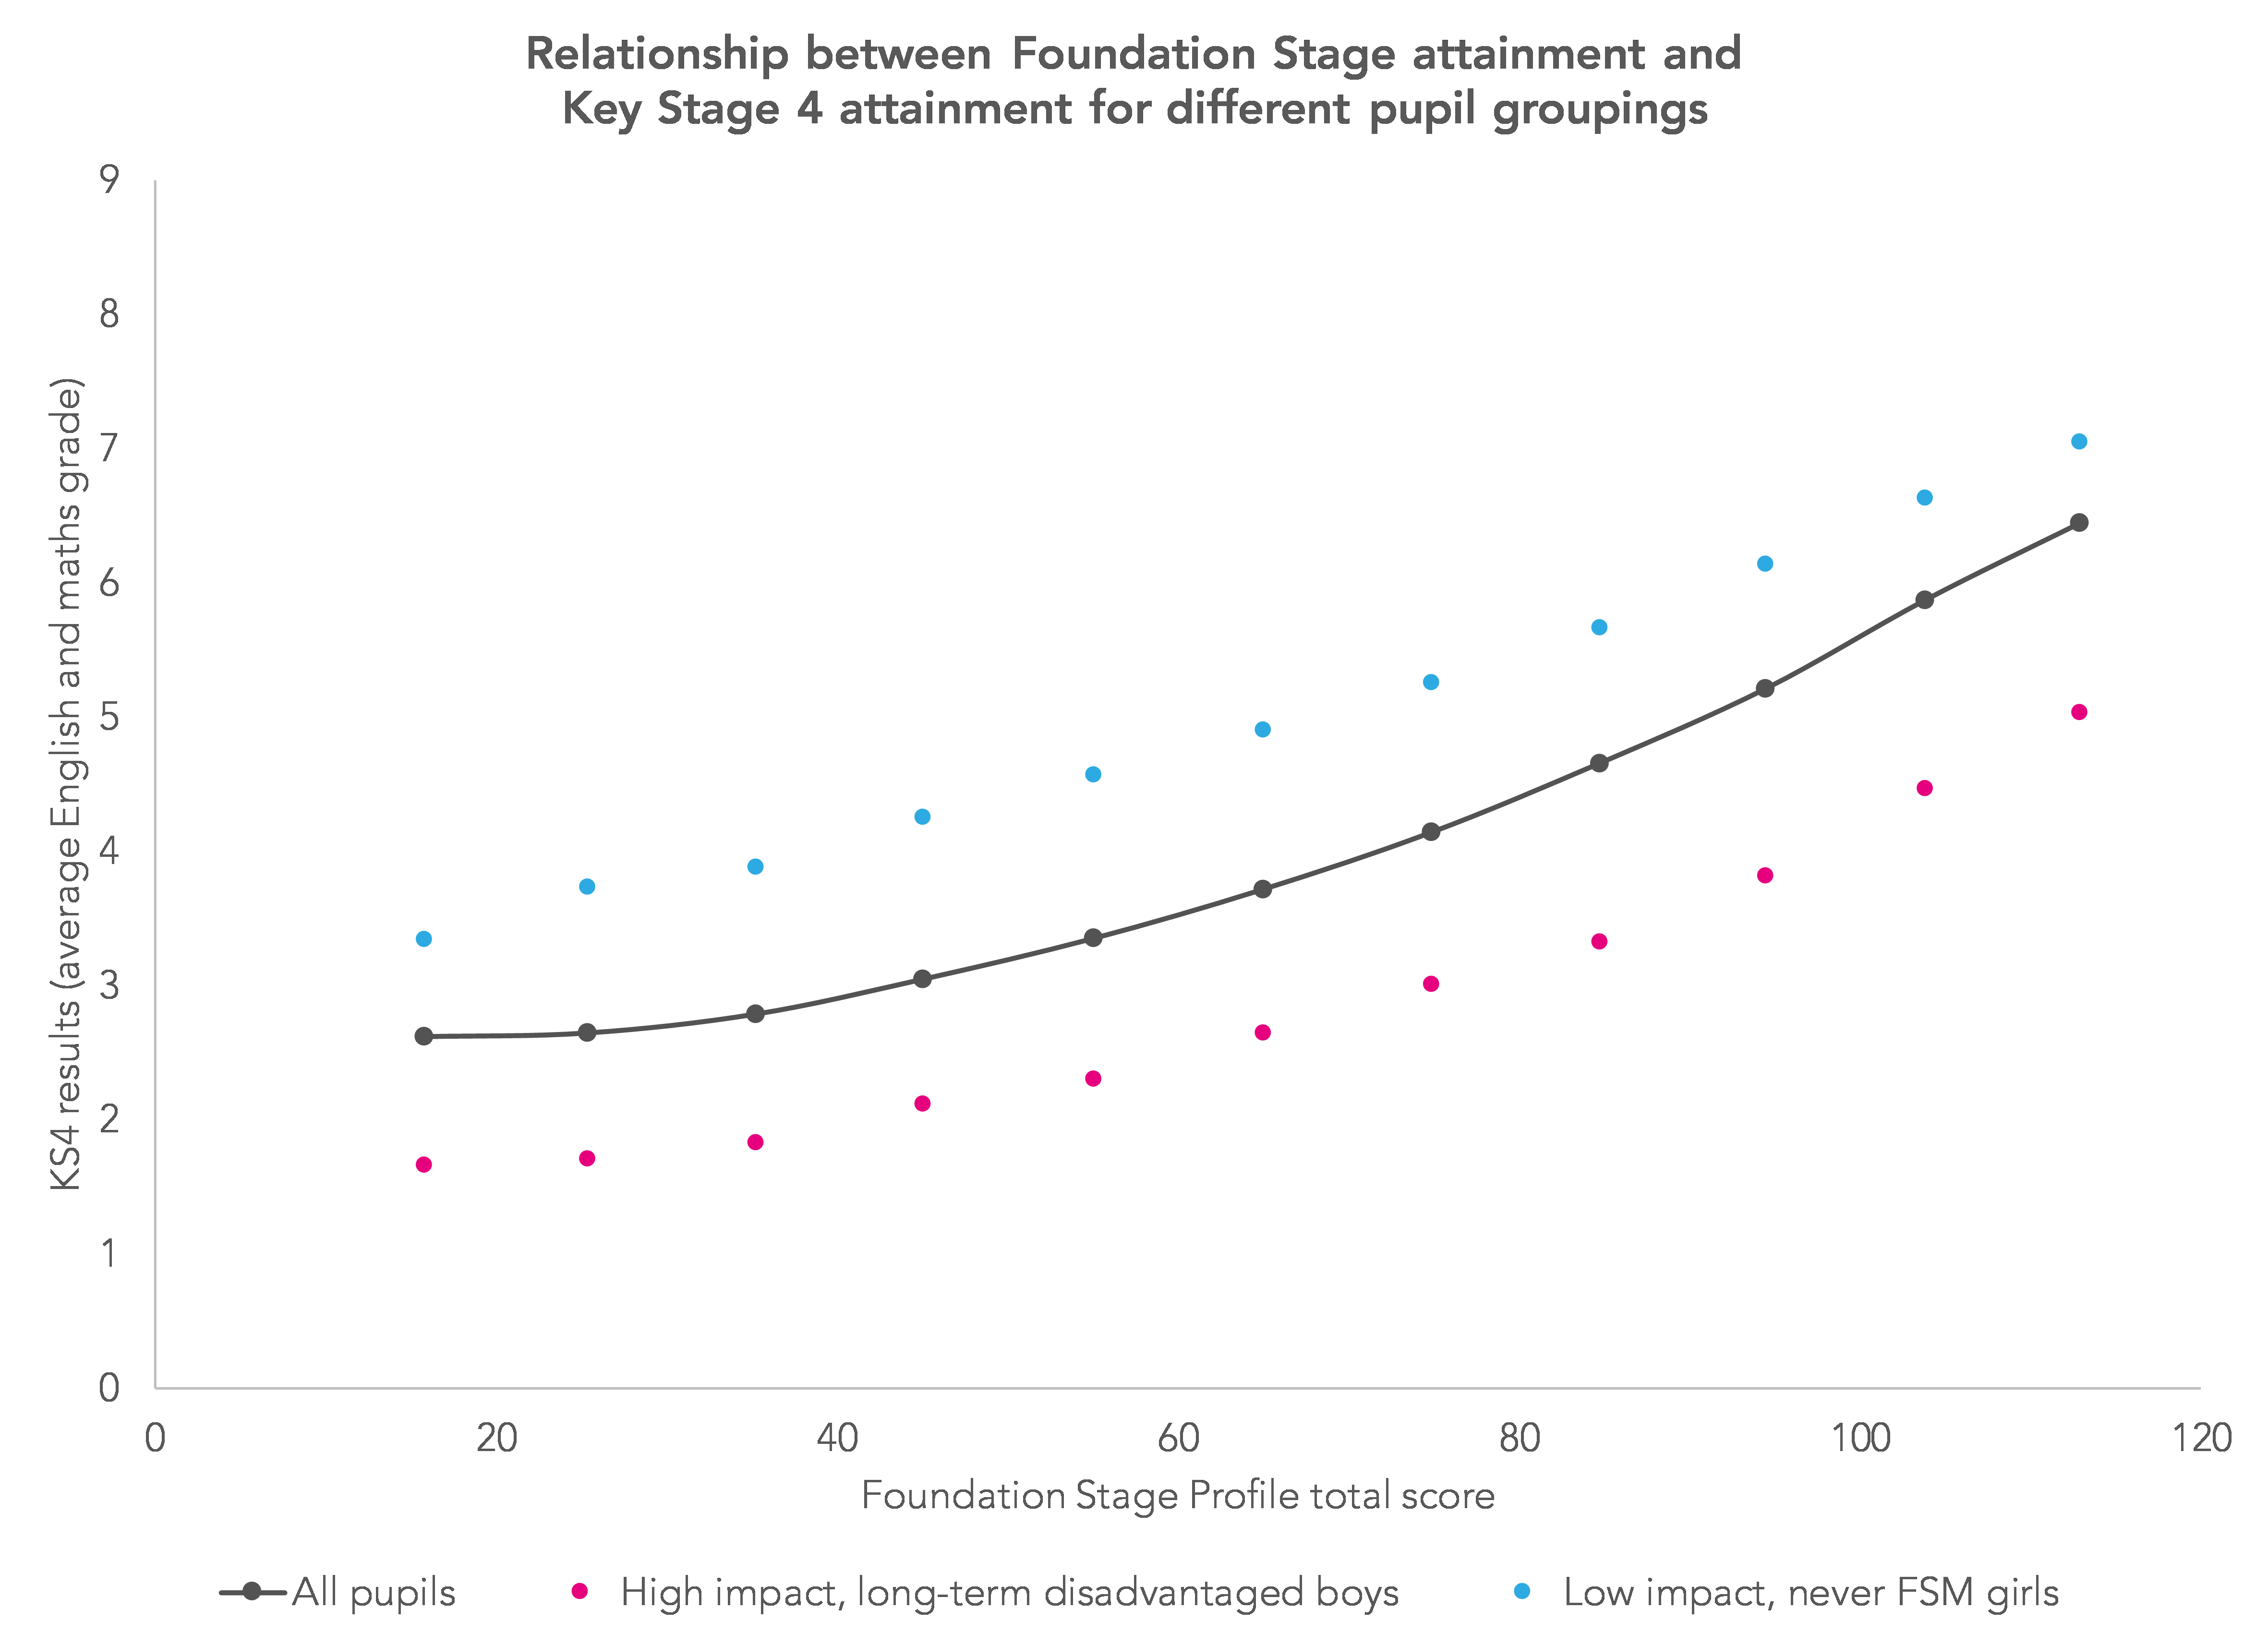
Apart from a slight narrowing at high levels of attainment, differences are fairly consistent. The lowest attaining group (boys, high impact, long-term disadvantage) attain around one GCSE grade lower than would be expected if they made average progress based on their Foundation Stage score.
A table showing this data for all combinations of characteristics is available here.
When do gaps emerge?
What happens if we break down the differences in progress for each Key Stage?
This can be done by calculating three value added scores:
- Foundation Stage to KS1 using Foundation Stage score linked to average level in reading and mathematics at KS1;
- KS1 to KS2 using average level in reading and mathematics at both KS1 and KS2;
- KS2 to KS4 using average level in reading and mathematics at KS2 linked to average GCSE grade in English and mathematics at KS4.
For each combination we can calculate a value added score for each pupil, then put them on a common scale (normalise them), to enable us to compare value added scores for each of these Key Stages.
The table below shows, for combinations based on two of our pupil groupings (disadvantage, and impact of disadvantage), the value added scores for each Key Stage combination.
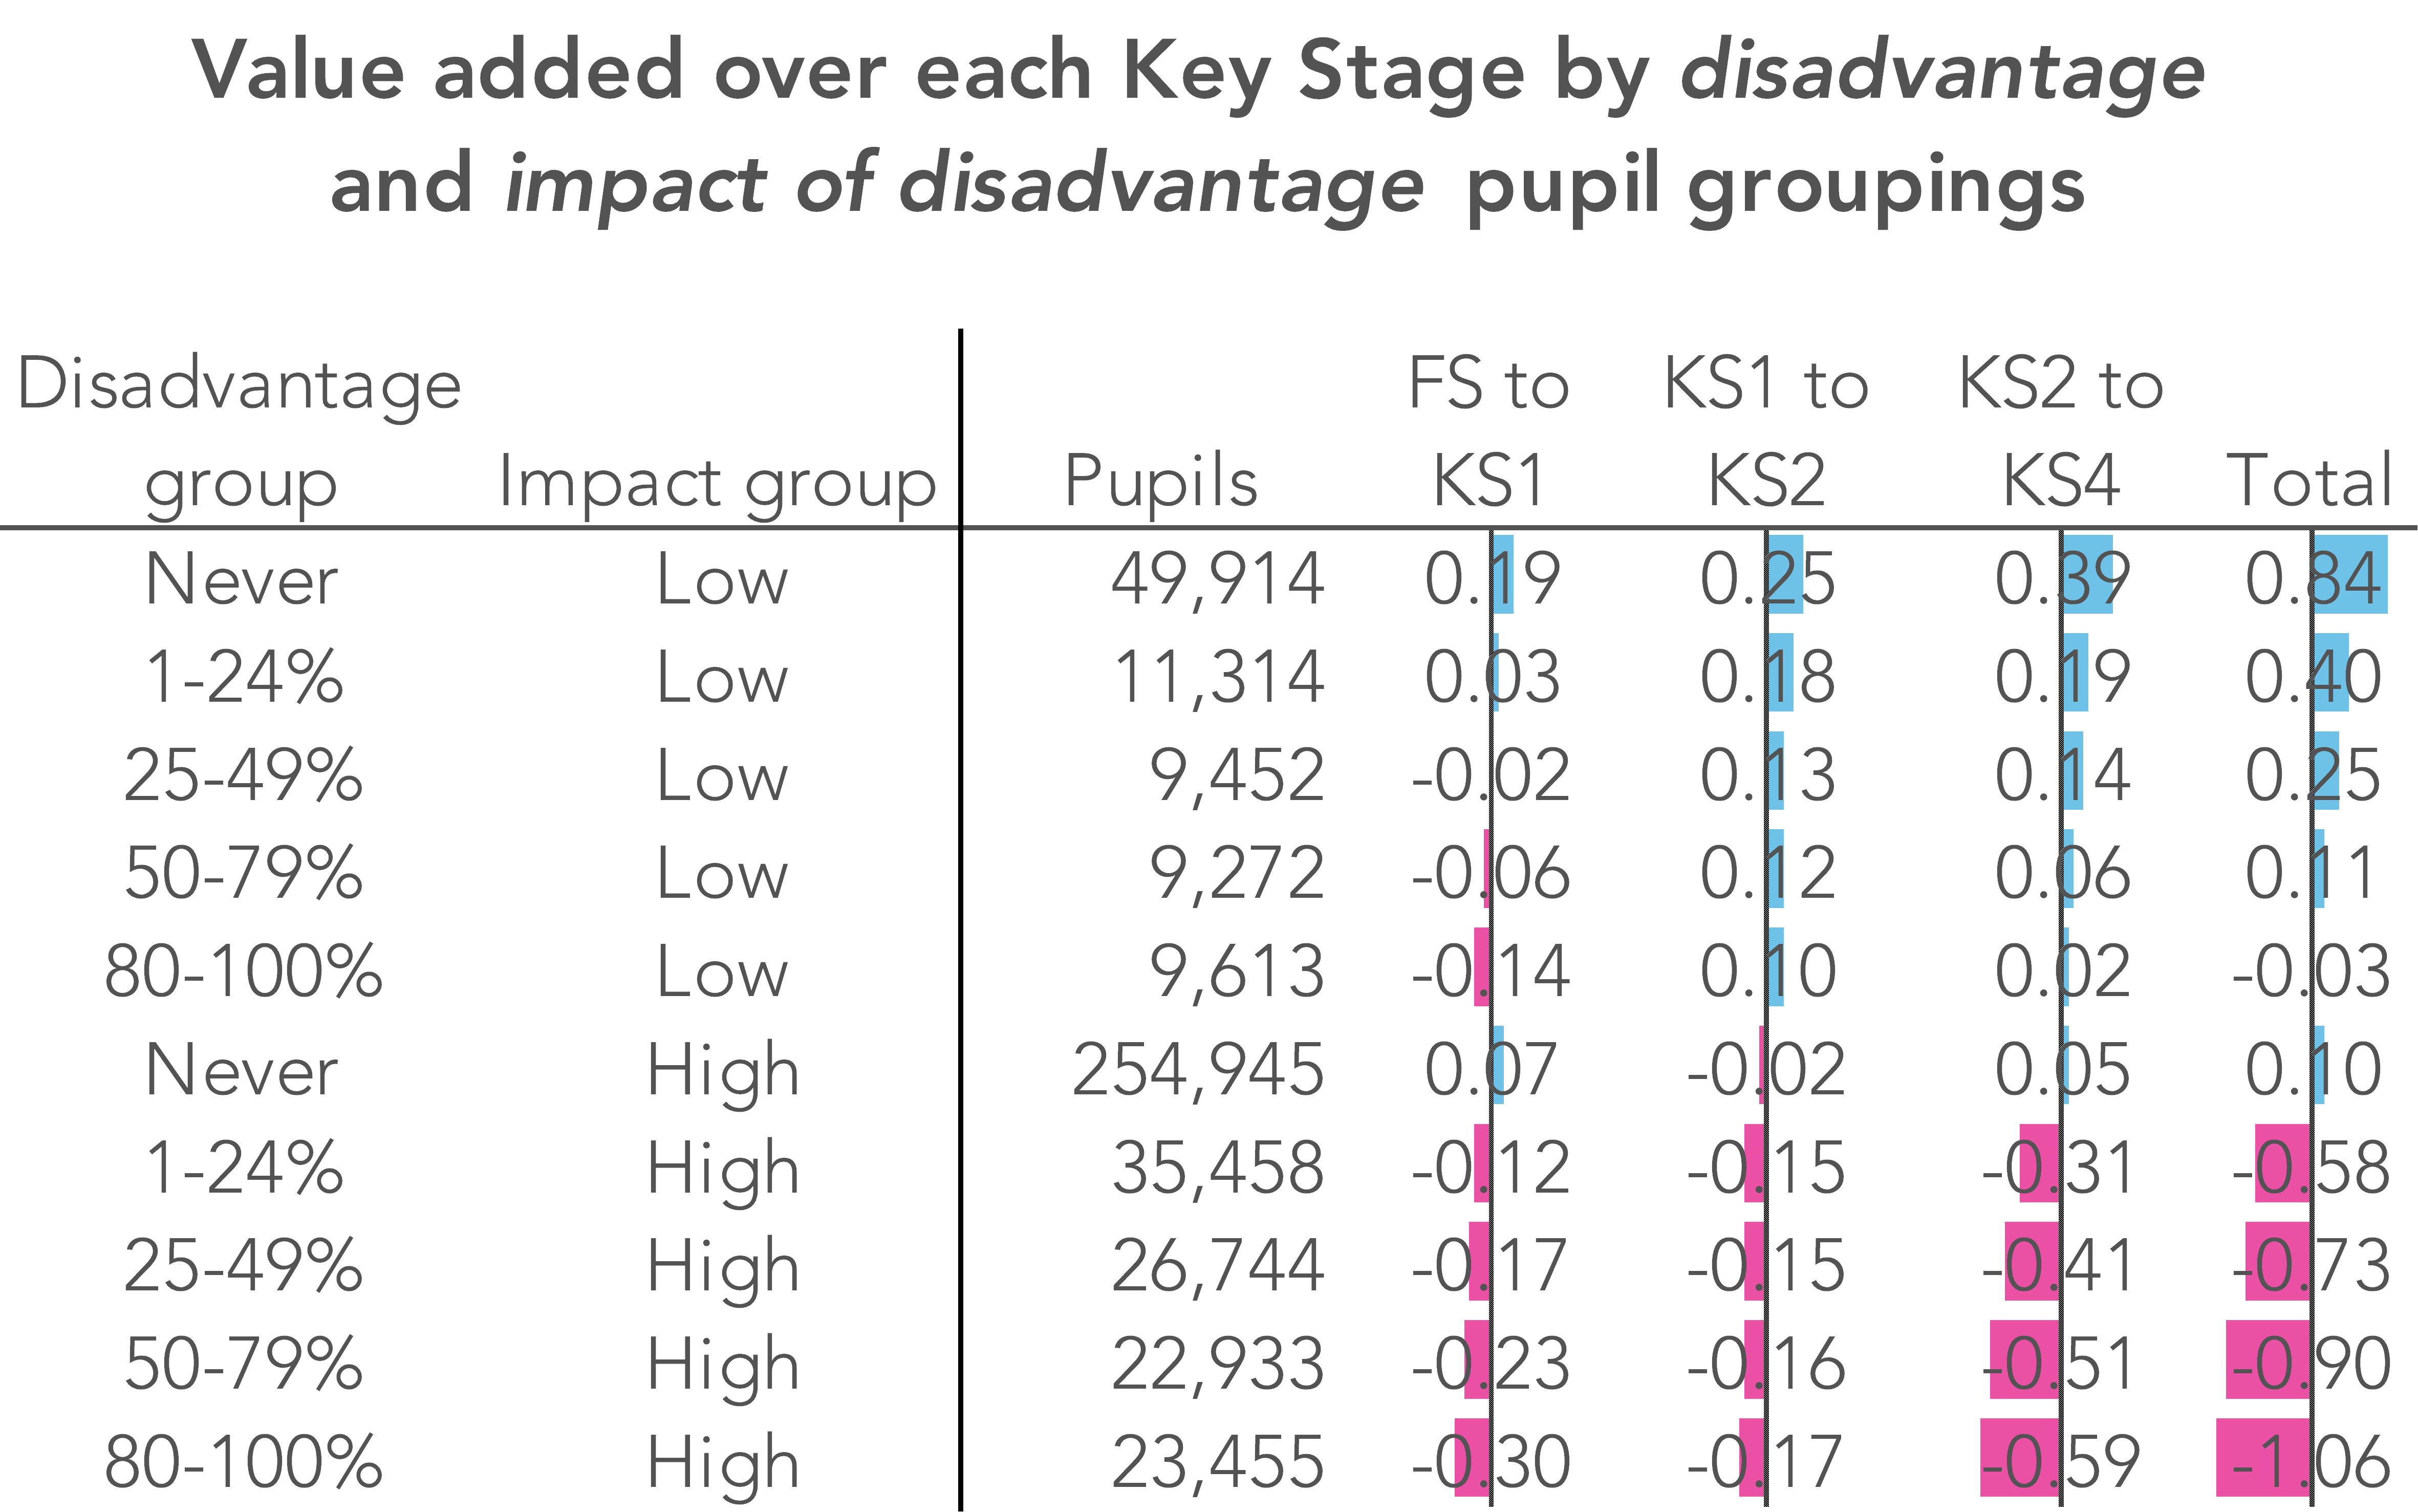
While largest differences occur between KS2 and KS4, it is interesting to note that the gaps between pupils tend to widen more from Foundation Stage to KS1 than they do from KS1 to KS2 for the group most impacted by disadvantage.
And this is even more apparent if we take into account the number of years in each stage (two for Foundation Stage to KS1; four for KS1 to KS2; five for KS2 to KS4). The table below shows the value added scores calculated for each year or the relevant stage. This shows that the impact per year is highest between Foundation Stage and KS1.

How much of the gap was present at the start of school?
It’s clear that differences in progress contribute substantially to differences in attainment by the end of KS4.
How much of that difference is there when pupils start school though? Take pupils who are long-term disadvantaged and in the high impact group – i.e. those most affected by disadvantage – as an example.
Their KS4 average grade in English and mathematics is 3.2; just over 1.6 grades below the national average for all pupils. At the same time, their average progress from Foundation Stage to KS4 is 1.1 grades below the average for all pupils. This means that around two-thirds of the attainment difference at KS4 can be explained by the progress they make from Foundation Stage to KS4 – with the remaining third already there by age five when the pupils are assessed for Foundation Stage.
Using data from the first of the two tables we can estimate the contribution made to attainment differences at KS4 by initial (Foundation Stage) attainment and subsequent progress through each Key Stage – shown in the chart below.

Want to stay up-to-date with the latest research from FFT Education Datalab? Sign up to Datalab’s mailing list to get notifications about new blogposts, or to receive the team’s half-termly newsletter.


I’m confused by what your first graph shows. Is it possible you have the colours the wrong way round?
Oops! You’re quite right. I’ve corrected it now. Thanks.
This is excellent and very clear, as usual. Is there a way we can see how disadvantaged our individual school cohorts are? Ie the percentages in each band?
Hi Chris. We’re aiming to get something into Aspire during this academic year.
A factor you have have not addressed is how progress from statutory assessment baselines is always less if there is a change in institution. For example KS2 progress from KS1 is less in junior schools than in primary schools and A level progress from KS4 is less from students that attended 11-16 schools than in 11-18 schools. The DfE recognises this and there is a note to this effect in its communications with Junior schools. The reason is that there is more incentive to inflate KS1 scores in an infant school where there is no responsibility for KS2 progress.
However the major flaw in your approach relates to your reliance on high stakes statutory assessments with no reference to Cognitive Ability Test (CATs) data. CATs scores are better in general at predicting GCSE outcomes and massively so for FSM children such that when using CATs rather than SATs as the baseline, the attainment gap disappears. I realise that you do not have access to CATs data, but I do, from my time in the 1990s on the Cumbria LEA working group that administered the CATs data from tests taken in October in all the secondary schools.
I also have data from my study of Mossbourne Academy and the Hackney CATs based admissions systems that I report in my book, Learning Matters. Further confirmatory data has been obtained by my colleague John Mountfield and myself in the last year from secondary schools where Y7 pupils have taken CATs tests.
All of this is reported in a series of articles on my website where you can also find links to national CATs data that confirm that SATs scores are inflated compared to CATs and massively so for FSM pupils.
https://rogertitcombelearningmatters.wordpress.com/2018/08/15/potential-for-success-response-to-sutton-trust-article-by-dr-rebecca-montacute/
Do you know how it is possible to work out which students in your own school are long term disadvantaged?
Hi Nigel. If you use FFT Aspire, you should be able to see this in the term tracker of Student Explorer
I note that my comments are being ignored despite the evidence. All students are disadvantaged by cognitive ability deficits. The factual link between FSM and such deficits is uncomfortable but true and cannot be ignored because we don’t like the implications. I much preferred the ‘steady state’ theory of the universe compared to the ‘big bang’ however the evidence for the latter is irrefutable.
The positive is that cognitive ability/general intelligence is plastic and can be raised with the right kind of teaching and learning. This too is beyond doubt from the work of Michael Shayer & Philip Adey as explained here.
https://rogertitcombelearningmatters.wordpress.com/2018/09/22/definitive-research-that-shows-teaching-for-cognitive-development-can-permanently-raise-general-intelligence-in-pupils-of-all-abilities/
Hello Roger. Thanks for commenting. We get round to responding eventually but give us chance. Starting with the first point on changes in institution, yes we agree. We’ve done quite a lot over the years to raise awareness of the junior school issue (e.g. https://ffteducationdatalab.org.uk/2015/03/we-worry-about-teachers-inflating-results-we-should-worry-more-about-depression-of-baseline-assessments/). Turning to cognitive ability, yes this may well explain some (or even all) of the disadvantage gap, but I would suggest that this is orthogonal to the question addressed in the blogpost of how the gap in attainment we observe in national tests/ assessments (for all their flaws) emerges over time. We did a piece of work a few years back in which we collected a large sample of Year 7 CAT data from schools and linked this to GCSE outcomes. We found that the correlation between CAT and GCSE outcomes at pupil level was much the same as between KS2 and GCSE. We also found, as you say, that disadvantaged pupils tended to have lower CAT scores than other pupils with similar KS2 scores. It’s something we do intend to look at again at some point. What we don’t really have is any sense of how (or even if) these scores might change over a pupil’s lifetime. There’s also the question of whether Y7 CAT scores are depressed for some pupils (and disproportionately so for disadvantaged pupils) as a result of transitional issues.
Fortunately the truth of my last comment is at last gaining acceptance despite the contrary propaganda from the government in favour of knowledge-based instructional methods backed up with extreme abusive discipline. This is exemplified by the success for students of all abilities and their teachers in the ever growing ”Thinking Schools’ movement that you can read about here
https://rogertitcombelearningmatters.wordpress.com/2019/09/16/quality-education-needs-thinking-schools-not-behaviour-tzars-or-hero-innovators/
Hi Dave, thanks for your reply. I would argue that cognitive ability/general intelligence underpins attainment in a causative sense. The better developed and more sophisticated the cognition of the student, the more likely they can understand and respond rationally to hard exam questions. However exam success can also be achieved through gaming, which can take many forms from intensive revision and practising past test questions to selective cramming of answers to easier parts of the syllabus and full-on cheating.
In our marketised education system the student cohort results in statutory tests used for school performance tables are very high stakes for the school involving bonuses/sackings for ‘Executive’ school leaders and affecting the pay/promotional opportunities for teachers, resulting in a pervasive culture of corrupting perverse incentives. Even relatively benign exam gaming like intensive revision still robs students of cognitively developmental learning time by substituting short term school-benefiting activities for lifetime opportunity enhancing long-term personally developmental benefits.
CATs, formative teacher assessments and international PISA tests are low stakes because they do not identify schools in ‘performance tables’. SATs, being based on designated knowledge content are therefore much more susceptible to ‘gaming’ than CATs.
SATs performance, by the common experience of Y7 teachers is ephemeral, barely lasting the summer holidays with its permanent positive impact on cognition inversely proportional to the ‘gaming index’ of the teaching methods employed in Y6. It is important to note that not all primary schools go in for gaming. The junior school where I am a governor makes extensive use of P4C methods throughout Y6, with the local secondary school commenting positively on the ease in which Y7 pupils adapt to the transition.
I don’t think ‘transitional issues’ are in any way involved. The blame lies in the teaching methods used in Y6. In the same way that the GCSE results trumpeted by some high profile ‘Free Schools’ will only be taken seriously on the basis of post-16 progression data.
Not only does enhanced cognitive ability/general intelligence persist there is strong evidence that where cognitively development approaches like those advocated by the ‘Thinking Schools’ movement are used, further cognitive development is likely to result throughout life.
For these reasons I do believe that the ‘attainment gap’ illusion is a distraction from the deep pedagogical issues that need to be addressed in our schools if cognitive progression is to be achieved for all pupils of all abilities from all socio-economic backgrounds. These issues are discussed in this article.
https://rogertitcombelearningmatters.wordpress.com/2016/02/21/the-evidence-for-plastic-intelligence-and-why-it-matters/
Hi Roger,
I would agree that teaching understanding vs teaching to the test / exam practice should enable students to better cope with hard exam questions. Many years ago, when I worked in an LA context back in the 1990s, we found that primary schools who helped pupils to develop problem-solving skills properly (as compared to those who thought that AT1 meant doing a couple of investigations) had the highest VA scores at KS2. Interestingly, their pupils often answered fewer questions when compared to similar pupils in other schools – they just got more correct! What they were doing was, when they came to a type of question that they hadn’t seen before, was to solve the problem rather than just moving on to the next question.
I would, though, argue that transition could be a factor. The CATs manual (deep in the appendix) used to say that testing in first few weeks of Y7 was less reliable than at other times because of differences in how well pupils had settled in their new school. From work with dataset we had for the DfE work that Dave mentioned I remember finding that (relative to KS2 using regression analysis with matched pupil data) there was a drop in CAT Verbal for FSM and EAL pupils but most of this had disappeared if (a) CAT test done later in Y7 or (b) CAT data from Y8 was used.
Overall, though, I would suggest that we would be better served by trying to find ways of using different datasets together rather than getting too bogged down in ‘which one is right’ questions. If two data items say very different things then this should be a prompt to delve further – they might both be wrong!
Mike