




There was a lot of talk about improving attendance in the Schools White Paper, released earlier this year (92 mentions of the word “attendance”, in fact). This culminated in the “key delivery commitment” of a 1.3 percentage point (pp) increase in attendance between the 2023/24 and 2028/29 academic years. This is equivalent to a 0.9pp increase between 2024/25 and 2028/29, as attendance improved by 0.4 pp between 2023/24 and 2024/25.
When this was announced, some suggested that the target wasn’t ambitious enough, with attendance in 2028/29 due to remain below pre-pandemic levels[1]. But, with recent figures suggesting that progress in improving attendance might have stalled in 2025/26, and DfE due to provide attendance targets to every school individually, might it be more challenging than it appears?
This is what we’ll explore today using data from our 10,000 or so Attendance Tracker schools. We’re going to use the distribution of pupils by absence in the 2024/25 academic year, and model a number of scenarios which would result in a 0.9pp increase in attendance.
A uniform reduction in absence of 0.9pp
Let’s start with the simplest scenario: all pupils reduce their absence rates by 0.9pp (apart from those with zero absence already). We model this by shifting the distribution of pupils by absence down slightly, as illustrated below.
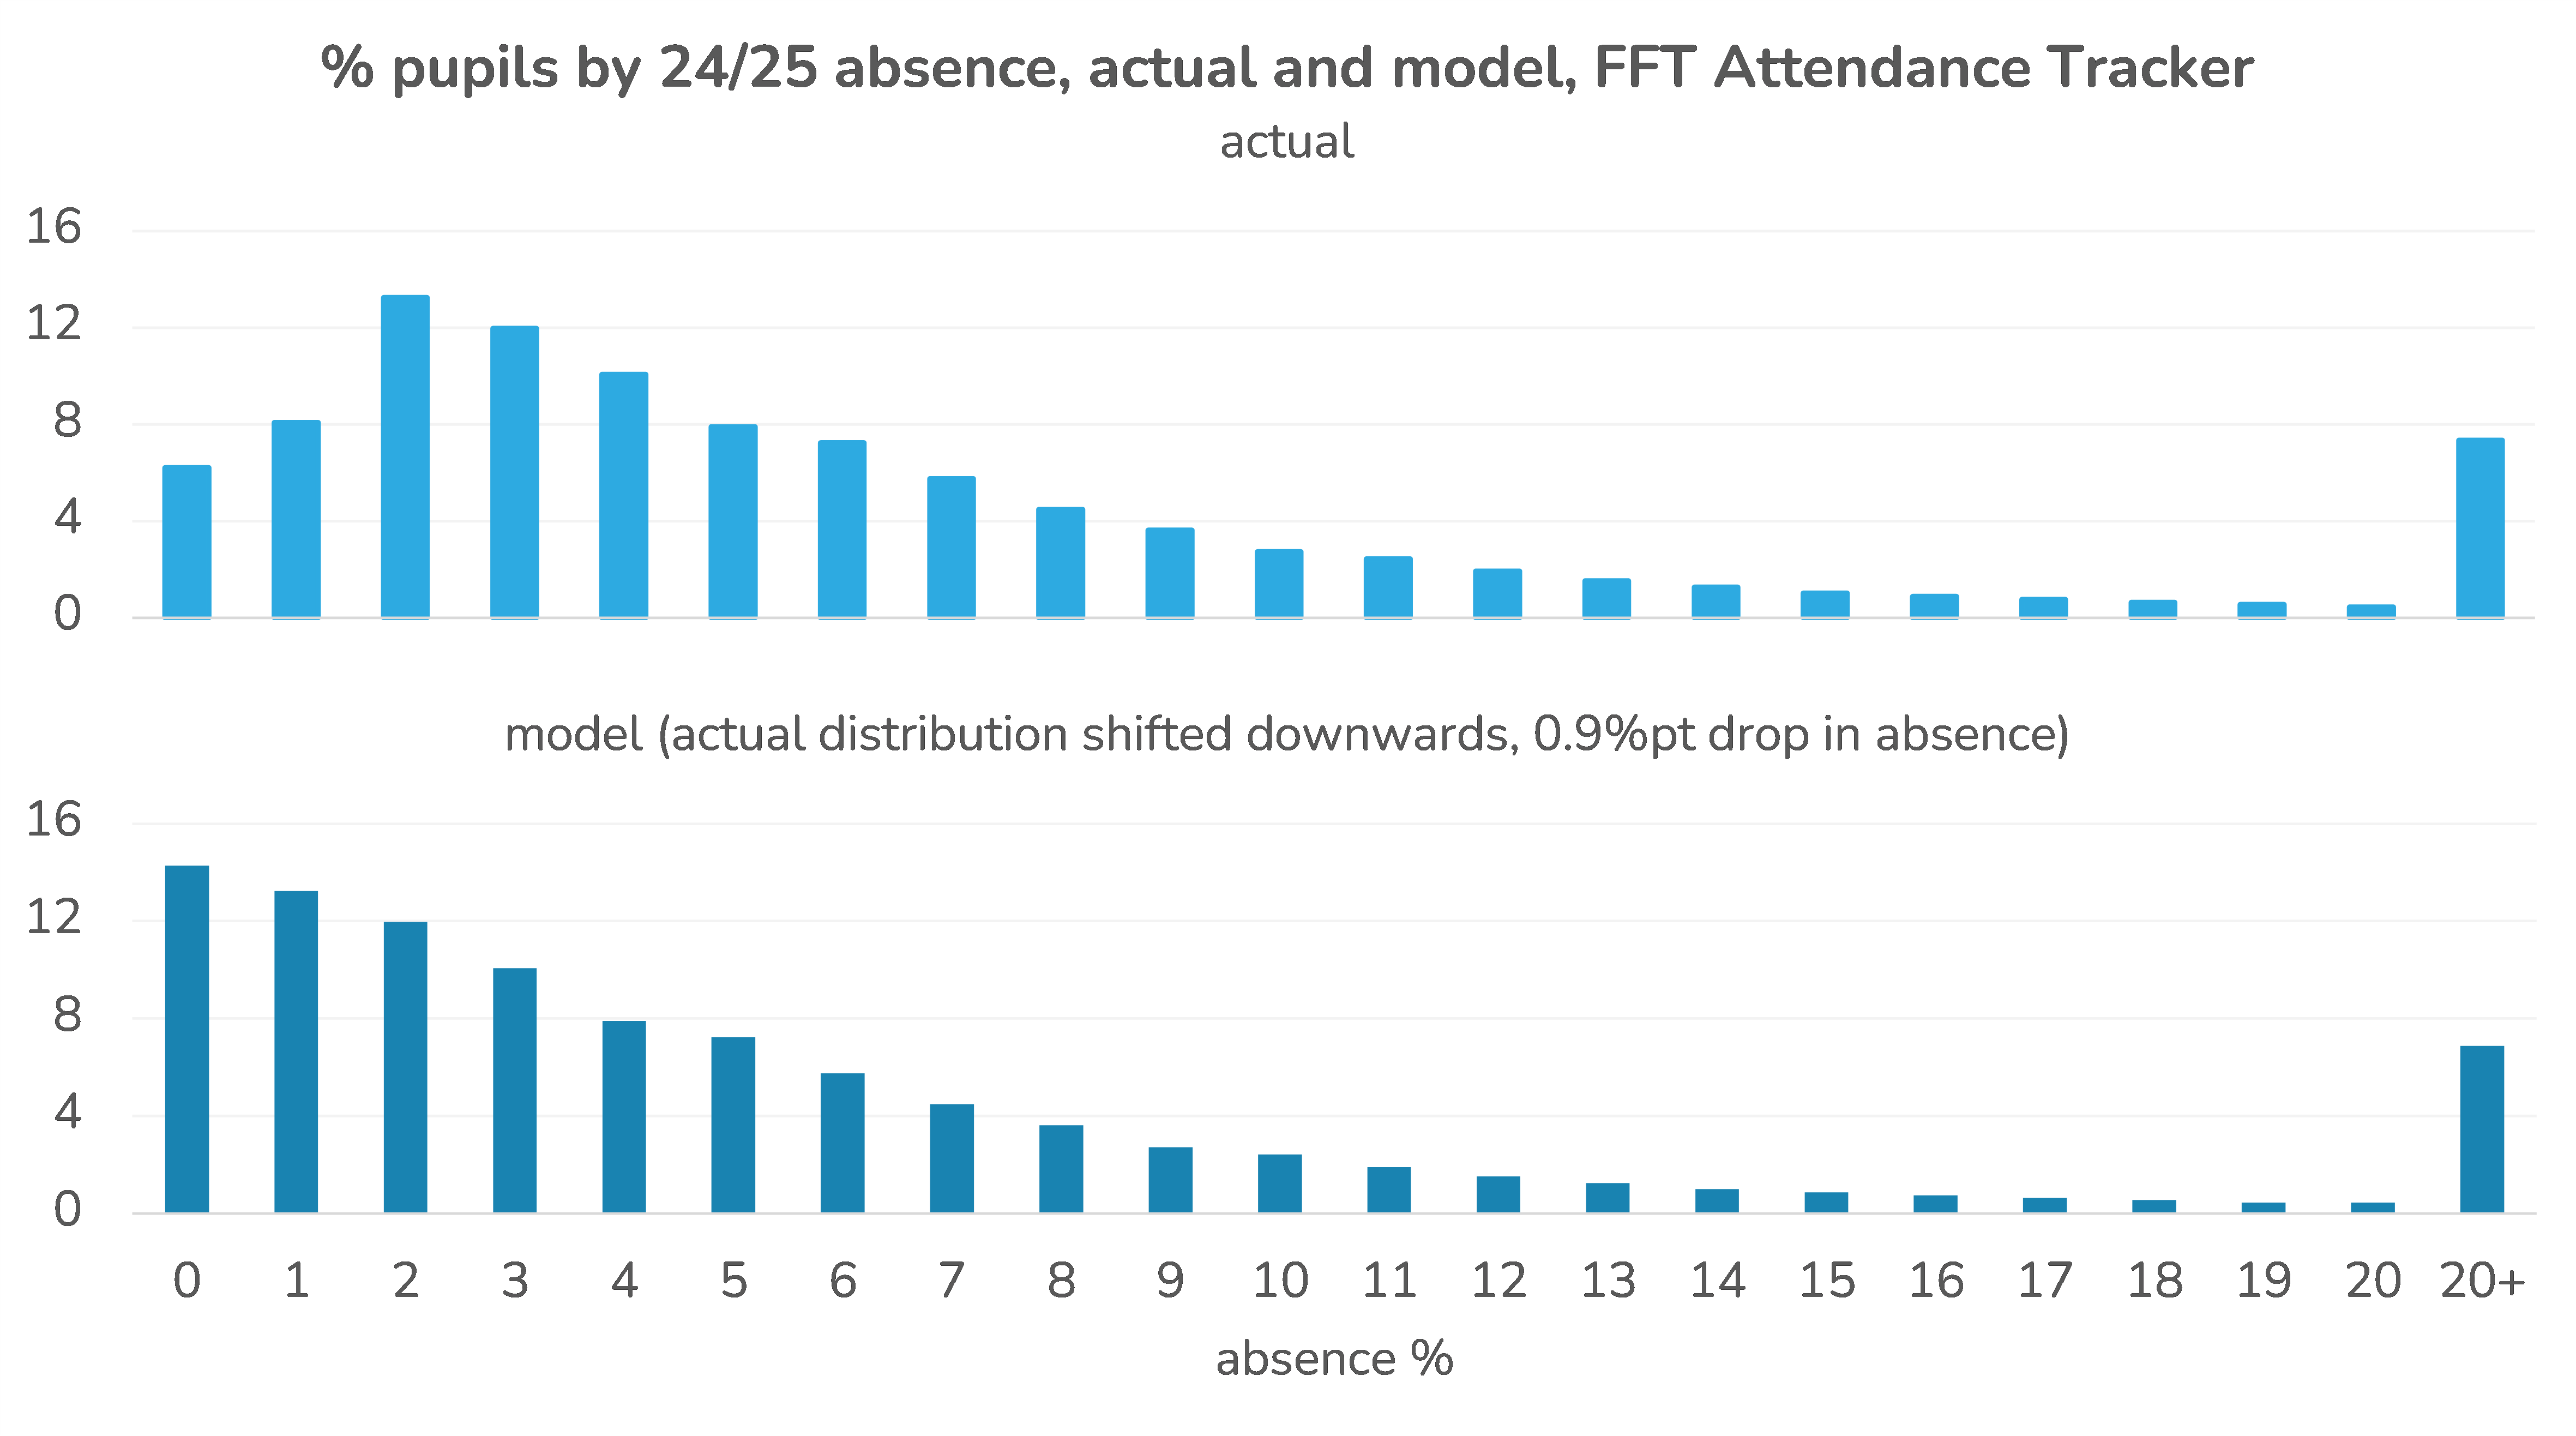
While this does indeed result in a fall of around 0.9pp, something interesting happens at the bottom end of the distribution. Because we’ve shifted everything down a bit, we get a bunching of pupils with zero or almost zero absence. In fact, 0% would be the most common absence rate of all.
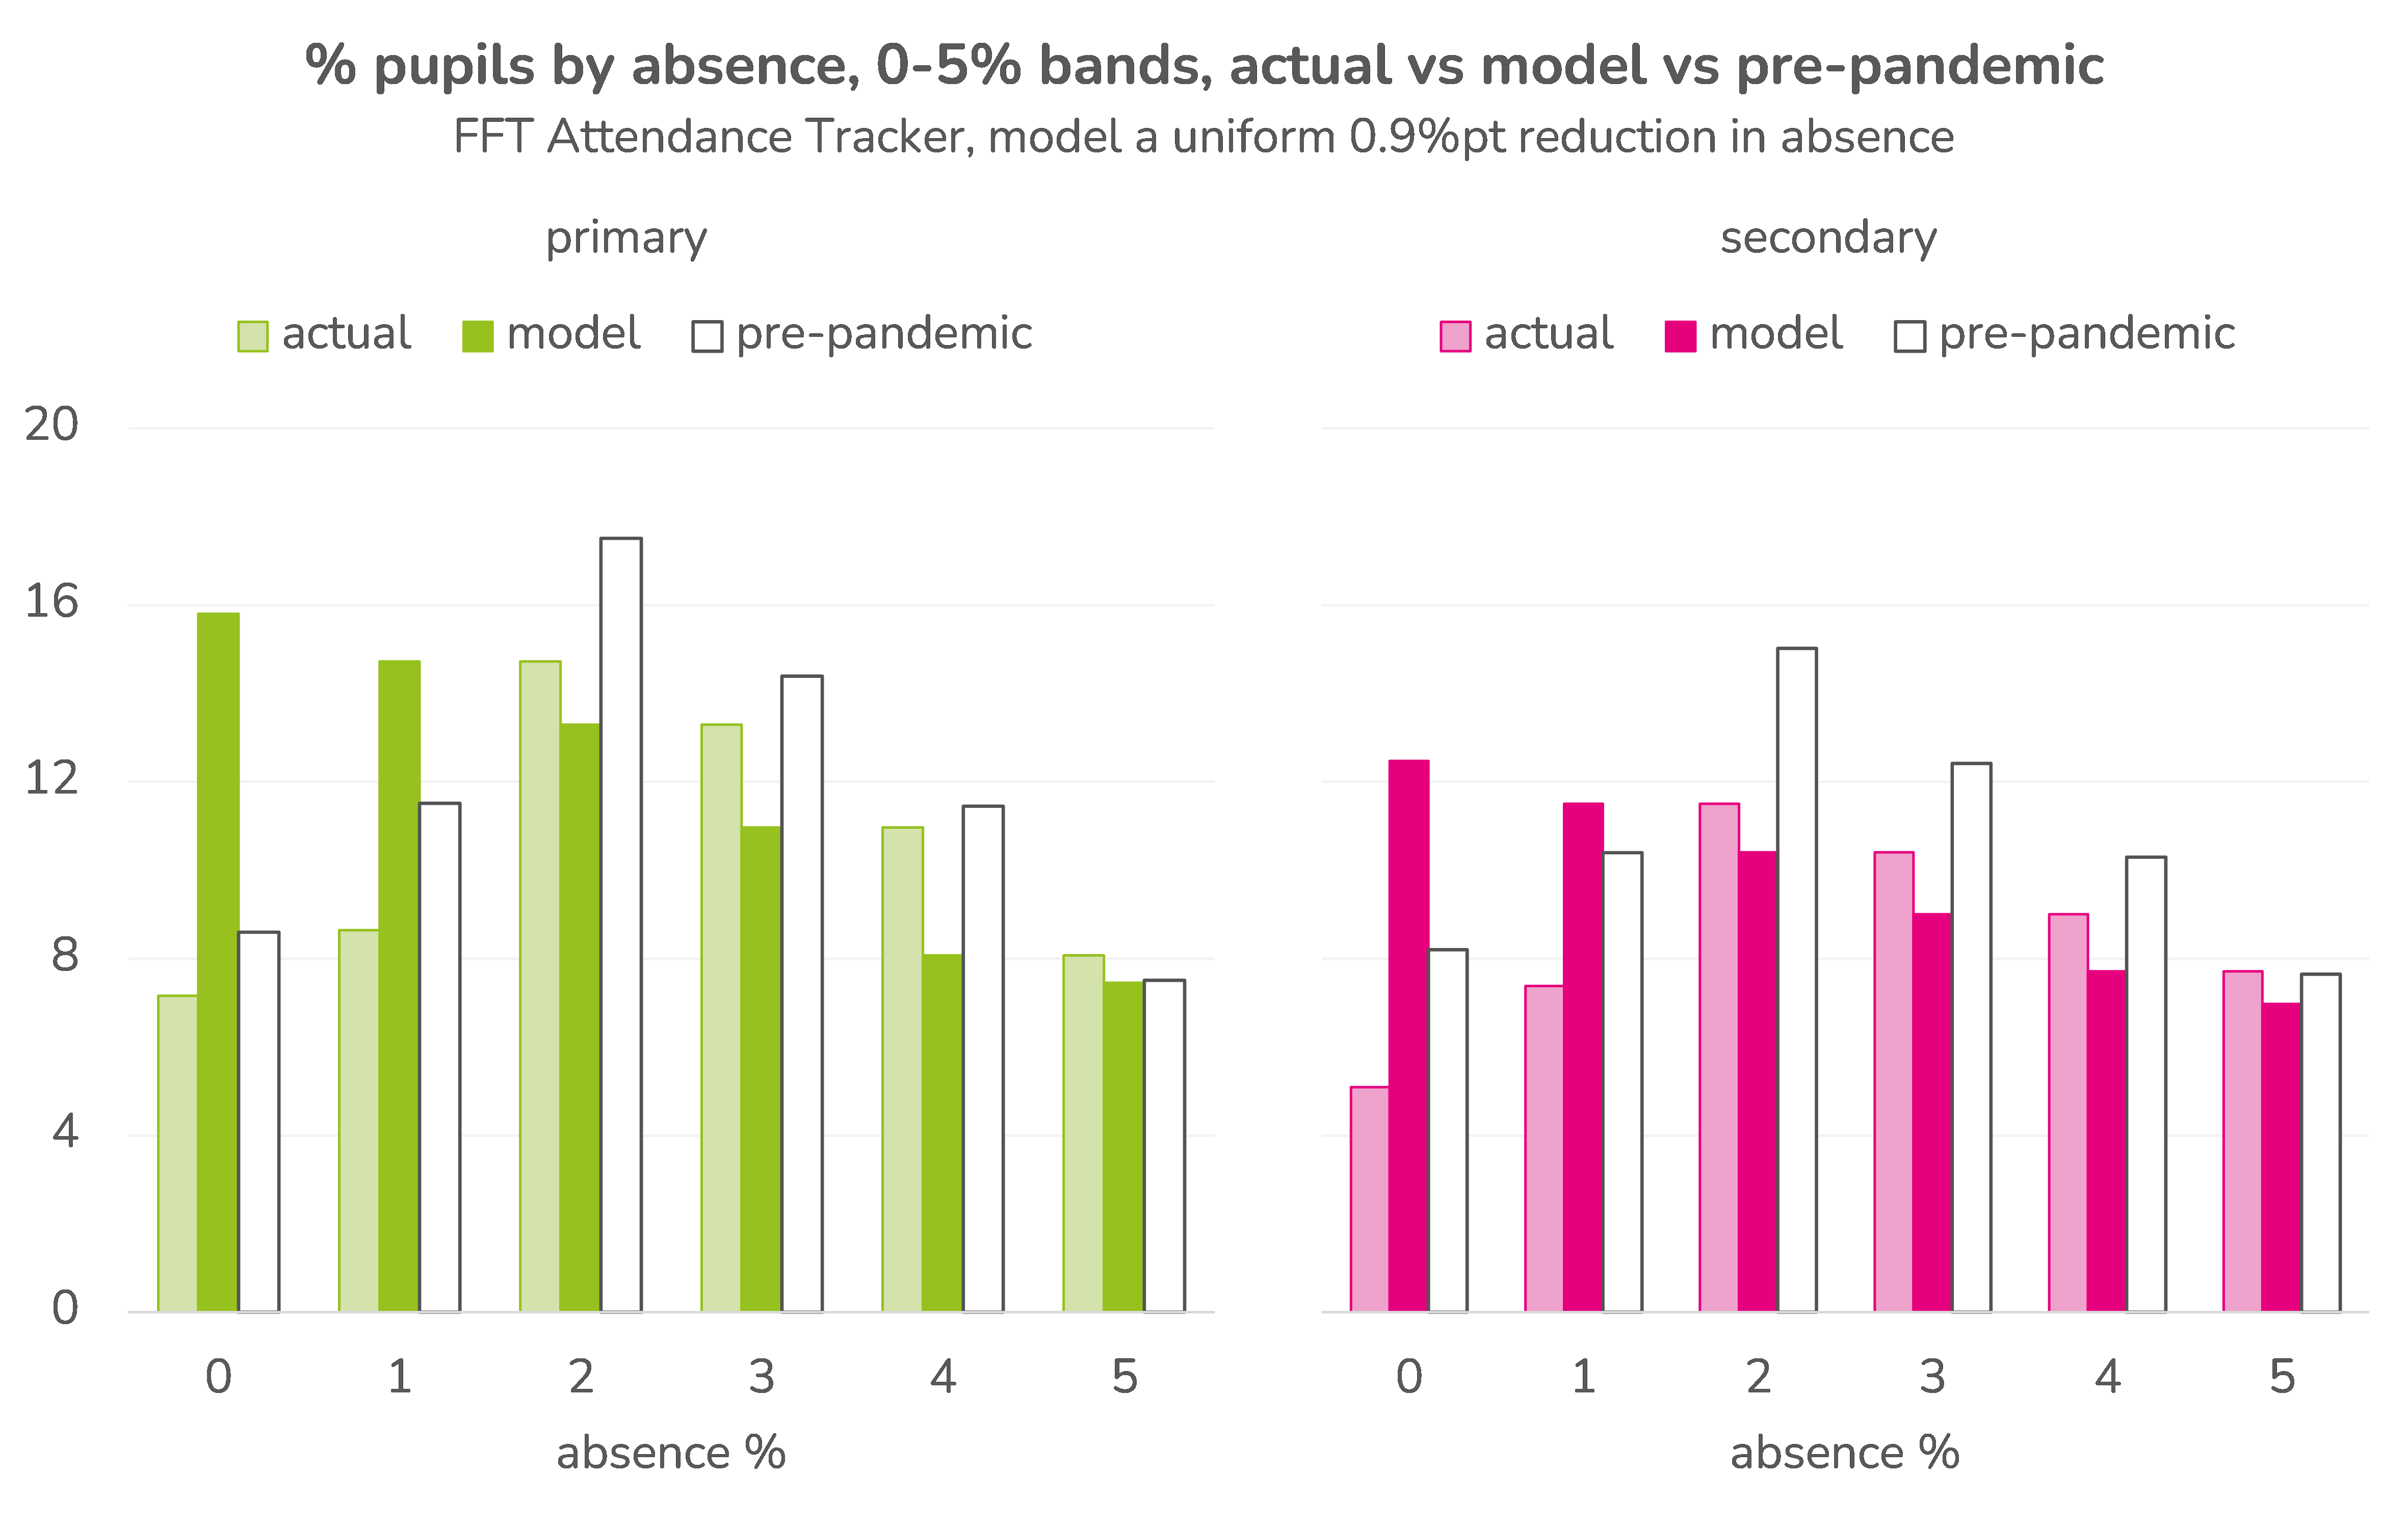
If we accept that this is unlikely then, in order for the target to be met, we’re going to need to see bigger falls for pupils with higher absence rates than lower.
Reducing severe absence
Let’s turn then to pupils with the highest rates of all, those who missed at least 50% of sessions, or “severe absentees”. At primary, the proportion of such pupils has roughly doubled since the pandemic (from 0.39% in 2018/19 to 0.93% in 2024/25), and at secondary, it has tripled (from 1.32% to 3.88%)[2].
We model a range of reductions in severe absence by shifting the part of the distribution above 50% down a number of times (while leaving the rest of the distribution unchanged). With each shift, we recalculate the overall absence and severe absence percentages. Below we plot the relationship between the two[3].
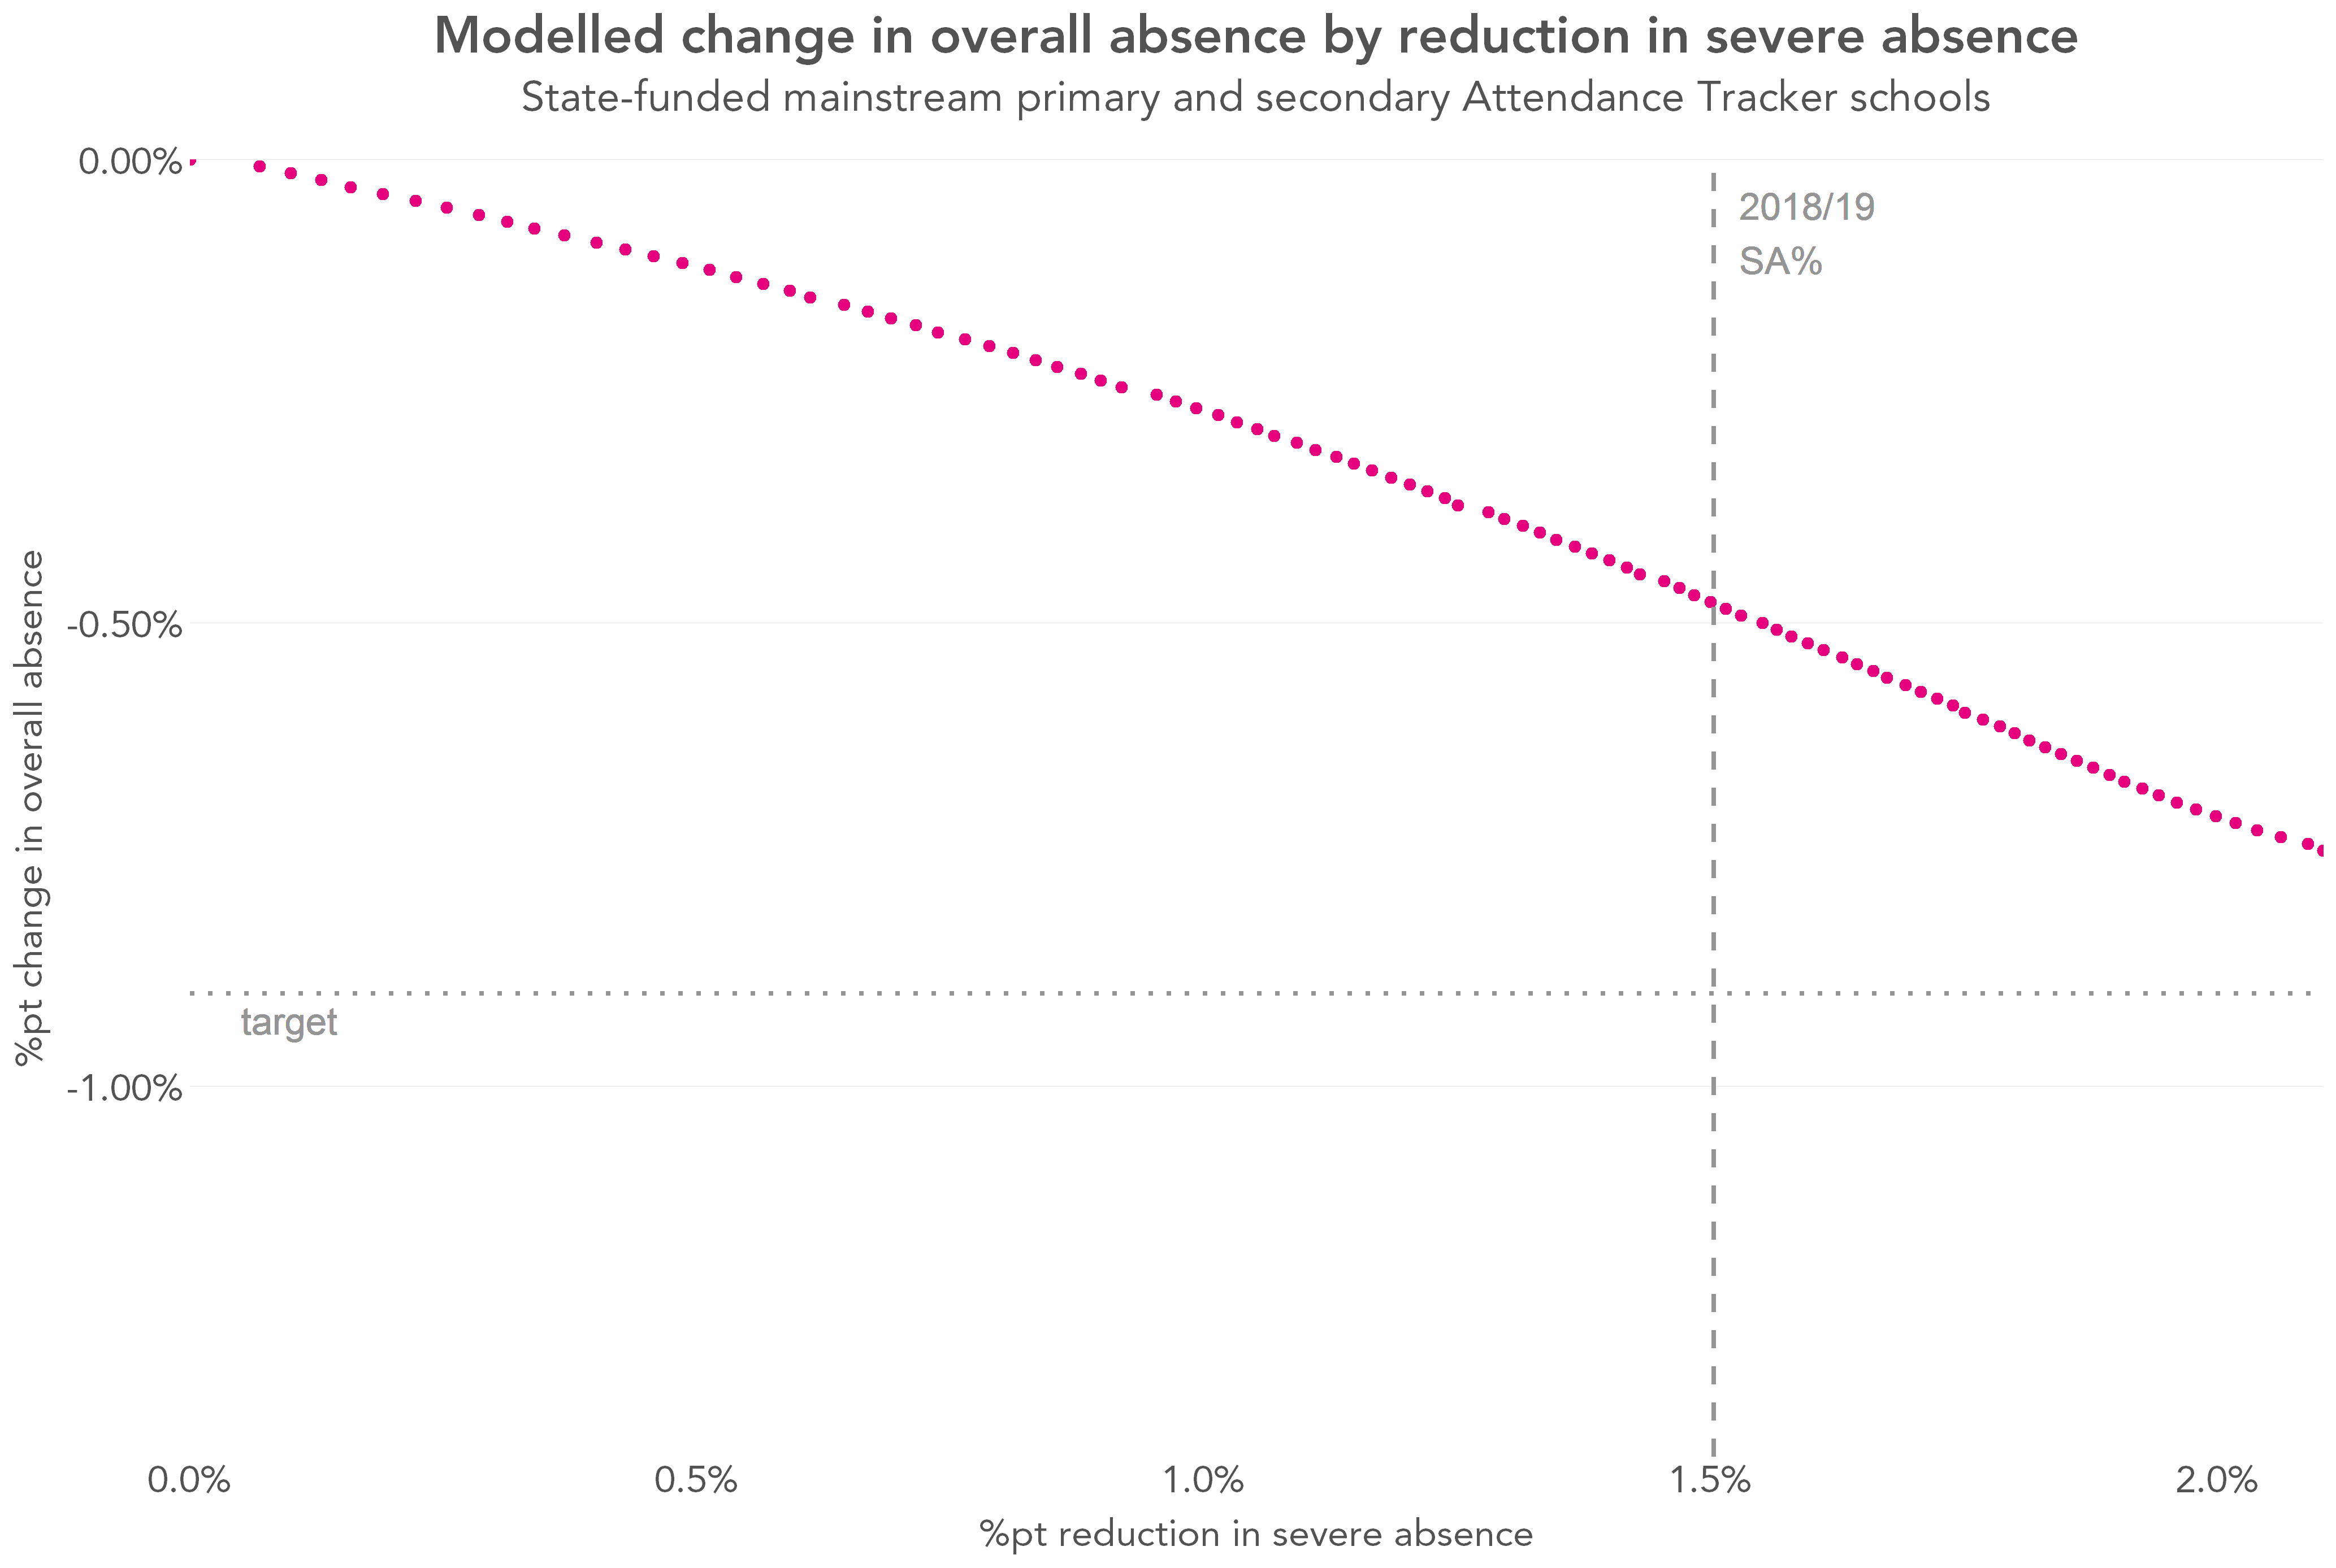
A fall in severe absence of 1.5pp, the dashed vertical line on the chart, would mark a return to pre-pandemic levels. Were this to happen, then the resulting fall in overall absence would be around 0.5pp. This would require severely absent pupils to improve their attendance by around 30pp (not shown on the chart).
A more modest fall in the severe absence rate, of 0.5pp, say, would reduce overall absence by around 0.1pp, and require an improvement of around 8pp in severely absent pupils’ attendance.
Reducing persistent but not severe absence
We turn now to persistent absence. Increases in persistent absence since the pandemic have affected more pupils than severe absence, but the proportional increase has been lower. At primary, persistent absence increased by around 60% (from 8.3% in 2018/19 to 13.0% in 2024/25) and at secondary, by around 70% (from 13.7% to 23.4%).
We apply our model to the section of the distribution where pupils are classed persistently but not severely absent, i.e. absence rates between 10% and 49%. Shifting this section of the distribution a number of times gives us the below relationship between reductions in persistent absence and overall absence.
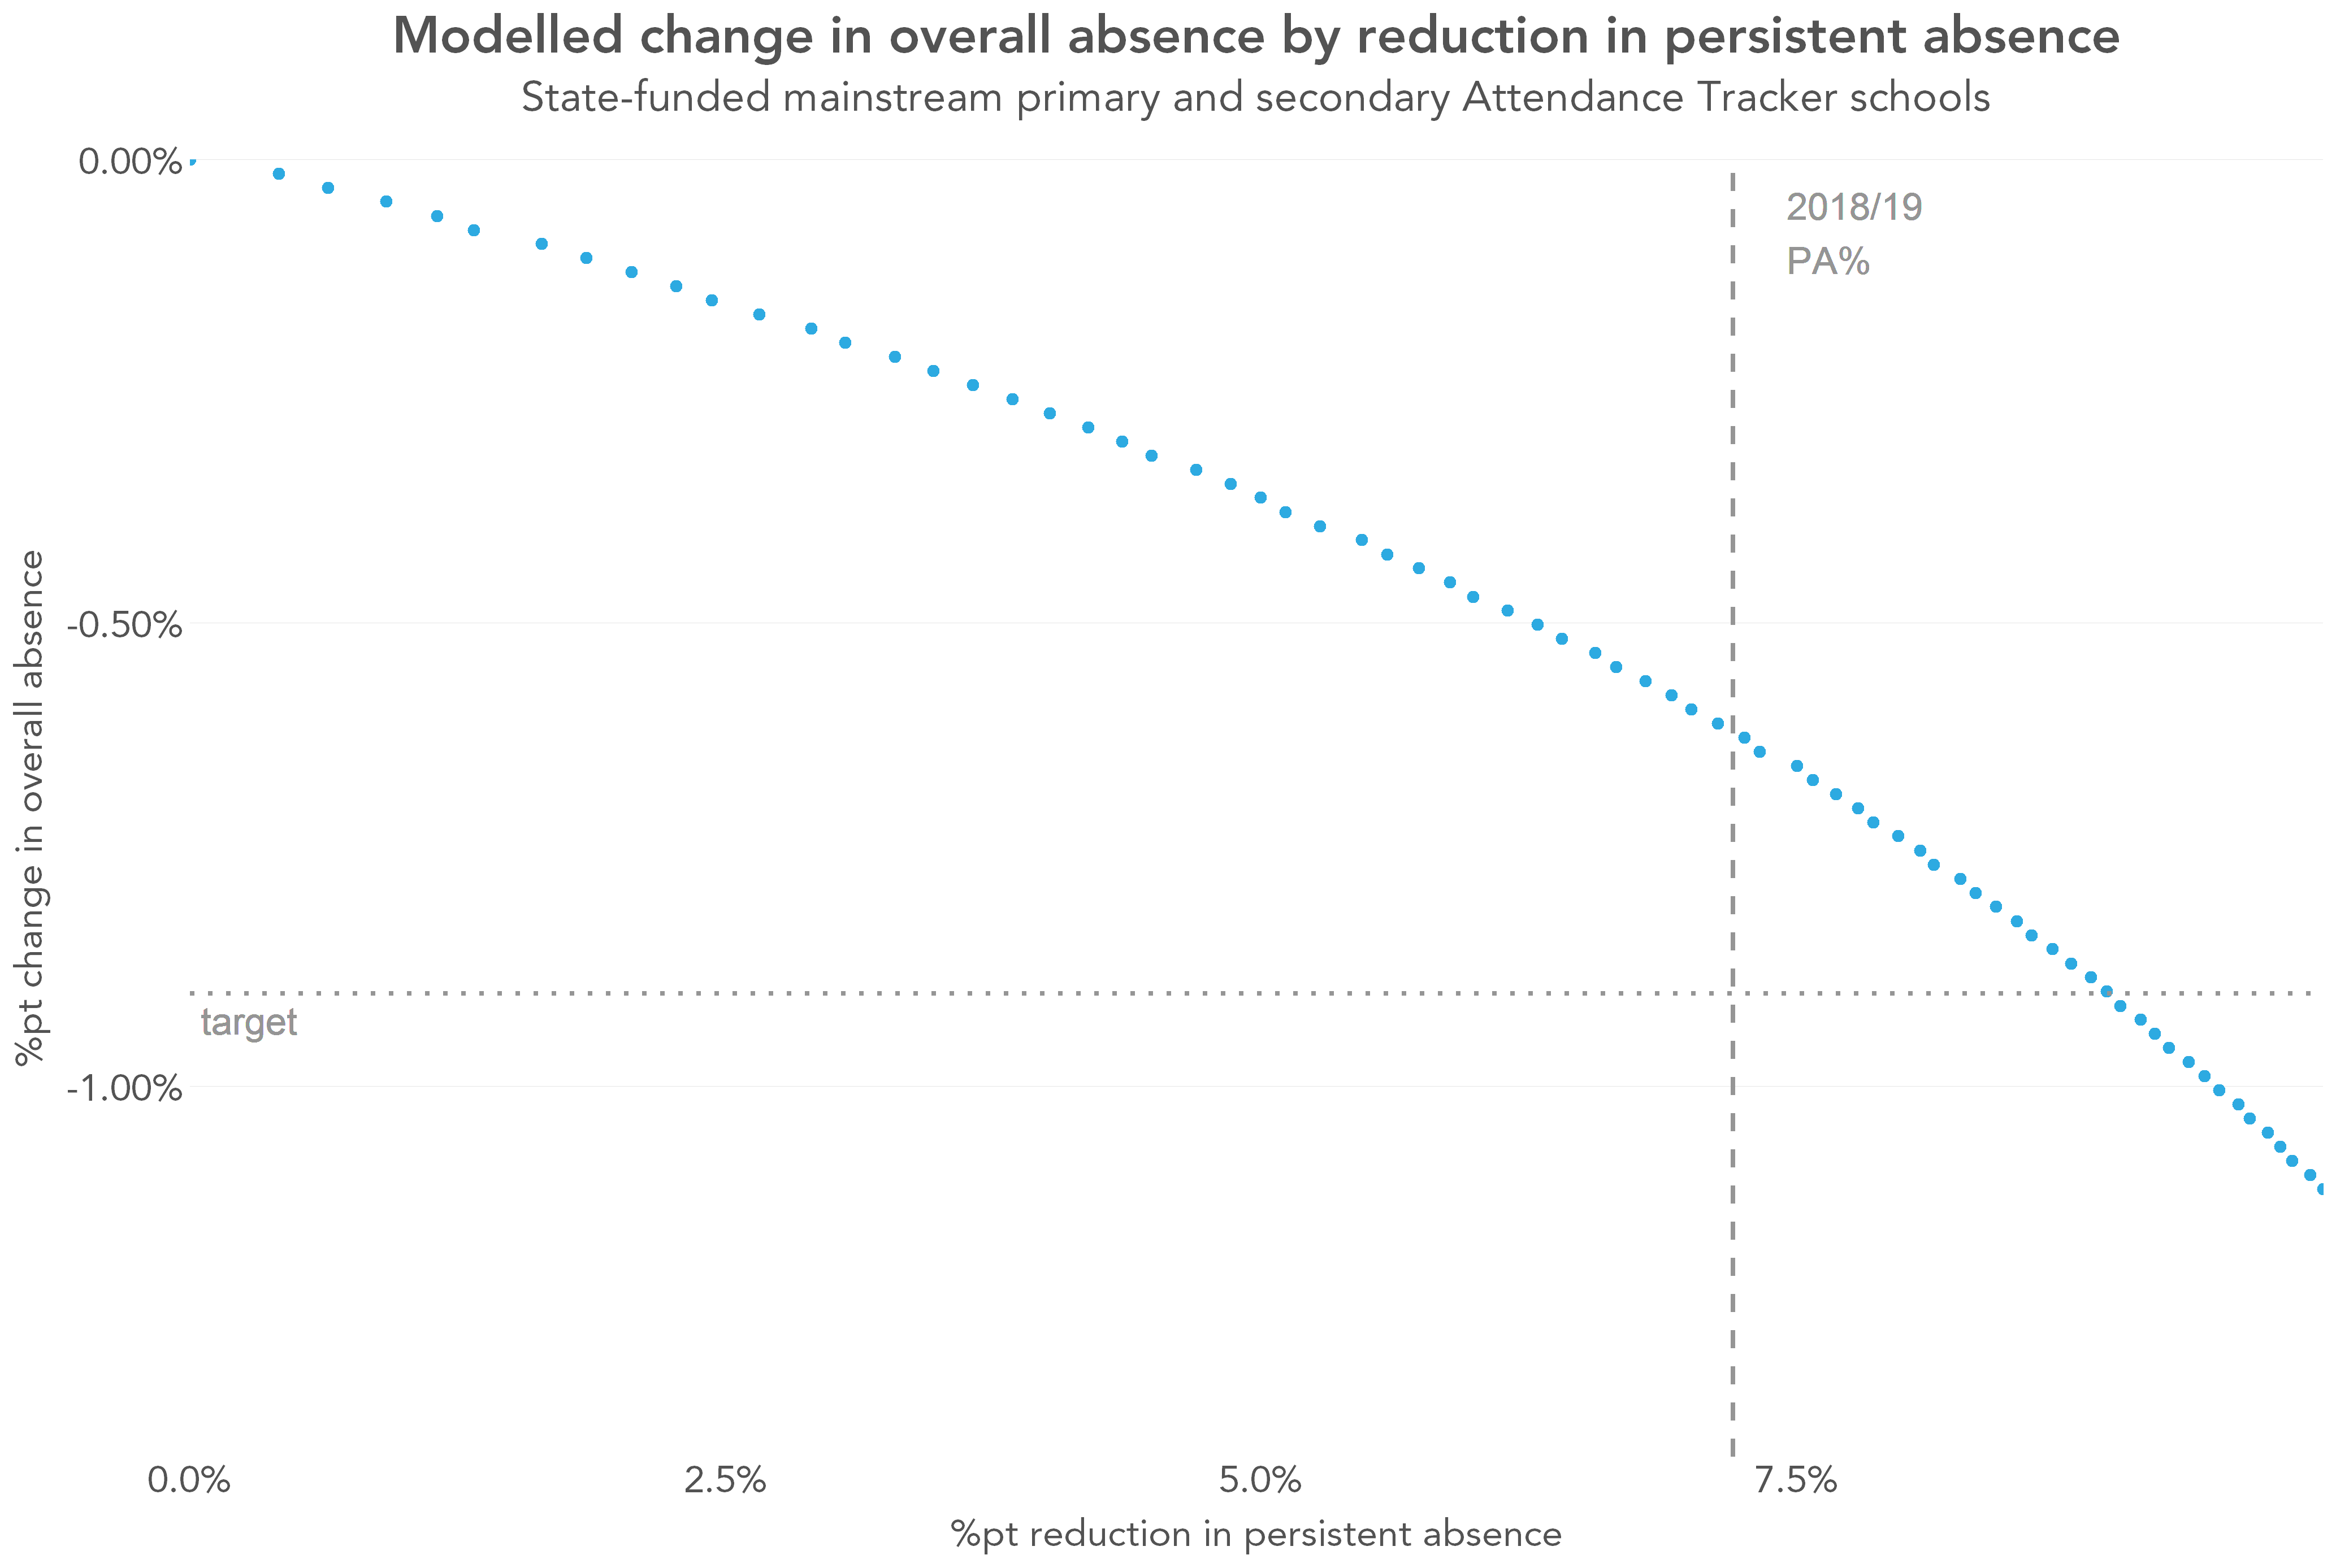
Persistent absence rates would need to fall by around 7pp to return to pre-pandemic levels. If this came from an improvement of the attendance of persistently but not severely absent pupils, then overall absence would fall by around 0.6pp (the corresponding improvement per affected pupil would be around 4pp).
If we saw persistent absence rates fall by half that, 3.5pp then, under the same assumptions, the fall in absence would also roughly halve, to 0.2-0.3pp. The corresponding improvement per affected pupil would be around 1.5pp.
Reducing absence among regular attenders
Finally, we turn to the group of pupils who are neither persistently nor severely absent, those with absence rates between 0 and 9%. We call this group “regular attenders” for ease, though acknowledge that some of these pupils could still be considered as missing too much school.
Being the inverse of persistent absence, the proportion of regular attenders has obviously declined since the pandemic. Their absence rates have also increased slightly, from 3.2% in 2018/19 to 3.6% in 2024/25[4].
Below, we plot the modelled improvement in the absence rates for this group[5] vs the improvement in absence overall.
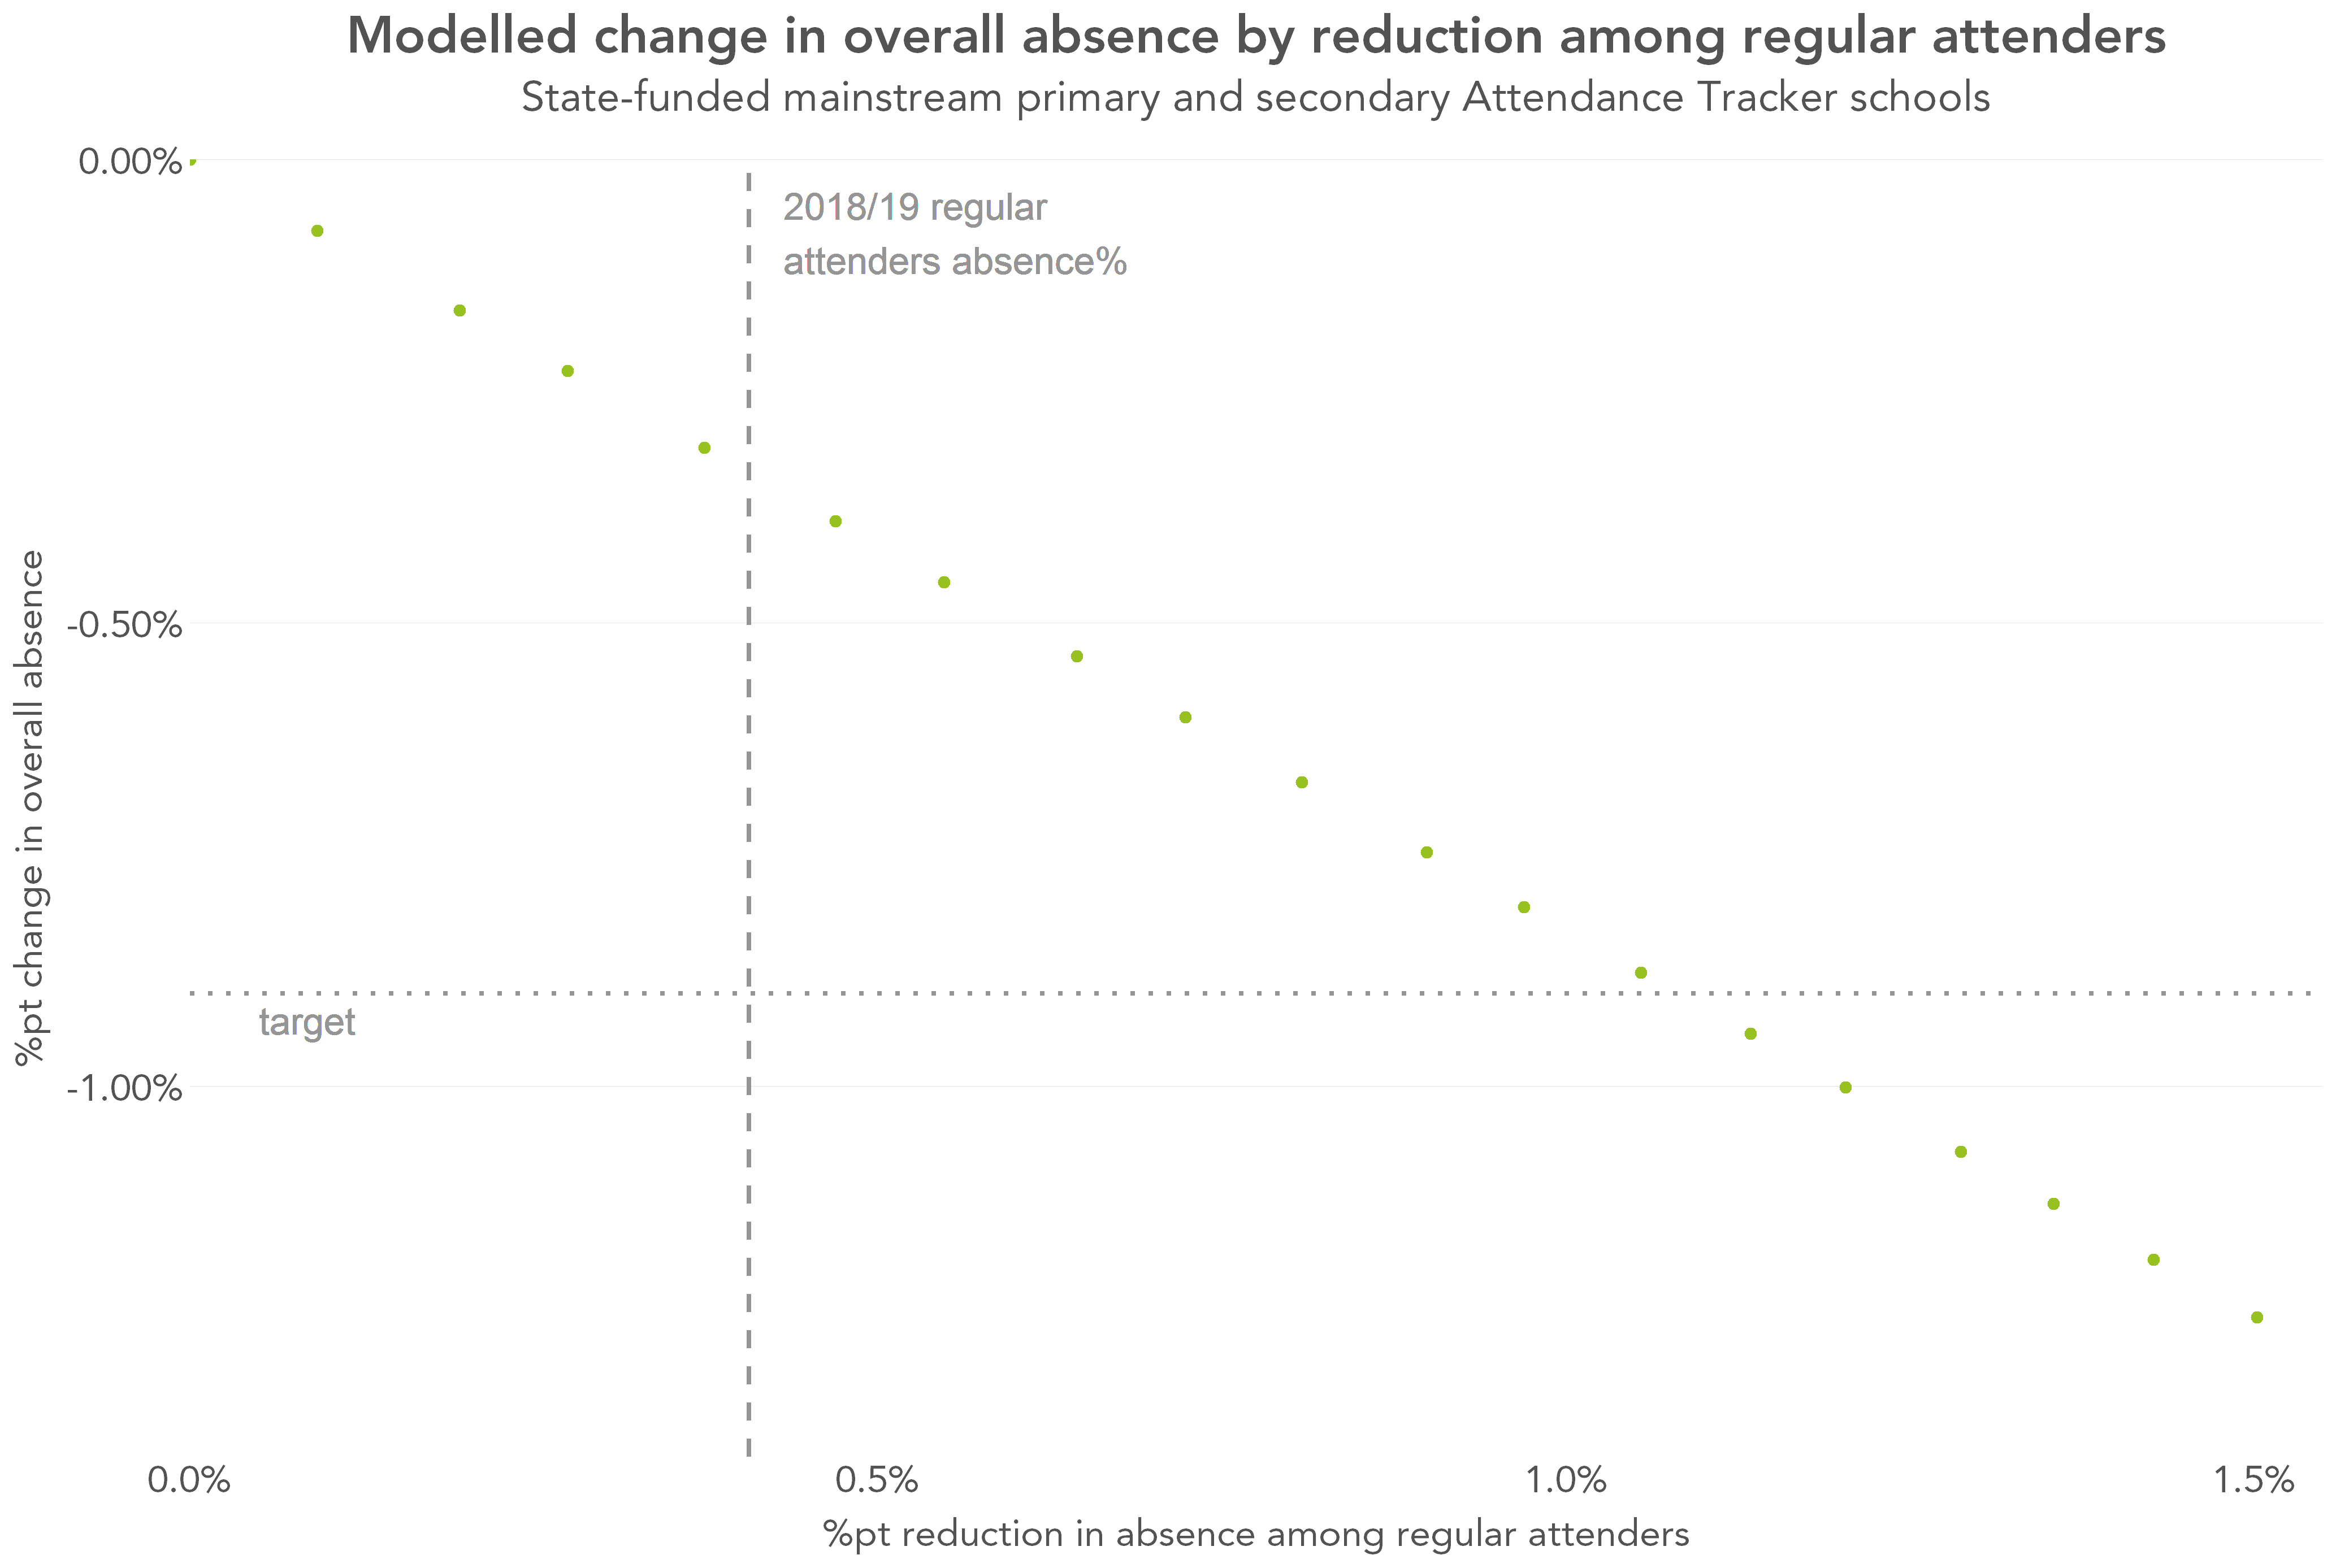
Due to the higher numbers of pupils compared with persistent and severe absence, relatively small changes among regular attenders lead to relatively large changes in overall absence.
If this group of pupils improved their attendance to pre-pandemic levels, then the overall absence rate would decrease by around 0.3pp.
Discussion
Altogether then, if we saw a return to pre-pandemic norms among all three groups of pupils (severe absentees, persistent but not severe absentees, and regular attenders) we would see a fall in overall absence of 1.4pp. This is made up of a fall of 0.5pp from the severely absent group, 0.6pp from the persistently but not severely absent group, and 0.3pp from the regular attenders.
However, given how high severe absence is, particularly at secondary, and the fact that it has increased rather than decreased over the past few years, a return to pre-pandemic severe absence rates by 2028/29 seems unlikely.
If there were no improvement in severe absence then, under our model, reaching the targeted 0.9pp drop would mean a full return to pre-pandemic rates among the other two groups: the persistently but not severely absent and the regular attenders.
While the scenarios we’ve modelled here are not exhaustive, it is clear that in order for the target to be met, substantial improvements must be made across the whole absence distribution. Perhaps the target in its current form, a modest-sounding percentage point increase, does not communicate the extent of this challenge adequately. Achieving it will require a diverse range of solutions, addressing very different problems for very different groups of pupils.
Don’t miss our free results day webinar on Thursday 10th September at 4pm. We will be looking at the national headlines in more depth, and what they might mean for the year ahead. Sign up now to book your place.
Want to stay up-to-date with the latest research from FFT Education Datalab? Sign up to Datalab’s mailing list to get notifications about new blogposts, or to receive the team’s half-termly newsletter.
[1] The targeted increase in attendance is measured from the 2023/24 academic year, when the overall absence rate was 7.1%. A 1.3pp increase in attendance or, equivalently, a 1.3pp reduction in absence, would take that to 5.8%. Overall absence in 2018/19, the last complete academic year before the pandemic, was 4.7%. https://explore-education-statistics.service.gov.uk/data-tables/permalink/71df7c32-647b-4846-b504-08decde23e45
[2] Source: https://explore-education-statistics.service.gov.uk/data-tables/permalink/23681367-38de-4c65-9639-08ded6b9e007
[3] Some severely absent pupils have absence rates of 100% – around 20% of the severely absent group at primary and 10% at secondary. We include these pupils in our population, so they count towards the severe absence and overall absence calculations, but we don’t include them in the part of the distribution that gets shifted.
[4] Derived by differencing from: https://explore-education-statistics.service.gov.uk/data-tables/permalink/ba7bc7cd-f909-46f9-48c8-08dee27d3d68
[5] We’re plotting the actual absence rate for the group after the change has been applied, rather than the change applied in the model. These two numbers aren’t the same because pupils can’t improve their absence beyond zero. For example, if we applied a change of 2pp, all pupils who previously had absence rates of 2% or above would see their absence drop by 2%, but those with absence rates already below 2% would see a smaller drop.
Leave A Comment